Cities with the Highest Costs of Housing as Percentage of Income in Washington
RELATED REPORTS & OPTIONS
Highest Housing Costs / Income
Washington
Compare Cities
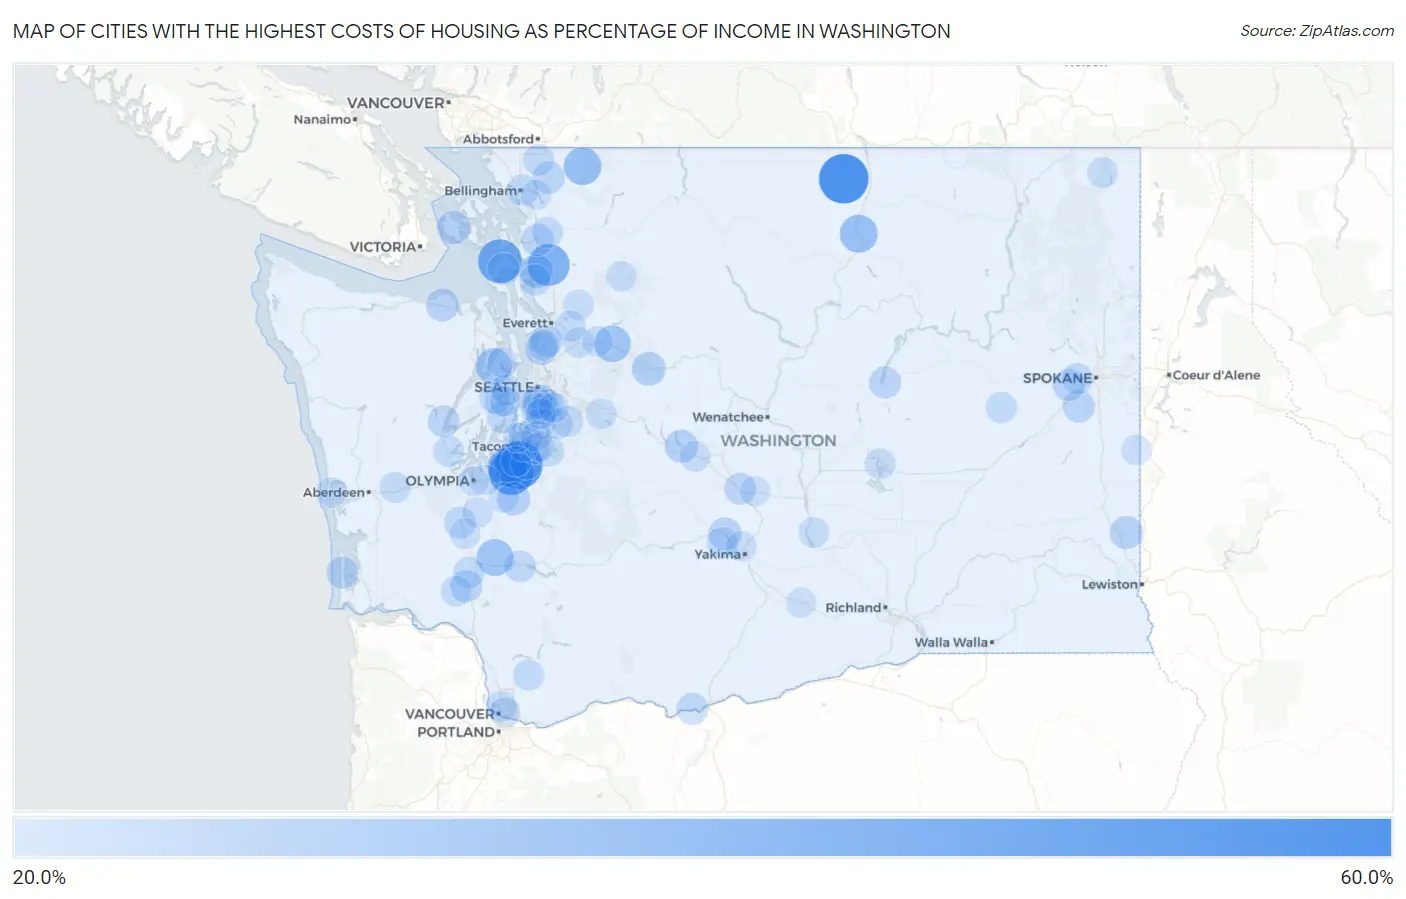
Map of Cities with the Highest Costs of Housing as Percentage of Income in Washington
0.0%
60.0%
Cities with the Highest Costs of Housing as Percentage of Income in Washington
| City | Housing Costs / Income | vs State | vs National | |
| 1. | Loomis | 58.4% | 22.0%(+36.5)#1 | 20.4%(+38.1)#50 |
| 2. | Mcchord Afb | 55.4% | 22.0%(+33.4)#2 | 20.4%(+35.0)#60 |
| 3. | Fort Lewis | 50.4% | 22.0%(+28.4)#3 | 20.4%(+30.0)#78 |
| 4. | Whidbey Island Station | 48.2% | 22.0%(+26.2)#4 | 20.4%(+27.8)#86 |
| 5. | Lake Mcmurray | 44.4% | 22.0%(+22.4)#5 | 20.4%(+24.0)#120 |
| 6. | North Fort Lewis | 40.2% | 22.0%(+18.2)#6 | 20.4%(+19.8)#190 |
| 7. | Riverside | 37.4% | 22.0%(+15.4)#7 | 20.4%(+17.0)#278 |
| 8. | Glacier | 37.1% | 22.0%(+15.1)#8 | 20.4%(+16.7)#292 |
| 9. | Onalaska | 35.5% | 22.0%(+13.5)#9 | 20.4%(+15.1)#373 |
| 10. | May Creek | 35.1% | 22.0%(+13.2)#10 | 20.4%(+14.8)#395 |
| 11. | Bangor Base | 34.4% | 22.0%(+12.4)#11 | 20.4%(+14.0)#444 |
| 12. | Skykomish | 30.5% | 22.0%(+8.51)#12 | 20.4%(+10.1)#886 |
| 13. | Lake Ketchum | 30.3% | 22.0%(+8.29)#13 | 20.4%(+9.89)#918 |
| 14. | Bow | 30.3% | 22.0%(+8.29)#14 | 20.4%(+9.89)#920 |
| 15. | Friday Harbor | 29.6% | 22.0%(+7.65)#15 | 20.4%(+9.25)#1,042 |
| 16. | Mckenna | 29.5% | 22.0%(+7.56)#16 | 20.4%(+9.16)#1,062 |
| 17. | Pullman | 29.4% | 22.0%(+7.45)#17 | 20.4%(+9.05)#1,088 |
| 18. | Roslyn | 29.4% | 22.0%(+7.44)#18 | 20.4%(+9.04)#1,090 |
| 19. | Boulevard Park | 29.2% | 22.0%(+7.26)#19 | 20.4%(+8.86)#1,135 |
| 20. | Naches | 28.7% | 22.0%(+6.77)#20 | 20.4%(+8.37)#1,249 |
| 21. | Carlsborg | 28.7% | 22.0%(+6.72)#21 | 20.4%(+8.32)#1,266 |
| 22. | Lynnwood | 28.4% | 22.0%(+6.46)#22 | 20.4%(+8.06)#1,339 |
| 23. | Kitsap Lake | 28.3% | 22.0%(+6.37)#23 | 20.4%(+7.97)#1,374 |
| 24. | Browns Point | 28.2% | 22.0%(+6.20)#24 | 20.4%(+7.80)#1,428 |
| 25. | Cheney | 28.1% | 22.0%(+6.16)#25 | 20.4%(+7.76)#1,442 |
| 26. | Deming | 28.1% | 22.0%(+6.15)#26 | 20.4%(+7.75)#1,447 |
| 27. | Burlington | 28.0% | 22.0%(+6.05)#27 | 20.4%(+7.64)#1,484 |
| 28. | Lake Stickney | 28.0% | 22.0%(+5.99)#28 | 20.4%(+7.59)#1,508 |
| 29. | Fairchild Afb | 27.9% | 22.0%(+5.92)#29 | 20.4%(+7.52)#1,538 |
| 30. | Banks Lake South | 27.8% | 22.0%(+5.87)#30 | 20.4%(+7.47)#1,565 |
| 31. | Hoodsport | 27.5% | 22.0%(+5.51)#31 | 20.4%(+7.11)#1,688 |
| 32. | Vader | 27.5% | 22.0%(+5.50)#32 | 20.4%(+7.10)#1,693 |
| 33. | Ellensburg | 27.5% | 22.0%(+5.50)#33 | 20.4%(+7.10)#1,696 |
| 34. | Ocean Park | 27.4% | 22.0%(+5.41)#34 | 20.4%(+7.01)#1,725 |
| 35. | White Center | 27.3% | 22.0%(+5.32)#35 | 20.4%(+6.92)#1,765 |
| 36. | Bryn Mawr Skyway | 27.3% | 22.0%(+5.30)#36 | 20.4%(+6.90)#1,780 |
| 37. | Oak Harbor | 27.3% | 22.0%(+5.29)#37 | 20.4%(+6.89)#1,785 |
| 38. | Mossyrock | 27.2% | 22.0%(+5.25)#38 | 20.4%(+6.85)#1,800 |
| 39. | Parkland | 27.2% | 22.0%(+5.21)#39 | 20.4%(+6.81)#1,810 |
| 40. | Wishram | 27.1% | 22.0%(+5.13)#40 | 20.4%(+6.73)#1,842 |
| 41. | Grand Mound | 27.1% | 22.0%(+5.12)#41 | 20.4%(+6.72)#1,847 |
| 42. | Burley | 26.8% | 22.0%(+4.85)#42 | 20.4%(+6.45)#1,981 |
| 43. | Clear Lake Cdp Pierce County | 26.7% | 22.0%(+4.70)#43 | 20.4%(+6.30)#2,061 |
| 44. | Shadow Lake | 26.6% | 22.0%(+4.61)#44 | 20.4%(+6.21)#2,102 |
| 45. | Bellingham | 26.5% | 22.0%(+4.57)#45 | 20.4%(+6.16)#2,122 |
| 46. | Nooksack | 26.5% | 22.0%(+4.56)#46 | 20.4%(+6.15)#2,130 |
| 47. | North Lynnwood | 26.5% | 22.0%(+4.54)#47 | 20.4%(+6.13)#2,142 |
| 48. | Airway Heights | 26.4% | 22.0%(+4.47)#48 | 20.4%(+6.07)#2,165 |
| 49. | Stanwood | 26.4% | 22.0%(+4.46)#49 | 20.4%(+6.05)#2,173 |
| 50. | Harrington | 26.3% | 22.0%(+4.33)#50 | 20.4%(+5.92)#2,241 |
| 51. | Tukwila | 26.3% | 22.0%(+4.31)#51 | 20.4%(+5.91)#2,246 |
| 52. | Winlock | 26.3% | 22.0%(+4.30)#52 | 20.4%(+5.90)#2,251 |
| 53. | Montesano | 26.1% | 22.0%(+4.15)#53 | 20.4%(+5.75)#2,326 |
| 54. | Sedro Woolley | 26.0% | 22.0%(+4.07)#54 | 20.4%(+5.67)#2,361 |
| 55. | Yacolt | 26.0% | 22.0%(+4.00)#55 | 20.4%(+5.59)#2,420 |
| 56. | Port Orchard | 25.9% | 22.0%(+3.94)#56 | 20.4%(+5.54)#2,451 |
| 57. | Cowiche | 25.9% | 22.0%(+3.92)#57 | 20.4%(+5.52)#2,468 |
| 58. | Shelton | 25.9% | 22.0%(+3.89)#58 | 20.4%(+5.49)#2,490 |
| 59. | Bremerton | 25.7% | 22.0%(+3.76)#59 | 20.4%(+5.36)#2,573 |
| 60. | Ryderwood | 25.7% | 22.0%(+3.74)#60 | 20.4%(+5.34)#2,584 |
| 61. | Enetai | 25.7% | 22.0%(+3.72)#61 | 20.4%(+5.32)#2,595 |
| 62. | Everett | 25.7% | 22.0%(+3.71)#62 | 20.4%(+5.30)#2,605 |
| 63. | Fife | 25.7% | 22.0%(+3.68)#63 | 20.4%(+5.27)#2,626 |
| 64. | Granite Falls | 25.6% | 22.0%(+3.63)#64 | 20.4%(+5.23)#2,662 |
| 65. | South Cle Elum | 25.6% | 22.0%(+3.62)#65 | 20.4%(+5.22)#2,669 |
| 66. | Sumner | 25.5% | 22.0%(+3.51)#66 | 20.4%(+5.11)#2,729 |
| 67. | Des Moines | 25.4% | 22.0%(+3.45)#67 | 20.4%(+5.05)#2,758 |
| 68. | East Port Orchard | 25.4% | 22.0%(+3.39)#68 | 20.4%(+4.99)#2,798 |
| 69. | Burien | 25.3% | 22.0%(+3.36)#69 | 20.4%(+4.96)#2,813 |
| 70. | Kent | 25.3% | 22.0%(+3.36)#70 | 20.4%(+4.96)#2,816 |
| 71. | Metaline Falls | 25.3% | 22.0%(+3.34)#71 | 20.4%(+4.94)#2,832 |
| 72. | Monroe | 25.3% | 22.0%(+3.33)#72 | 20.4%(+4.93)#2,836 |
| 73. | Wilderness Rim | 25.3% | 22.0%(+3.32)#73 | 20.4%(+4.92)#2,842 |
| 74. | Hazel Dell | 25.3% | 22.0%(+3.32)#74 | 20.4%(+4.92)#2,845 |
| 75. | Cascade Valley | 25.2% | 22.0%(+3.27)#75 | 20.4%(+4.87)#2,879 |
| 76. | Mattawa | 25.2% | 22.0%(+3.19)#76 | 20.4%(+4.78)#2,941 |
| 77. | Clear Lake Cdp Skagit County | 25.1% | 22.0%(+3.14)#77 | 20.4%(+4.74)#2,970 |
| 78. | Tacoma | 25.1% | 22.0%(+3.12)#78 | 20.4%(+4.72)#2,982 |
| 79. | Federal Way | 25.1% | 22.0%(+3.11)#79 | 20.4%(+4.71)#2,992 |
| 80. | Selah | 25.0% | 22.0%(+3.05)#80 | 20.4%(+4.65)#3,034 |
| 81. | Vancouver | 25.0% | 22.0%(+3.01)#81 | 20.4%(+4.61)#3,063 |
| 82. | Sultan | 24.9% | 22.0%(+2.97)#82 | 20.4%(+4.57)#3,100 |
| 83. | Lakewood | 24.9% | 22.0%(+2.93)#83 | 20.4%(+4.53)#3,136 |
| 84. | Yelm | 24.9% | 22.0%(+2.91)#84 | 20.4%(+4.51)#3,155 |
| 85. | Centralia | 24.9% | 22.0%(+2.90)#85 | 20.4%(+4.49)#3,168 |
| 86. | Seatac | 24.9% | 22.0%(+2.89)#86 | 20.4%(+4.49)#3,171 |
| 87. | Tekoa | 24.8% | 22.0%(+2.84)#87 | 20.4%(+4.44)#3,206 |
| 88. | Poulsbo | 24.8% | 22.0%(+2.78)#88 | 20.4%(+4.38)#3,243 |
| 89. | Tenino | 24.7% | 22.0%(+2.76)#89 | 20.4%(+4.36)#3,263 |
| 90. | Lacey | 24.7% | 22.0%(+2.72)#90 | 20.4%(+4.32)#3,293 |
| 91. | Tehaleh | 24.7% | 22.0%(+2.71)#91 | 20.4%(+4.31)#3,307 |
| 92. | Darrington | 24.6% | 22.0%(+2.64)#92 | 20.4%(+4.24)#3,354 |
| 93. | Renton | 24.6% | 22.0%(+2.61)#93 | 20.4%(+4.21)#3,380 |
| 94. | Sudden Valley | 24.5% | 22.0%(+2.55)#94 | 20.4%(+4.15)#3,425 |
| 95. | Olympia | 24.5% | 22.0%(+2.48)#95 | 20.4%(+4.08)#3,476 |
| 96. | Kittitas | 24.4% | 22.0%(+2.40)#96 | 20.4%(+4.00)#3,555 |
| 97. | Sunnyside | 24.3% | 22.0%(+2.35)#97 | 20.4%(+3.95)#3,602 |
| 98. | Ruston | 24.3% | 22.0%(+2.29)#98 | 20.4%(+3.89)#3,651 |
| 99. | Milton | 24.3% | 22.0%(+2.29)#99 | 20.4%(+3.88)#3,654 |
| 100. | Ocean Shores | 24.2% | 22.0%(+2.28)#100 | 20.4%(+3.87)#3,662 |
Common Questions
What are the Top 10 Cities with the Highest Costs of Housing as Percentage of Income in Washington?
Top 10 Cities with the Highest Costs of Housing as Percentage of Income in Washington are:
#1
58.4%
#2
55.4%
#3
50.4%
#4
48.2%
#5
44.4%
#6
40.2%
#7
37.4%
#8
37.1%
#9
35.5%
#10
35.1%
What city has the Highest Costs of Housing as Percentage of Income in Washington?
Loomis has the Highest Costs of Housing as Percentage of Income in Washington with 58.4%.
What is the Average Housing Costs as Percentage of Income in the State of Washington?
Average Housing Costs as Percentage of Income in Washington is 22.0%.
What is the Average Housing Costs as Percentage of Income in the United States?
Average Housing Costs as Percentage of Income in the United States is 20.4%.