Cities with the Largest Chippewa Community in Washington
RELATED REPORTS & OPTIONS
Chippewa
Washington
Compare Cities
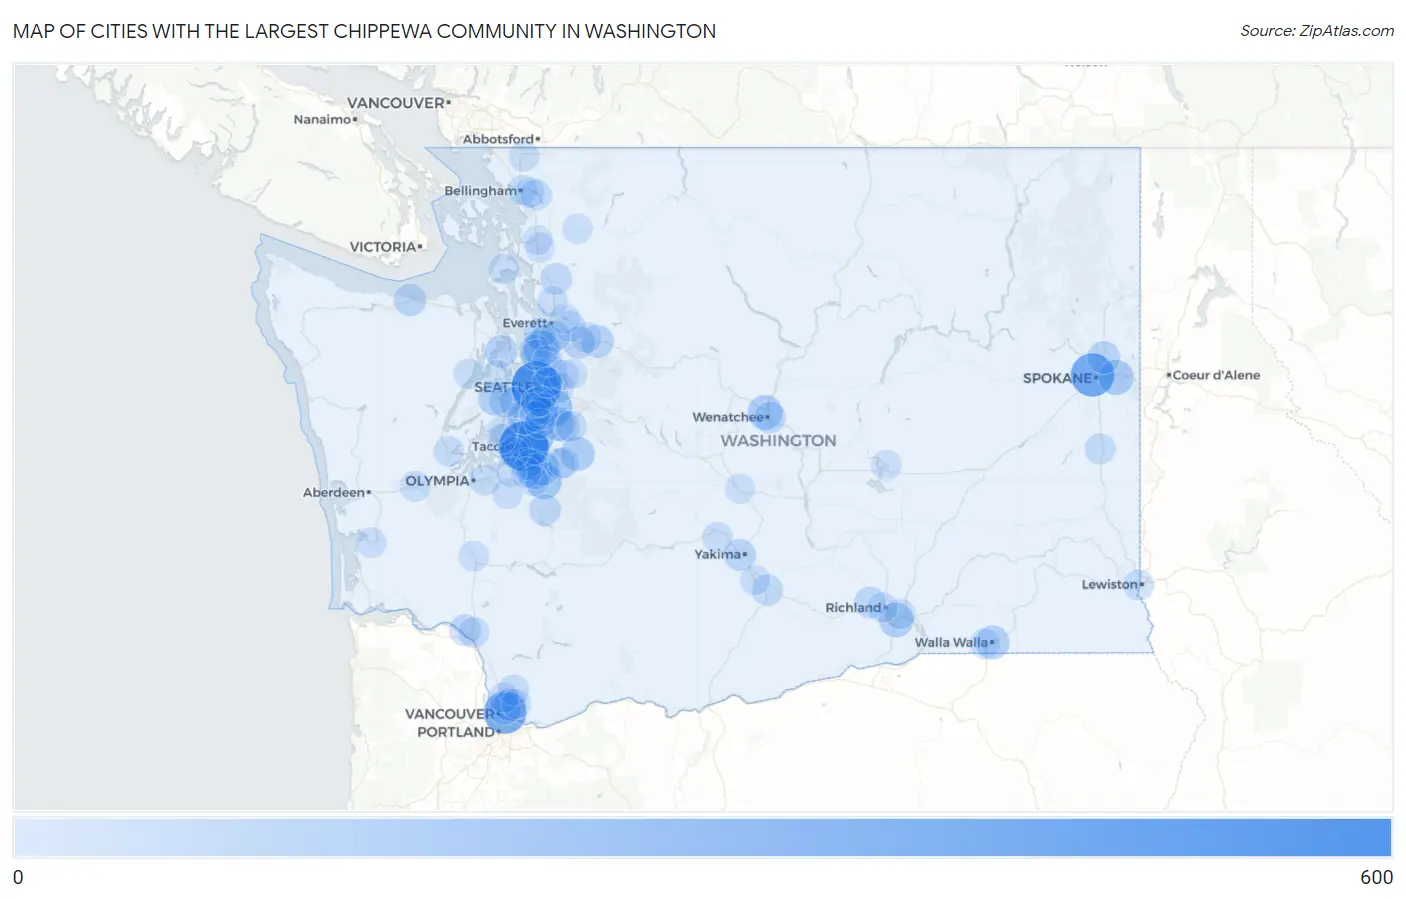
Map of Cities with the Largest Chippewa Community in Washington
0
600
Cities with the Largest Chippewa Community in Washington
| City | Chippewa | vs State | vs National | |
| 1. | Seattle | 527 | 7,750(6.80%)#1 | 191,286(0.28%)#38 |
| 2. | Tacoma | 523 | 7,750(6.75%)#2 | 191,286(0.27%)#39 |
| 3. | Spokane | 362 | 7,750(4.67%)#3 | 191,286(0.19%)#57 |
| 4. | Vancouver | 342 | 7,750(4.41%)#4 | 191,286(0.18%)#63 |
| 5. | Renton | 195 | 7,750(2.52%)#5 | 191,286(0.10%)#108 |
| 6. | Lynnwood | 156 | 7,750(2.01%)#6 | 191,286(0.08%)#147 |
| 7. | Federal Way | 155 | 7,750(2.00%)#7 | 191,286(0.08%)#150 |
| 8. | Graham | 155 | 7,750(2.00%)#8 | 191,286(0.08%)#151 |
| 9. | Frederickson | 146 | 7,750(1.88%)#9 | 191,286(0.08%)#161 |
| 10. | Spokane Valley | 137 | 7,750(1.77%)#10 | 191,286(0.07%)#172 |
| 11. | Vashon | 134 | 7,750(1.73%)#11 | 191,286(0.07%)#182 |
| 12. | Wenatchee | 129 | 7,750(1.66%)#12 | 191,286(0.07%)#188 |
| 13. | Kennewick | 124 | 7,750(1.60%)#13 | 191,286(0.06%)#195 |
| 14. | Enumclaw | 117 | 7,750(1.51%)#14 | 191,286(0.06%)#213 |
| 15. | Kent | 112 | 7,750(1.45%)#15 | 191,286(0.06%)#229 |
| 16. | Walla Walla | 104 | 7,750(1.34%)#16 | 191,286(0.05%)#250 |
| 17. | South Hill | 102 | 7,750(1.32%)#17 | 191,286(0.05%)#257 |
| 18. | Lake Stickney | 100 | 7,750(1.29%)#18 | 191,286(0.05%)#262 |
| 19. | Bremerton | 98 | 7,750(1.26%)#19 | 191,286(0.05%)#266 |
| 20. | Burien | 84 | 7,750(1.08%)#20 | 191,286(0.04%)#325 |
| 21. | Sultan | 78 | 7,750(1.01%)#21 | 191,286(0.04%)#358 |
| 22. | Monroe | 77 | 7,750(0.99%)#22 | 191,286(0.04%)#363 |
| 23. | Lofall | 76 | 7,750(0.98%)#23 | 191,286(0.04%)#370 |
| 24. | Mead | 74 | 7,750(0.95%)#24 | 191,286(0.04%)#383 |
| 25. | East Port Orchard | 69 | 7,750(0.89%)#25 | 191,286(0.04%)#403 |
| 26. | Five Corners | 65 | 7,750(0.84%)#26 | 191,286(0.03%)#429 |
| 27. | Port Angeles | 65 | 7,750(0.84%)#27 | 191,286(0.03%)#430 |
| 28. | Seatac | 57 | 7,750(0.74%)#28 | 191,286(0.03%)#479 |
| 29. | Yakima | 56 | 7,750(0.72%)#29 | 191,286(0.03%)#484 |
| 30. | Mukilteo | 55 | 7,750(0.71%)#30 | 191,286(0.03%)#498 |
| 31. | West Richland | 55 | 7,750(0.71%)#31 | 191,286(0.03%)#499 |
| 32. | Minnehaha | 55 | 7,750(0.71%)#32 | 191,286(0.03%)#500 |
| 33. | Fircrest | 53 | 7,750(0.68%)#33 | 191,286(0.03%)#515 |
| 34. | Kirkland | 51 | 7,750(0.66%)#34 | 191,286(0.03%)#528 |
| 35. | Parkland | 49 | 7,750(0.63%)#35 | 191,286(0.03%)#543 |
| 36. | Eatonville | 49 | 7,750(0.63%)#36 | 191,286(0.03%)#550 |
| 37. | Bryant | 49 | 7,750(0.63%)#37 | 191,286(0.03%)#551 |
| 38. | Longview | 48 | 7,750(0.62%)#38 | 191,286(0.03%)#557 |
| 39. | East Wenatchee | 48 | 7,750(0.62%)#39 | 191,286(0.03%)#559 |
| 40. | Covington | 47 | 7,750(0.61%)#40 | 191,286(0.02%)#565 |
| 41. | Toppenish | 44 | 7,750(0.57%)#41 | 191,286(0.02%)#601 |
| 42. | Clover Creek | 43 | 7,750(0.55%)#42 | 191,286(0.02%)#614 |
| 43. | Fife | 41 | 7,750(0.53%)#43 | 191,286(0.02%)#636 |
| 44. | Edmonds | 40 | 7,750(0.52%)#44 | 191,286(0.02%)#643 |
| 45. | Lacey | 38 | 7,750(0.49%)#45 | 191,286(0.02%)#664 |
| 46. | Southworth | 36 | 7,750(0.46%)#46 | 191,286(0.02%)#703 |
| 47. | Everett | 34 | 7,750(0.44%)#47 | 191,286(0.02%)#729 |
| 48. | Rosalia | 34 | 7,750(0.44%)#48 | 191,286(0.02%)#748 |
| 49. | Maple Valley | 32 | 7,750(0.41%)#49 | 191,286(0.02%)#777 |
| 50. | Sudden Valley | 32 | 7,750(0.41%)#50 | 191,286(0.02%)#782 |
| 51. | Clarkston | 30 | 7,750(0.39%)#51 | 191,286(0.02%)#820 |
| 52. | Esperance | 30 | 7,750(0.39%)#52 | 191,286(0.02%)#823 |
| 53. | Kelso | 28 | 7,750(0.36%)#53 | 191,286(0.01%)#855 |
| 54. | Woods Creek | 28 | 7,750(0.36%)#54 | 191,286(0.01%)#857 |
| 55. | Battle Ground | 27 | 7,750(0.35%)#55 | 191,286(0.01%)#873 |
| 56. | Bellevue | 26 | 7,750(0.34%)#56 | 191,286(0.01%)#885 |
| 57. | Eastmont | 26 | 7,750(0.34%)#57 | 191,286(0.01%)#892 |
| 58. | Prairie Ridge | 26 | 7,750(0.34%)#58 | 191,286(0.01%)#897 |
| 59. | Shelton | 26 | 7,750(0.34%)#59 | 191,286(0.01%)#899 |
| 60. | Elma | 25 | 7,750(0.32%)#60 | 191,286(0.01%)#937 |
| 61. | Pasco | 23 | 7,750(0.30%)#61 | 191,286(0.01%)#969 |
| 62. | Lynden | 23 | 7,750(0.30%)#62 | 191,286(0.01%)#975 |
| 63. | Tieton | 23 | 7,750(0.30%)#63 | 191,286(0.01%)#988 |
| 64. | Prairie Heights | 22 | 7,750(0.28%)#64 | 191,286(0.01%)#1,010 |
| 65. | Tukwila | 21 | 7,750(0.27%)#65 | 191,286(0.01%)#1,032 |
| 66. | Marysville | 20 | 7,750(0.26%)#66 | 191,286(0.01%)#1,056 |
| 67. | Oak Harbor | 20 | 7,750(0.26%)#67 | 191,286(0.01%)#1,061 |
| 68. | Garrett | 20 | 7,750(0.26%)#68 | 191,286(0.01%)#1,075 |
| 69. | Redmond | 19 | 7,750(0.25%)#69 | 191,286(0.01%)#1,087 |
| 70. | North Yelm | 19 | 7,750(0.25%)#70 | 191,286(0.01%)#1,121 |
| 71. | Napavine | 19 | 7,750(0.25%)#71 | 191,286(0.01%)#1,129 |
| 72. | Wapato | 18 | 7,750(0.23%)#72 | 191,286(0.01%)#1,161 |
| 73. | University Place | 17 | 7,750(0.22%)#73 | 191,286(0.01%)#1,190 |
| 74. | Bellingham | 16 | 7,750(0.21%)#74 | 191,286(0.01%)#1,227 |
| 75. | Richland | 16 | 7,750(0.21%)#75 | 191,286(0.01%)#1,232 |
| 76. | South Bend | 16 | 7,750(0.21%)#76 | 191,286(0.01%)#1,268 |
| 77. | Mount Vista | 15 | 7,750(0.19%)#77 | 191,286(0.01%)#1,303 |
| 78. | Spanaway | 14 | 7,750(0.18%)#78 | 191,286(0.01%)#1,340 |
| 79. | Lake Stevens | 13 | 7,750(0.17%)#79 | 191,286(0.01%)#1,394 |
| 80. | Rosedale | 13 | 7,750(0.17%)#80 | 191,286(0.01%)#1,416 |
| 81. | Brinnon | 13 | 7,750(0.17%)#81 | 191,286(0.01%)#1,428 |
| 82. | Elk Plain | 12 | 7,750(0.15%)#82 | 191,286(0.01%)#1,466 |
| 83. | Normandy Park | 12 | 7,750(0.15%)#83 | 191,286(0.01%)#1,477 |
| 84. | Hamilton | 12 | 7,750(0.15%)#84 | 191,286(0.01%)#1,505 |
| 85. | Mount Vernon | 11 | 7,750(0.14%)#85 | 191,286(0.01%)#1,527 |
| 86. | Moses Lake | 11 | 7,750(0.14%)#86 | 191,286(0.01%)#1,529 |
| 87. | Kenmore | 11 | 7,750(0.14%)#87 | 191,286(0.01%)#1,532 |
| 88. | Union Hill Novelty Hill | 11 | 7,750(0.14%)#88 | 191,286(0.01%)#1,533 |
| 89. | Ellensburg | 11 | 7,750(0.14%)#89 | 191,286(0.01%)#1,537 |
| 90. | Fairwood Cdp King County | 11 | 7,750(0.14%)#90 | 191,286(0.01%)#1,539 |
| 91. | Des Moines | 10 | 7,750(0.13%)#91 | 191,286(0.01%)#1,609 |
| 92. | Orchards | 10 | 7,750(0.13%)#92 | 191,286(0.01%)#1,612 |
| 93. | White Center | 10 | 7,750(0.13%)#93 | 191,286(0.01%)#1,622 |
| 94. | Boulevard Park | 10 | 7,750(0.13%)#94 | 191,286(0.01%)#1,647 |
| 95. | Geneva | 10 | 7,750(0.13%)#95 | 191,286(0.01%)#1,664 |
| 96. | Silverdale | 9 | 7,750(0.12%)#96 | 191,286(0.00%)#1,717 |
| 97. | Artondale | 9 | 7,750(0.12%)#97 | 191,286(0.00%)#1,726 |
| 98. | Fort Lewis | 8 | 7,750(0.10%)#98 | 191,286(0.00%)#1,813 |
| 99. | Burlington | 8 | 7,750(0.10%)#99 | 191,286(0.00%)#1,820 |
| 100. | Medina | 8 | 7,750(0.10%)#100 | 191,286(0.00%)#1,841 |
Common Questions
What are the Top 10 Cities with the Largest Chippewa Community in Washington?
Top 10 Cities with the Largest Chippewa Community in Washington are:
#1
527
#2
523
#3
362
#4
342
#5
195
#6
156
#7
155
#8
155
#9
146
#10
137
What city has the Largest Chippewa Community in Washington?
Seattle has the Largest Chippewa Community in Washington with 527.
What is the Total Chippewa Population in the State of Washington?
Total Chippewa Population in Washington is 7,750.
What is the Total Chippewa Population in the United States?
Total Chippewa Population in the United States is 191,286.