Cities with the Highest Percentage of Immigrants from Southern Europe in Washington
RELATED REPORTS & OPTIONS
Southern Europe
Washington
Compare Cities
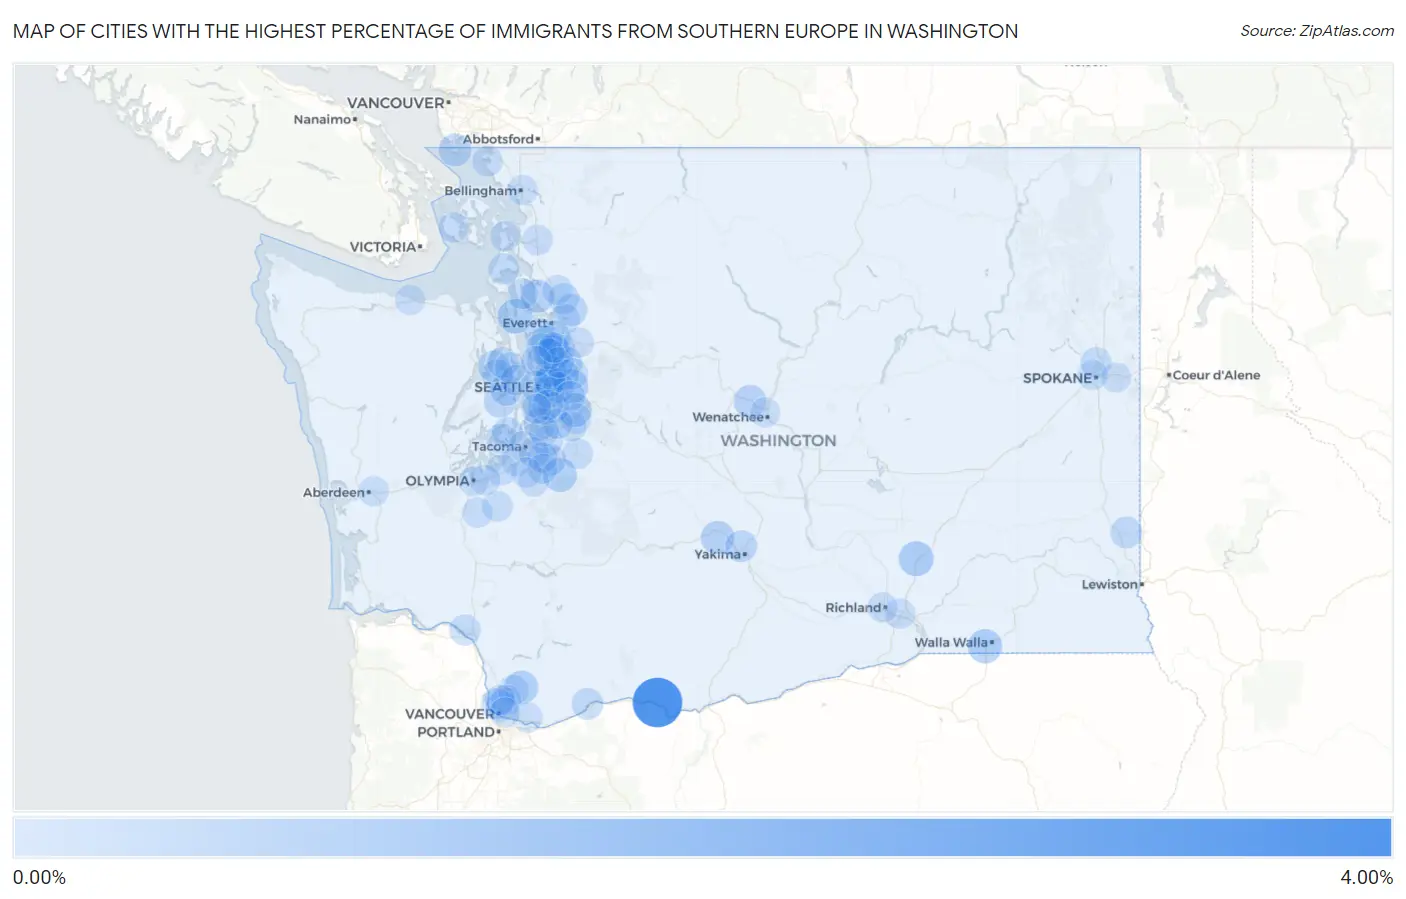
Map of Cities with the Highest Percentage of Immigrants from Southern Europe in Washington
0.00%
4.00%
Cities with the Highest Percentage of Immigrants from Southern Europe in Washington
| City | Southern Europe | vs State | vs National | |
| 1. | Lyle | 3.54% | 0.082%(+3.46)#1 | 0.22%(+3.32)#108 |
| 2. | Mesa | 0.84% | 0.082%(+0.755)#2 | 0.22%(+0.617)#949 |
| 3. | Freeland | 0.79% | 0.082%(+0.710)#3 | 0.22%(+0.572)#1,018 |
| 4. | College Place | 0.75% | 0.082%(+0.663)#4 | 0.22%(+0.525)#1,075 |
| 5. | Bothell East | 0.70% | 0.082%(+0.613)#5 | 0.22%(+0.475)#1,192 |
| 6. | Sammamish | 0.70% | 0.082%(+0.613)#6 | 0.22%(+0.475)#1,193 |
| 7. | Roche Harbor | 0.66% | 0.082%(+0.582)#7 | 0.22%(+0.444)#1,266 |
| 8. | Crocker | 0.66% | 0.082%(+0.574)#8 | 0.22%(+0.437)#1,288 |
| 9. | Venersborg | 0.64% | 0.082%(+0.559)#9 | 0.22%(+0.421)#1,320 |
| 10. | Mirrormont | 0.63% | 0.082%(+0.552)#10 | 0.22%(+0.414)#1,338 |
| 11. | Tieton | 0.58% | 0.082%(+0.500)#11 | 0.22%(+0.362)#1,455 |
| 12. | Kayak Point | 0.54% | 0.082%(+0.460)#12 | 0.22%(+0.322)#1,566 |
| 13. | Point Roberts | 0.48% | 0.082%(+0.398)#13 | 0.22%(+0.260)#1,743 |
| 14. | Cashmere | 0.46% | 0.082%(+0.380)#14 | 0.22%(+0.242)#1,796 |
| 15. | Port Orchard | 0.44% | 0.082%(+0.354)#15 | 0.22%(+0.216)#1,885 |
| 16. | Des Moines | 0.43% | 0.082%(+0.349)#16 | 0.22%(+0.212)#1,903 |
| 17. | Clearview | 0.43% | 0.082%(+0.343)#17 | 0.22%(+0.205)#1,929 |
| 18. | Lochsloy | 0.37% | 0.082%(+0.291)#18 | 0.22%(+0.153)#2,134 |
| 19. | Cottage Lake | 0.34% | 0.082%(+0.253)#19 | 0.22%(+0.116)#2,314 |
| 20. | Alderton | 0.34% | 0.082%(+0.253)#20 | 0.22%(+0.115)#2,316 |
| 21. | Selah | 0.33% | 0.082%(+0.247)#21 | 0.22%(+0.109)#2,351 |
| 22. | Pullman | 0.32% | 0.082%(+0.240)#22 | 0.22%(+0.102)#2,390 |
| 23. | Enetai | 0.32% | 0.082%(+0.239)#23 | 0.22%(+0.101)#2,392 |
| 24. | Yarrow Point | 0.31% | 0.082%(+0.230)#24 | 0.22%(+0.092)#2,432 |
| 25. | Silverdale | 0.31% | 0.082%(+0.225)#25 | 0.22%(+0.088)#2,458 |
| 26. | Stevenson | 0.29% | 0.082%(+0.212)#26 | 0.22%(+0.075)#2,521 |
| 27. | Tukwila | 0.29% | 0.082%(+0.210)#27 | 0.22%(+0.072)#2,538 |
| 28. | Eastmont | 0.26% | 0.082%(+0.181)#28 | 0.22%(+0.043)#2,725 |
| 29. | Union Hill Novelty Hill | 0.26% | 0.082%(+0.181)#29 | 0.22%(+0.043)#2,726 |
| 30. | Lake Forest Park | 0.26% | 0.082%(+0.178)#30 | 0.22%(+0.040)#2,751 |
| 31. | Mukilteo | 0.25% | 0.082%(+0.170)#31 | 0.22%(+0.033)#2,806 |
| 32. | Bangor Base | 0.25% | 0.082%(+0.166)#32 | 0.22%(+0.028)#2,833 |
| 33. | Sisco Heights | 0.24% | 0.082%(+0.153)#33 | 0.22%(+0.015)#2,915 |
| 34. | Lake Stickney | 0.23% | 0.082%(+0.149)#34 | 0.22%(+0.012)#2,949 |
| 35. | Longview | 0.22% | 0.082%(+0.140)#35 | 0.22%(+0.003)#3,009 |
| 36. | Mercer Island | 0.21% | 0.082%(+0.130)#36 | 0.22%(-0.008)#3,081 |
| 37. | Medina | 0.21% | 0.082%(+0.123)#37 | 0.22%(-0.015)#3,147 |
| 38. | Hazel Dell | 0.20% | 0.082%(+0.120)#38 | 0.22%(-0.018)#3,172 |
| 39. | Gig Harbor | 0.20% | 0.082%(+0.119)#39 | 0.22%(-0.019)#3,180 |
| 40. | Kirkland | 0.19% | 0.082%(+0.109)#40 | 0.22%(-0.029)#3,271 |
| 41. | Redmond | 0.19% | 0.082%(+0.109)#41 | 0.22%(-0.029)#3,272 |
| 42. | Dupont | 0.19% | 0.082%(+0.109)#42 | 0.22%(-0.029)#3,276 |
| 43. | Bellevue | 0.19% | 0.082%(+0.108)#43 | 0.22%(-0.029)#3,280 |
| 44. | Lynnwood | 0.19% | 0.082%(+0.106)#44 | 0.22%(-0.032)#3,298 |
| 45. | Seattle | 0.19% | 0.082%(+0.104)#45 | 0.22%(-0.033)#3,310 |
| 46. | Oak Harbor | 0.18% | 0.082%(+0.102)#46 | 0.22%(-0.036)#3,337 |
| 47. | Country Homes | 0.18% | 0.082%(+0.094)#47 | 0.22%(-0.044)#3,414 |
| 48. | Clyde Hill | 0.16% | 0.082%(+0.079)#48 | 0.22%(-0.059)#3,542 |
| 49. | Algona | 0.15% | 0.082%(+0.071)#49 | 0.22%(-0.067)#3,607 |
| 50. | Camano | 0.15% | 0.082%(+0.071)#50 | 0.22%(-0.067)#3,610 |
| 51. | Poulsbo | 0.15% | 0.082%(+0.070)#51 | 0.22%(-0.068)#3,616 |
| 52. | Bainbridge Island | 0.15% | 0.082%(+0.068)#52 | 0.22%(-0.070)#3,632 |
| 53. | Elk Plain | 0.14% | 0.082%(+0.058)#53 | 0.22%(-0.079)#3,726 |
| 54. | Hobart | 0.14% | 0.082%(+0.057)#54 | 0.22%(-0.080)#3,740 |
| 55. | Suquamish | 0.14% | 0.082%(+0.056)#55 | 0.22%(-0.081)#3,748 |
| 56. | Lake Shore | 0.14% | 0.082%(+0.054)#56 | 0.22%(-0.083)#3,769 |
| 57. | Bothell West | 0.14% | 0.082%(+0.054)#57 | 0.22%(-0.084)#3,772 |
| 58. | Enumclaw | 0.13% | 0.082%(+0.052)#58 | 0.22%(-0.085)#3,800 |
| 59. | Renton | 0.13% | 0.082%(+0.051)#59 | 0.22%(-0.087)#3,816 |
| 60. | White Center | 0.13% | 0.082%(+0.047)#60 | 0.22%(-0.091)#3,859 |
| 61. | Artondale | 0.12% | 0.082%(+0.040)#61 | 0.22%(-0.097)#3,930 |
| 62. | Woodinville | 0.12% | 0.082%(+0.038)#62 | 0.22%(-0.100)#3,960 |
| 63. | Shoreline | 0.12% | 0.082%(+0.037)#63 | 0.22%(-0.101)#3,978 |
| 64. | Maple Valley | 0.11% | 0.082%(+0.032)#64 | 0.22%(-0.105)#4,036 |
| 65. | Rainier | 0.11% | 0.082%(+0.029)#65 | 0.22%(-0.109)#4,076 |
| 66. | Lacey | 0.11% | 0.082%(+0.028)#66 | 0.22%(-0.110)#4,083 |
| 67. | Burlington | 0.11% | 0.082%(+0.025)#67 | 0.22%(-0.113)#4,109 |
| 68. | Battle Ground | 0.10% | 0.082%(+0.018)#68 | 0.22%(-0.120)#4,182 |
| 69. | Tenino | 0.098% | 0.082%(+0.015)#69 | 0.22%(-0.122)#4,218 |
| 70. | Issaquah | 0.091% | 0.082%(+0.009)#70 | 0.22%(-0.129)#4,303 |
| 71. | Kent | 0.090% | 0.082%(+0.008)#71 | 0.22%(-0.130)#4,318 |
| 72. | Birch Bay | 0.090% | 0.082%(+0.007)#72 | 0.22%(-0.130)#4,319 |
| 73. | Barberton | 0.088% | 0.082%(+0.006)#73 | 0.22%(-0.132)#4,340 |
| 74. | Pasco | 0.084% | 0.082%(+0.002)#74 | 0.22%(-0.136)#4,387 |
| 75. | Tacoma | 0.083% | 0.082%(+0.001)#75 | 0.22%(-0.137)#4,402 |
| 76. | Mill Creek East | 0.083% | 0.082%(+0.001)#76 | 0.22%(-0.137)#4,404 |
| 77. | Lakewood | 0.082% | 0.082%(+0.000)#77 | 0.22%(-0.138)#4,413 |
| 78. | Bryn Mawr Skyway | 0.078% | 0.082%(-0.005)#78 | 0.22%(-0.142)#4,467 |
| 79. | Aberdeen | 0.077% | 0.082%(-0.006)#79 | 0.22%(-0.143)#4,486 |
| 80. | Friday Harbor | 0.076% | 0.082%(-0.007)#80 | 0.22%(-0.144)#4,498 |
| 81. | Waller | 0.075% | 0.082%(-0.007)#81 | 0.22%(-0.145)#4,504 |
| 82. | Lakeland North | 0.074% | 0.082%(-0.009)#82 | 0.22%(-0.147)#4,525 |
| 83. | Puyallup | 0.073% | 0.082%(-0.010)#83 | 0.22%(-0.147)#4,536 |
| 84. | Spokane | 0.072% | 0.082%(-0.011)#84 | 0.22%(-0.149)#4,556 |
| 85. | Spanaway | 0.068% | 0.082%(-0.015)#85 | 0.22%(-0.152)#4,595 |
| 86. | Lake Stevens | 0.064% | 0.082%(-0.018)#86 | 0.22%(-0.156)#4,629 |
| 87. | Camas | 0.061% | 0.082%(-0.022)#87 | 0.22%(-0.159)#4,675 |
| 88. | Port Angeles | 0.060% | 0.082%(-0.022)#88 | 0.22%(-0.160)#4,683 |
| 89. | Salmon Creek | 0.059% | 0.082%(-0.023)#89 | 0.22%(-0.161)#4,692 |
| 90. | South Hill | 0.055% | 0.082%(-0.028)#90 | 0.22%(-0.166)#4,750 |
| 91. | Richland | 0.054% | 0.082%(-0.028)#91 | 0.22%(-0.166)#4,755 |
| 92. | Olympia | 0.053% | 0.082%(-0.030)#92 | 0.22%(-0.167)#4,769 |
| 93. | Monroe | 0.051% | 0.082%(-0.031)#93 | 0.22%(-0.169)#4,791 |
| 94. | Vancouver | 0.051% | 0.082%(-0.031)#94 | 0.22%(-0.169)#4,792 |
| 95. | Bellingham | 0.049% | 0.082%(-0.033)#95 | 0.22%(-0.171)#4,811 |
| 96. | Anacortes | 0.045% | 0.082%(-0.037)#96 | 0.22%(-0.175)#4,862 |
| 97. | Arlington | 0.044% | 0.082%(-0.038)#97 | 0.22%(-0.176)#4,868 |
| 98. | Wenatchee | 0.042% | 0.082%(-0.040)#98 | 0.22%(-0.178)#4,896 |
| 99. | Burien | 0.039% | 0.082%(-0.043)#99 | 0.22%(-0.181)#4,933 |
| 100. | Spokane Valley | 0.039% | 0.082%(-0.044)#100 | 0.22%(-0.182)#4,935 |
Common Questions
What are the Top 10 Cities with the Highest Percentage of Immigrants from Southern Europe in Washington?
Top 10 Cities with the Highest Percentage of Immigrants from Southern Europe in Washington are:
#1
3.54%
#2
0.84%
#3
0.79%
#4
0.75%
#5
0.70%
#6
0.70%
#7
0.66%
#8
0.64%
#9
0.63%
#10
0.58%
What city has the Highest Percentage of Immigrants from Southern Europe in Washington?
Lyle has the Highest Percentage of Immigrants from Southern Europe in Washington with 3.54%.
What is the Percentage of Immigrants from Southern Europe in the State of Washington?
Percentage of Immigrants from Southern Europe in Washington is 0.082%.
What is the Percentage of Immigrants from Southern Europe in the United States?
Percentage of Immigrants from Southern Europe in the United States is 0.22%.