Cities with the Highest Percentage of Population Carpooling to Work in Washington
RELATED REPORTS & OPTIONS
Drive | Carpool
Washington
Compare Cities
Map of Cities with the Highest Percentage of Population Carpooling to Work in Washington
0.0%
80.0%
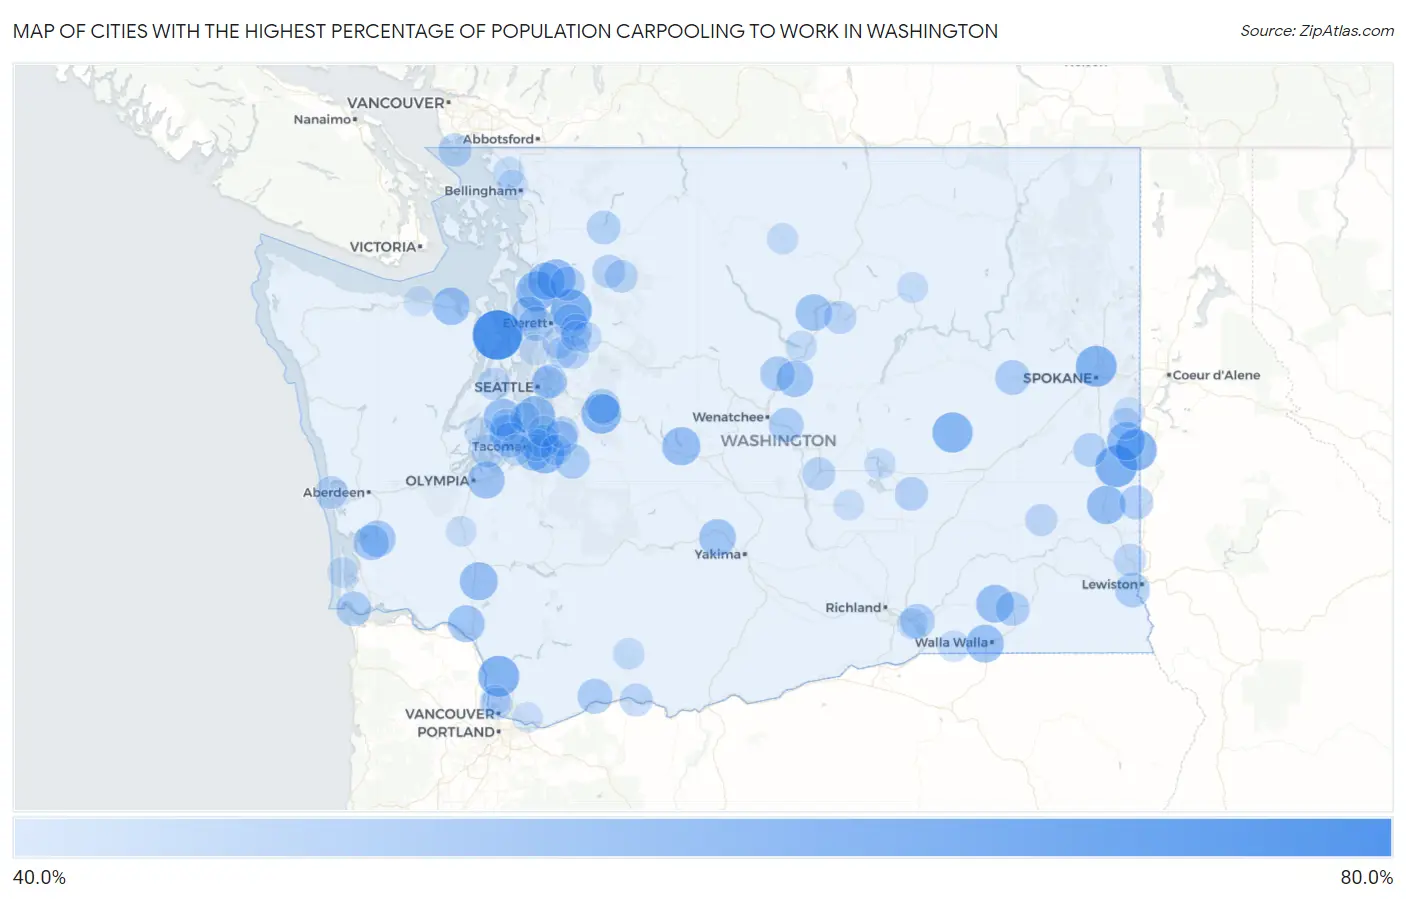
Cities with the Highest Percentage of Population Carpooling to Work in Washington
| City | % Carpool | vs State | vs National | |
| 1. | Port Ludlow | 73.1% | 37.6%(+35.5)#1 | 38.2%(+34.9)#34 |
| 2. | Oakesdale | 61.3% | 37.6%(+23.7)#2 | 38.2%(+23.1)#385 |
| 3. | Lochsloy | 60.5% | 37.6%(+22.9)#3 | 38.2%(+22.3)#453 |
| 4. | Tekoa | 60.3% | 37.6%(+22.7)#4 | 38.2%(+22.1)#494 |
| 5. | La Center | 60.2% | 37.6%(+22.6)#5 | 38.2%(+22.0)#506 |
| 6. | Town And Country | 60.1% | 37.6%(+22.5)#6 | 38.2%(+21.9)#522 |
| 7. | Odessa | 59.1% | 37.6%(+21.5)#7 | 38.2%(+20.9)#665 |
| 8. | Normandy Park | 59.0% | 37.6%(+21.4)#8 | 38.2%(+20.8)#669 |
| 9. | Wilderness Rim | 58.5% | 37.6%(+20.9)#9 | 38.2%(+20.3)#713 |
| 10. | Warm Beach | 58.4% | 37.6%(+20.8)#10 | 38.2%(+20.2)#733 |
| 11. | North Puyallup | 57.7% | 37.6%(+20.1)#11 | 38.2%(+19.5)#847 |
| 12. | Bryant | 56.8% | 37.6%(+19.2)#12 | 38.2%(+18.6)#984 |
| 13. | Colfax | 56.5% | 37.6%(+18.9)#13 | 38.2%(+18.3)#1,020 |
| 14. | Roche Harbor | 56.4% | 37.6%(+18.8)#14 | 38.2%(+18.2)#1,059 |
| 15. | Latah | 56.3% | 37.6%(+18.7)#15 | 38.2%(+18.1)#1,093 |
| 16. | Roslyn | 56.1% | 37.6%(+18.5)#16 | 38.2%(+17.9)#1,138 |
| 17. | Toledo | 55.8% | 37.6%(+18.2)#17 | 38.2%(+17.6)#1,195 |
| 18. | Garrett | 55.5% | 37.6%(+17.9)#18 | 38.2%(+17.3)#1,233 |
| 19. | Prescott | 55.5% | 37.6%(+17.9)#19 | 38.2%(+17.3)#1,252 |
| 20. | Burley | 55.4% | 37.6%(+17.8)#20 | 38.2%(+17.2)#1,269 |
| 21. | Sequim | 55.1% | 37.6%(+17.5)#21 | 38.2%(+16.9)#1,329 |
| 22. | Sunday Lake | 54.8% | 37.6%(+17.2)#22 | 38.2%(+16.6)#1,401 |
| 23. | Tanglewilde | 54.4% | 37.6%(+16.8)#23 | 38.2%(+16.2)#1,482 |
| 24. | Longview Heights | 54.2% | 37.6%(+16.6)#24 | 38.2%(+16.0)#1,548 |
| 25. | Tieton | 54.1% | 37.6%(+16.5)#25 | 38.2%(+15.9)#1,579 |
| 26. | Pateros | 53.7% | 37.6%(+16.1)#26 | 38.2%(+15.5)#1,652 |
| 27. | Waterville | 53.6% | 37.6%(+16.0)#27 | 38.2%(+15.4)#1,672 |
| 28. | Waller | 53.3% | 37.6%(+15.7)#28 | 38.2%(+15.1)#1,754 |
| 29. | Raymond | 53.3% | 37.6%(+15.7)#29 | 38.2%(+15.1)#1,761 |
| 30. | Gig Harbor | 53.2% | 37.6%(+15.6)#30 | 38.2%(+15.0)#1,787 |
| 31. | Lake Holm | 52.1% | 37.6%(+14.5)#31 | 38.2%(+13.9)#2,061 |
| 32. | South Bend | 52.1% | 37.6%(+14.5)#32 | 38.2%(+13.9)#2,068 |
| 33. | Carson | 51.4% | 37.6%(+13.8)#33 | 38.2%(+13.2)#2,270 |
| 34. | Buckley | 51.2% | 37.6%(+13.6)#34 | 38.2%(+13.0)#2,340 |
| 35. | Clarkston Heights Vineland | 51.1% | 37.6%(+13.5)#35 | 38.2%(+12.9)#2,370 |
| 36. | Davenport | 51.1% | 37.6%(+13.5)#36 | 38.2%(+12.9)#2,390 |
| 37. | North Bend | 51.0% | 37.6%(+13.4)#37 | 38.2%(+12.8)#2,409 |
| 38. | Rock Island | 51.0% | 37.6%(+13.4)#38 | 38.2%(+12.8)#2,419 |
| 39. | Langley | 51.0% | 37.6%(+13.4)#39 | 38.2%(+12.8)#2,424 |
| 40. | Entiat | 51.0% | 37.6%(+13.4)#40 | 38.2%(+12.8)#2,425 |
| 41. | Chinook | 51.0% | 37.6%(+13.4)#41 | 38.2%(+12.8)#2,435 |
| 42. | Wollochet | 50.9% | 37.6%(+13.3)#42 | 38.2%(+12.7)#2,448 |
| 43. | Clinton | 50.9% | 37.6%(+13.3)#43 | 38.2%(+12.7)#2,456 |
| 44. | Burbank | 50.8% | 37.6%(+13.2)#44 | 38.2%(+12.6)#2,475 |
| 45. | Arlington Heights | 50.4% | 37.6%(+12.8)#45 | 38.2%(+12.2)#2,634 |
| 46. | Waitsburg | 50.3% | 37.6%(+12.7)#46 | 38.2%(+12.1)#2,693 |
| 47. | Machias | 50.1% | 37.6%(+12.5)#47 | 38.2%(+11.9)#2,776 |
| 48. | Palouse | 50.0% | 37.6%(+12.4)#48 | 38.2%(+11.8)#2,809 |
| 49. | Malden | 49.7% | 37.6%(+12.1)#49 | 38.2%(+11.5)#2,894 |
| 50. | Clyde Hill | 49.6% | 37.6%(+12.0)#50 | 38.2%(+11.4)#2,906 |
| 51. | Concrete | 49.6% | 37.6%(+12.0)#51 | 38.2%(+11.4)#2,921 |
| 52. | Warden | 49.5% | 37.6%(+11.9)#52 | 38.2%(+11.3)#2,943 |
| 53. | Point Roberts | 49.1% | 37.6%(+11.5)#53 | 38.2%(+10.9)#3,157 |
| 54. | Lakeland South | 48.9% | 37.6%(+11.3)#54 | 38.2%(+10.7)#3,210 |
| 55. | Swede Heaven | 48.8% | 37.6%(+11.2)#55 | 38.2%(+10.6)#3,266 |
| 56. | George | 48.8% | 37.6%(+11.2)#56 | 38.2%(+10.6)#3,269 |
| 57. | High Bridge | 48.6% | 37.6%(+11.0)#57 | 38.2%(+10.4)#3,334 |
| 58. | Medina | 48.5% | 37.6%(+10.9)#58 | 38.2%(+10.3)#3,364 |
| 59. | Bingen | 48.5% | 37.6%(+10.9)#59 | 38.2%(+10.3)#3,390 |
| 60. | Darrington | 48.4% | 37.6%(+10.8)#60 | 38.2%(+10.2)#3,442 |
| 61. | Bridgeport | 48.3% | 37.6%(+10.7)#61 | 38.2%(+10.1)#3,477 |
| 62. | Ocean Shores | 48.1% | 37.6%(+10.5)#62 | 38.2%(+9.90)#3,558 |
| 63. | Longbranch | 48.0% | 37.6%(+10.4)#63 | 38.2%(+9.80)#3,610 |
| 64. | Fife Heights | 47.8% | 37.6%(+10.2)#64 | 38.2%(+9.60)#3,690 |
| 65. | Colton | 47.7% | 37.6%(+10.1)#65 | 38.2%(+9.50)#3,742 |
| 66. | Chico | 47.5% | 37.6%(+9.90)#66 | 38.2%(+9.30)#3,811 |
| 67. | Lacrosse | 47.5% | 37.6%(+9.90)#67 | 38.2%(+9.30)#3,860 |
| 68. | Silver Firs | 47.4% | 37.6%(+9.80)#68 | 38.2%(+9.20)#3,884 |
| 69. | Three Lakes | 47.3% | 37.6%(+9.70)#69 | 38.2%(+9.10)#3,953 |
| 70. | Kitsap Lake | 47.3% | 37.6%(+9.70)#70 | 38.2%(+9.10)#3,962 |
| 71. | Fairfield | 47.3% | 37.6%(+9.70)#71 | 38.2%(+9.10)#3,983 |
| 72. | Lake Morton Berrydale | 47.2% | 37.6%(+9.60)#72 | 38.2%(+9.00)#4,008 |
| 73. | Lake Shore | 47.2% | 37.6%(+9.60)#73 | 38.2%(+9.00)#4,013 |
| 74. | Maltby | 47.0% | 37.6%(+9.40)#74 | 38.2%(+8.80)#4,108 |
| 75. | Canterwood | 46.8% | 37.6%(+9.20)#75 | 38.2%(+8.60)#4,197 |
| 76. | Trout Lake | 46.6% | 37.6%(+9.00)#76 | 38.2%(+8.40)#4,281 |
| 77. | Touchet | 46.5% | 37.6%(+8.90)#77 | 38.2%(+8.30)#4,342 |
| 78. | Lakeland North | 46.3% | 37.6%(+8.70)#78 | 38.2%(+8.10)#4,408 |
| 79. | Fircrest | 46.3% | 37.6%(+8.70)#79 | 38.2%(+8.10)#4,418 |
| 80. | Winthrop | 46.3% | 37.6%(+8.70)#80 | 38.2%(+8.10)#4,459 |
| 81. | Chelan | 46.2% | 37.6%(+8.60)#81 | 38.2%(+8.00)#4,481 |
| 82. | Ferndale | 46.1% | 37.6%(+8.50)#82 | 38.2%(+7.90)#4,519 |
| 83. | Riverbend | 46.1% | 37.6%(+8.50)#83 | 38.2%(+7.90)#4,547 |
| 84. | Finley | 46.0% | 37.6%(+8.40)#84 | 38.2%(+7.80)#4,587 |
| 85. | Grapeview | 46.0% | 37.6%(+8.40)#85 | 38.2%(+7.80)#4,607 |
| 86. | Nespelem Community | 45.9% | 37.6%(+8.30)#86 | 38.2%(+7.70)#4,661 |
| 87. | Lake Tapps | 45.8% | 37.6%(+8.20)#87 | 38.2%(+7.60)#4,667 |
| 88. | Cascade Valley | 45.8% | 37.6%(+8.20)#88 | 38.2%(+7.60)#4,675 |
| 89. | Woods Creek | 45.7% | 37.6%(+8.10)#89 | 38.2%(+7.50)#4,720 |
| 90. | Fords Prairie | 45.5% | 37.6%(+7.90)#90 | 38.2%(+7.30)#4,824 |
| 91. | Rockford | 45.5% | 37.6%(+7.90)#91 | 38.2%(+7.30)#4,871 |
| 92. | Chain Lake | 45.4% | 37.6%(+7.80)#92 | 38.2%(+7.20)#4,927 |
| 93. | Ocean Park | 45.4% | 37.6%(+7.80)#93 | 38.2%(+7.20)#4,938 |
| 94. | Marietta Alderwood | 45.3% | 37.6%(+7.70)#94 | 38.2%(+7.10)#4,984 |
| 95. | Royal City | 45.3% | 37.6%(+7.70)#95 | 38.2%(+7.10)#4,992 |
| 96. | Edmonds | 45.1% | 37.6%(+7.50)#96 | 38.2%(+6.90)#5,088 |
| 97. | Camas | 45.1% | 37.6%(+7.50)#97 | 38.2%(+6.90)#5,091 |
| 98. | Felida | 45.1% | 37.6%(+7.50)#98 | 38.2%(+6.90)#5,097 |
| 99. | Port Angeles East | 44.7% | 37.6%(+7.10)#99 | 38.2%(+6.50)#5,296 |
| 100. | Vashon | 44.5% | 37.6%(+6.90)#100 | 38.2%(+6.30)#5,396 |
Common Questions
What are the Top 10 Cities with the Highest Percentage of Population Carpooling to Work in Washington?
Top 10 Cities with the Highest Percentage of Population Carpooling to Work in Washington are:
#1
73.1%
#2
61.3%
#3
60.5%
#4
60.3%
#5
60.2%
#6
60.1%
#7
59.1%
#8
59.0%
#9
58.5%
#10
58.4%
What city has the Highest Percentage of Population Carpooling to Work in Washington?
Port Ludlow has the Highest Percentage of Population Carpooling to Work in Washington with 73.1%.
What is the Percentage of Population Carpooling to Work in the State of Washington?
Percentage of Population Carpooling to Work in Washington is 37.6%.
What is the Percentage of Population Carpooling to Work in the United States?
Percentage of Population Carpooling to Work in the United States is 38.2%.