Cities with the Highest Percentage of Samoan Population in Washington
RELATED REPORTS & OPTIONS
Samoan
Washington
Compare Cities
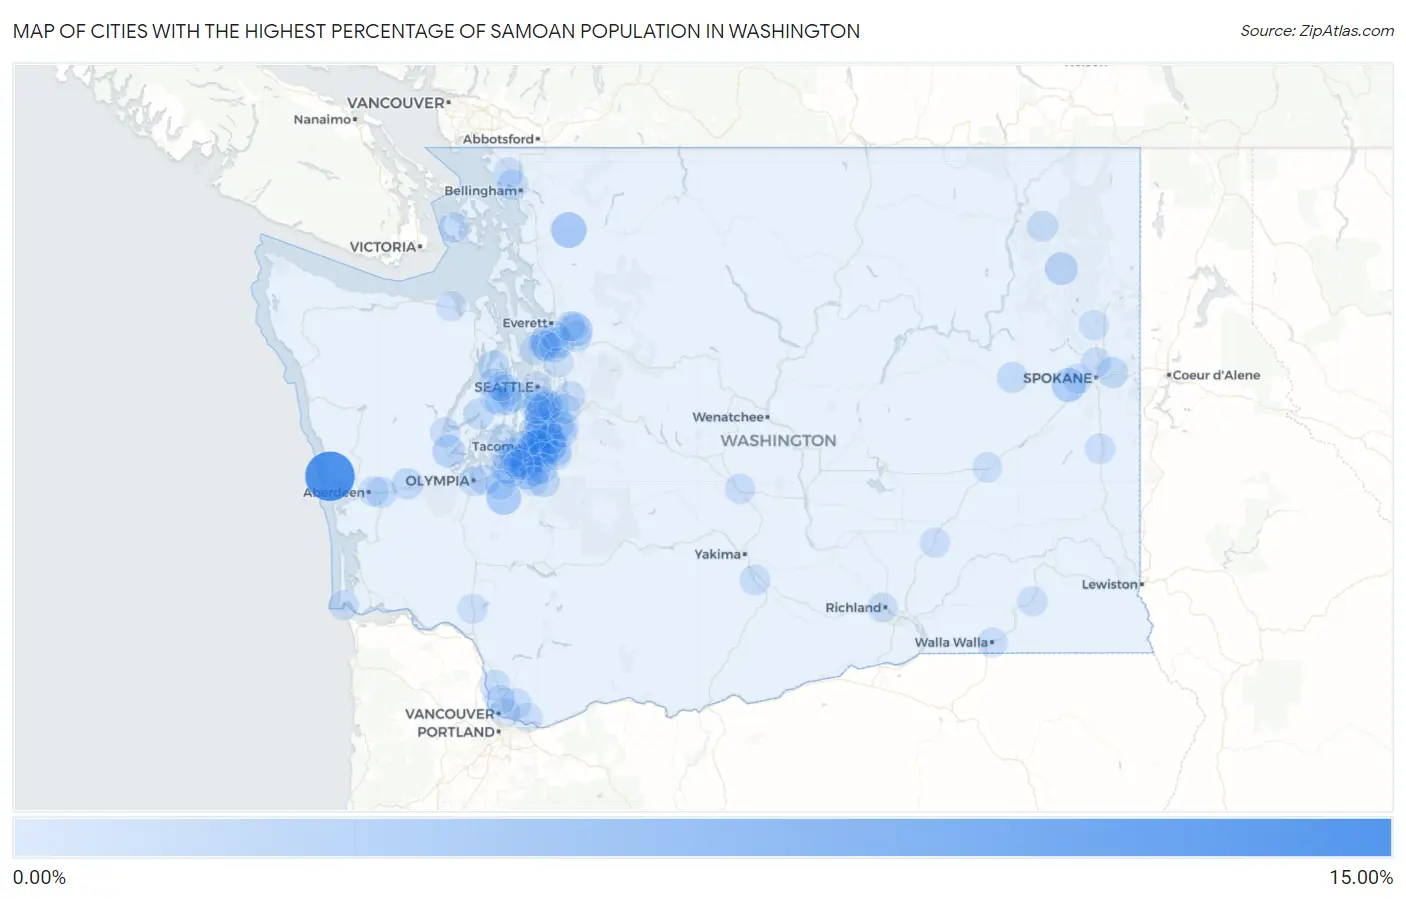
Map of Cities with the Highest Percentage of Samoan Population in Washington
0.00%
15.00%
Cities with the Highest Percentage of Samoan Population in Washington
| City | Samoan | vs State | vs National | |
| 1. | Ocean City | 14.95% | 0.33%(+14.6)#1 | 0.069%(+14.9)#5 |
| 2. | Beacon Hill | 6.60% | 0.33%(+6.27)#2 | 0.069%(+6.53)#31 |
| 3. | Pacific | 5.42% | 0.33%(+5.10)#3 | 0.069%(+5.36)#39 |
| 4. | Lyman | 4.15% | 0.33%(+3.82)#4 | 0.069%(+4.08)#64 |
| 5. | Fife | 4.07% | 0.33%(+3.74)#5 | 0.069%(+4.00)#65 |
| 6. | Lakeland North | 3.71% | 0.33%(+3.38)#6 | 0.069%(+3.64)#71 |
| 7. | Yelm | 3.57% | 0.33%(+3.25)#7 | 0.069%(+3.50)#74 |
| 8. | Fairchild Afb | 3.05% | 0.33%(+2.72)#8 | 0.069%(+2.98)#84 |
| 9. | Seatac | 2.68% | 0.33%(+2.36)#9 | 0.069%(+2.61)#99 |
| 10. | Spanaway | 2.62% | 0.33%(+2.29)#10 | 0.069%(+2.55)#102 |
| 11. | Midland | 2.61% | 0.33%(+2.28)#11 | 0.069%(+2.54)#103 |
| 12. | Tukwila | 2.45% | 0.33%(+2.13)#12 | 0.069%(+2.38)#110 |
| 13. | Edgewood | 2.36% | 0.33%(+2.04)#13 | 0.069%(+2.29)#112 |
| 14. | Parkland | 2.18% | 0.33%(+1.85)#14 | 0.069%(+2.11)#128 |
| 15. | Shelton | 2.16% | 0.33%(+1.83)#15 | 0.069%(+2.09)#130 |
| 16. | Chewelah | 2.15% | 0.33%(+1.83)#16 | 0.069%(+2.08)#131 |
| 17. | Three Lakes | 2.10% | 0.33%(+1.77)#17 | 0.069%(+2.03)#137 |
| 18. | North Fort Lewis | 1.86% | 0.33%(+1.53)#18 | 0.069%(+1.79)#152 |
| 19. | Lakeland South | 1.75% | 0.33%(+1.43)#19 | 0.069%(+1.68)#161 |
| 20. | Lake Stickney | 1.71% | 0.33%(+1.39)#20 | 0.069%(+1.64)#165 |
| 21. | Lakewood | 1.68% | 0.33%(+1.35)#21 | 0.069%(+1.61)#168 |
| 22. | Kent | 1.42% | 0.33%(+1.10)#22 | 0.069%(+1.35)#200 |
| 23. | Lake Tapps | 1.38% | 0.33%(+1.05)#23 | 0.069%(+1.31)#209 |
| 24. | Federal Way | 1.35% | 0.33%(+1.02)#24 | 0.069%(+1.28)#213 |
| 25. | Graham | 1.32% | 0.33%(+0.995)#25 | 0.069%(+1.25)#219 |
| 26. | Des Moines | 1.29% | 0.33%(+0.960)#26 | 0.069%(+1.22)#227 |
| 27. | Bangor Base | 1.22% | 0.33%(+0.899)#27 | 0.069%(+1.16)#233 |
| 28. | Satsop | 1.17% | 0.33%(+0.847)#28 | 0.069%(+1.10)#242 |
| 29. | Millwood | 1.14% | 0.33%(+0.815)#29 | 0.069%(+1.07)#253 |
| 30. | Enetai | 1.12% | 0.33%(+0.798)#30 | 0.069%(+1.05)#255 |
| 31. | Boulevard Park | 1.11% | 0.33%(+0.786)#31 | 0.069%(+1.04)#260 |
| 32. | Auburn | 1.05% | 0.33%(+0.723)#32 | 0.069%(+0.980)#274 |
| 33. | Fife Heights | 1.02% | 0.33%(+0.692)#33 | 0.069%(+0.948)#282 |
| 34. | Silver Firs | 0.97% | 0.33%(+0.642)#34 | 0.069%(+0.898)#298 |
| 35. | Central Park | 0.97% | 0.33%(+0.641)#35 | 0.069%(+0.897)#299 |
| 36. | Chain Lake | 0.94% | 0.33%(+0.612)#36 | 0.069%(+0.868)#306 |
| 37. | Tacoma | 0.92% | 0.33%(+0.599)#37 | 0.069%(+0.856)#311 |
| 38. | Belfair | 0.84% | 0.33%(+0.513)#38 | 0.069%(+0.769)#342 |
| 39. | Davenport | 0.81% | 0.33%(+0.486)#39 | 0.069%(+0.742)#349 |
| 40. | Renton | 0.80% | 0.33%(+0.472)#40 | 0.069%(+0.728)#355 |
| 41. | Marietta Alderwood | 0.79% | 0.33%(+0.462)#41 | 0.069%(+0.718)#360 |
| 42. | Manchester | 0.76% | 0.33%(+0.437)#42 | 0.069%(+0.693)#368 |
| 43. | Colville | 0.73% | 0.33%(+0.405)#43 | 0.069%(+0.662)#383 |
| 44. | Ridgefield | 0.69% | 0.33%(+0.363)#44 | 0.069%(+0.619)#398 |
| 45. | Puyallup | 0.68% | 0.33%(+0.351)#45 | 0.069%(+0.607)#404 |
| 46. | North Lynnwood | 0.61% | 0.33%(+0.290)#46 | 0.069%(+0.546)#437 |
| 47. | Orchards | 0.59% | 0.33%(+0.263)#47 | 0.069%(+0.520)#458 |
| 48. | Wapato | 0.59% | 0.33%(+0.262)#48 | 0.069%(+0.518)#460 |
| 49. | Lacey | 0.56% | 0.33%(+0.233)#49 | 0.069%(+0.489)#479 |
| 50. | Chico | 0.55% | 0.33%(+0.227)#50 | 0.069%(+0.484)#482 |
| 51. | Issaquah | 0.53% | 0.33%(+0.208)#51 | 0.069%(+0.464)#492 |
| 52. | Parkwood | 0.51% | 0.33%(+0.181)#52 | 0.069%(+0.438)#512 |
| 53. | Rosalia | 0.50% | 0.33%(+0.176)#53 | 0.069%(+0.432)#515 |
| 54. | Larch Way | 0.50% | 0.33%(+0.175)#54 | 0.069%(+0.431)#517 |
| 55. | Friday Harbor | 0.49% | 0.33%(+0.166)#55 | 0.069%(+0.422)#524 |
| 56. | South Hill | 0.48% | 0.33%(+0.157)#56 | 0.069%(+0.413)#537 |
| 57. | Vancouver | 0.45% | 0.33%(+0.127)#57 | 0.069%(+0.384)#560 |
| 58. | Bryn Mawr Skyway | 0.44% | 0.33%(+0.118)#58 | 0.069%(+0.375)#571 |
| 59. | Lake Morton Berrydale | 0.44% | 0.33%(+0.115)#59 | 0.069%(+0.371)#573 |
| 60. | Burien | 0.39% | 0.33%(+0.065)#60 | 0.069%(+0.321)#624 |
| 61. | Ferndale | 0.38% | 0.33%(+0.051)#61 | 0.069%(+0.308)#639 |
| 62. | University Place | 0.36% | 0.33%(+0.032)#62 | 0.069%(+0.288)#660 |
| 63. | Ilwaco | 0.35% | 0.33%(+0.024)#63 | 0.069%(+0.280)#671 |
| 64. | Airway Heights | 0.34% | 0.33%(+0.015)#64 | 0.069%(+0.272)#684 |
| 65. | Frederickson | 0.34% | 0.33%(+0.014)#65 | 0.069%(+0.271)#687 |
| 66. | Elk Plain | 0.33% | 0.33%(+0.005)#66 | 0.069%(+0.261)#697 |
| 67. | Skokomish | 0.31% | 0.33%(-0.015)#67 | 0.069%(+0.242)#720 |
| 68. | Country Homes | 0.29% | 0.33%(-0.037)#68 | 0.069%(+0.219)#754 |
| 69. | Steilacoom | 0.28% | 0.33%(-0.041)#69 | 0.069%(+0.215)#761 |
| 70. | Ellensburg | 0.28% | 0.33%(-0.041)#70 | 0.069%(+0.215)#763 |
| 71. | Richland | 0.27% | 0.33%(-0.054)#71 | 0.069%(+0.202)#786 |
| 72. | Fort Lewis | 0.27% | 0.33%(-0.057)#72 | 0.069%(+0.199)#791 |
| 73. | Deer Park | 0.27% | 0.33%(-0.058)#73 | 0.069%(+0.199)#793 |
| 74. | Roche Harbor | 0.27% | 0.33%(-0.060)#74 | 0.069%(+0.197)#796 |
| 75. | Olympia | 0.26% | 0.33%(-0.066)#75 | 0.069%(+0.190)#806 |
| 76. | Aberdeen | 0.25% | 0.33%(-0.072)#76 | 0.069%(+0.184)#817 |
| 77. | Edmonds | 0.25% | 0.33%(-0.075)#77 | 0.069%(+0.182)#825 |
| 78. | Mill Creek East | 0.25% | 0.33%(-0.080)#78 | 0.069%(+0.176)#832 |
| 79. | Bonney Lake | 0.24% | 0.33%(-0.082)#79 | 0.069%(+0.174)#834 |
| 80. | Mcchord Afb | 0.24% | 0.33%(-0.084)#80 | 0.069%(+0.172)#838 |
| 81. | Camas | 0.23% | 0.33%(-0.090)#81 | 0.069%(+0.166)#849 |
| 82. | Ritzville | 0.23% | 0.33%(-0.094)#82 | 0.069%(+0.162)#860 |
| 83. | Castle Rock | 0.23% | 0.33%(-0.097)#83 | 0.069%(+0.160)#864 |
| 84. | Salmon Creek | 0.23% | 0.33%(-0.099)#84 | 0.069%(+0.157)#865 |
| 85. | Covington | 0.22% | 0.33%(-0.109)#85 | 0.069%(+0.147)#883 |
| 86. | East Renton Highlands | 0.21% | 0.33%(-0.118)#86 | 0.069%(+0.138)#908 |
| 87. | Walla Walla | 0.21% | 0.33%(-0.118)#87 | 0.069%(+0.138)#909 |
| 88. | Snohomish | 0.20% | 0.33%(-0.128)#88 | 0.069%(+0.128)#925 |
| 89. | Connell | 0.19% | 0.33%(-0.132)#89 | 0.069%(+0.124)#936 |
| 90. | Eastmont | 0.18% | 0.33%(-0.144)#90 | 0.069%(+0.112)#955 |
| 91. | Dayton | 0.18% | 0.33%(-0.144)#91 | 0.069%(+0.112)#957 |
| 92. | Bremerton | 0.18% | 0.33%(-0.146)#92 | 0.069%(+0.111)#962 |
| 93. | Artondale | 0.17% | 0.33%(-0.152)#93 | 0.069%(+0.104)#986 |
| 94. | Nisqually Indian Community | 0.17% | 0.33%(-0.157)#94 | 0.069%(+0.100)#1,000 |
| 95. | Port Orchard | 0.16% | 0.33%(-0.161)#95 | 0.069%(+0.095)#1,015 |
| 96. | Sequim | 0.16% | 0.33%(-0.164)#96 | 0.069%(+0.092)#1,023 |
| 97. | Tracyton | 0.16% | 0.33%(-0.165)#97 | 0.069%(+0.091)#1,025 |
| 98. | Seattle | 0.16% | 0.33%(-0.167)#98 | 0.069%(+0.089)#1,032 |
| 99. | Woodinville | 0.15% | 0.33%(-0.175)#99 | 0.069%(+0.081)#1,058 |
| 100. | Everett | 0.15% | 0.33%(-0.176)#100 | 0.069%(+0.081)#1,061 |
Common Questions
What are the Top 10 Cities with the Highest Percentage of Samoan Population in Washington?
Top 10 Cities with the Highest Percentage of Samoan Population in Washington are:
#1
14.95%
#2
5.42%
#3
4.15%
#4
4.07%
#5
3.71%
#6
3.57%
#7
3.05%
#8
2.68%
#9
2.62%
#10
2.61%
What city has the Highest Percentage of Samoan Population in Washington?
Ocean City has the Highest Percentage of Samoan Population in Washington with 14.95%.
What is the Percentage of Samoan Population in the State of Washington?
Percentage of Samoan Population in Washington is 0.33%.
What is the Percentage of Samoan Population in the United States?
Percentage of Samoan Population in the United States is 0.069%.