Cities with the Highest Percentage of Immigrants from Venezuela in Washington

RELATED REPORTS & OPTIONS

Venezuela
Population
Families and Households
Female Fertility
Female Fertility (Unmarried)
Race (Community Size)
Race (Percentage)
Ancestry (Community Size)
AfghanAfricanAlaska NativeAlaskan AthabascanAlbanianAleutAlsatianAmericanApacheArabArapahoArgentineanArmenianAssyrian / Chaldean / SyriacAustralianAustrianBahamianBangladeshiBarbadianBasqueBelgianBelizeanBermudanBhutaneseBlackfeetBolivianBrazilianBritishBritish West IndianBulgarianBurmeseCajunCambodianCanadianCape VerdeanCarpatho RusynCelticCentral AmericanCentral American IndianCherokeeCheyenneChickasawChileanChineseChippewaChoctawColombianColvilleComancheCosta RicanCreeCreekCroatianCrowCubanCypriotCzechCzechoslovakianDanishDelawareDominicanDutchDutch West IndianEastern EuropeanEcuadorianEgyptianEnglishEstonianEthiopianEuropeanFijianFilipinoFinnishFrenchFrench American IndianFrench CanadianGermanGerman RussianGhanaianGreekGuamanian / ChamorroGuatemalanGuyaneseHaitianHmongHonduranHopiHoumaHungarianIcelanderIndian (Asian)IndonesianInupiatIranianIraqiIrishIroquoisIsraeliItalianJamaicanJapaneseJordanianKenyanKiowaKoreanLaotianLatvianLebaneseLiberianLithuanianLumbeeLuxembourgerMacedonianMalaysianMalteseMarshalleseMenomineeMexicanMexican American IndianMongolianMoroccanNative HawaiianNavajoNepaleseNew ZealanderNicaraguanNigerianNorthern EuropeanNorwegianOkinawanOsageOttawaPaiutePakistaniPalestinianPanamanianParaguayanPennsylvania GermanPeruvianPimaPolishPortuguesePotawatomiPuebloPuerto RicanPuget Sound SalishRomanianRussianSalvadoranSamoanScandinavianScotch-IrishScottishSeminoleSenegaleseSerbianShoshoneSierra LeoneanSiouxSlavicSlovakSloveneSomaliSouth AfricanSouth AmericanSouth American IndianSoviet UnionSpaniardSpanishSpanish AmericanSpanish American IndianSri LankanSubsaharan AfricanSudaneseSwedishSwissSyrianTaiwaneseThaiTlingit-HaidaTohono O'OdhamTonganTrinidadian and TobagonianTsimshianTurkishU.S. Virgin IslanderUgandanUkrainianUruguayanUteVenezuelanVietnameseWelshWest IndianYakamaYaquiYugoslavianYumanYup'ikZimbabwean
Ancestry (Percentage)
AfghanAfricanAlaska NativeAlaskan AthabascanAlbanianAleutAlsatianAmericanApacheArabArapahoArgentineanArmenianAssyrian / Chaldean / SyriacAustralianAustrianBahamianBangladeshiBarbadianBasqueBelgianBelizeanBermudanBhutaneseBlackfeetBolivianBrazilianBritishBritish West IndianBulgarianBurmeseCajunCambodianCanadianCape VerdeanCarpatho RusynCelticCentral AmericanCentral American IndianCherokeeCheyenneChickasawChileanChineseChippewaChoctawColombianColvilleComancheCosta RicanCreeCreekCroatianCrowCubanCypriotCzechCzechoslovakianDanishDelawareDominicanDutchDutch West IndianEastern EuropeanEcuadorianEgyptianEnglishEstonianEthiopianEuropeanFijianFilipinoFinnishFrenchFrench American IndianFrench CanadianGermanGerman RussianGhanaianGreekGuamanian / ChamorroGuatemalanGuyaneseHaitianHmongHonduranHopiHoumaHungarianIcelanderIndian (Asian)IndonesianInupiatIranianIraqiIrishIroquoisIsraeliItalianJamaicanJapaneseJordanianKenyanKiowaKoreanLaotianLatvianLebaneseLiberianLithuanianLumbeeLuxembourgerMacedonianMalaysianMalteseMarshalleseMenomineeMexicanMexican American IndianMongolianMoroccanNative HawaiianNavajoNepaleseNew ZealanderNicaraguanNigerianNorthern EuropeanNorwegianOkinawanOsageOttawaPaiutePakistaniPalestinianPanamanianParaguayanPennsylvania GermanPeruvianPimaPolishPortuguesePotawatomiPuebloPuerto RicanPuget Sound SalishRomanianRussianSalvadoranSamoanScandinavianScotch-IrishScottishSeminoleSenegaleseSerbianShoshoneSierra LeoneanSiouxSlavicSlovakSloveneSomaliSouth AfricanSouth AmericanSouth American IndianSoviet UnionSpaniardSpanishSpanish AmericanSpanish American IndianSri LankanSubsaharan AfricanSudaneseSwedishSwissSyrianTaiwaneseThaiTlingit-HaidaTohono O'OdhamTonganTrinidadian and TobagonianTsimshianTurkishU.S. Virgin IslanderUgandanUkrainianUruguayanUteVenezuelanVietnameseWelshWest IndianYakamaYaquiYugoslavianYumanYup'ikZimbabwean
Immigrant Origin (Total)
AfghanistanAfricaAlbaniaArgentinaArmeniaAsiaAustraliaAustriaAzoresBahamasBangladeshBarbadosBelarusBelgiumBelizeBoliviaBosnia and HerzegovinaBrazilBulgariaBurma / MyanmarCabo VerdeCambodiaCameroonCanadaCaribbeanCentral AmericaChileChinaColombiaCongoCosta RicaCroatiaCubaCzechoslovakiaDenmarkDominicaDominican RepublicEastern AfricaEastern AsiaEastern EuropeEcuadorEgyptEl SalvadorEnglandEritreaEthiopiaEuropeFijiFranceGermanyGhanaGreeceGrenadaGuatemalaGuyanaHaitiHondurasHong KongHungaryIndiaIndonesiaIranIraqIrelandIsraelItalyJamaicaJapanJordanKazakhstanKenyaKoreaKuwaitLaosLatin AmericaLatviaLebanonLiberiaLithuaniaMalaysiaMexicoMicronesiaMiddle AfricaMoldovaMoroccoNepalNetherlandsNicaraguaNigeriaNorth MacedoniaNorthern AfricaNorthern EuropeNorwayOceaniaPakistanPanamaPeruPhilippinesPolandPortugalRomaniaRussiaSaudi ArabiaScotlandSenegalSerbiaSierra LeoneSingaporeSomaliaSouth AfricaSouth AmericaSouth Central AsiaSouth Eastern AsiaSouthern EuropeSpainSri LankaSt. Vincent and the GrenadinesSudanSwedenSwitzerlandSyriaTaiwanThailandTrinidad and TobagoTurkeyUgandaUkraineUruguayUzbekistanVenezuelaVietnamWest IndiesWestern AfricaWestern AsiaWestern EuropeYemenZaireZimbabwe
Immigrant Origin (Percentage)
AfghanistanAfricaAlbaniaArgentinaArmeniaAsiaAustraliaAustriaAzoresBahamasBangladeshBarbadosBelarusBelgiumBelizeBoliviaBosnia and HerzegovinaBrazilBulgariaBurma / MyanmarCabo VerdeCambodiaCameroonCanadaCaribbeanCentral AmericaChileChinaColombiaCongoCosta RicaCroatiaCubaCzechoslovakiaDenmarkDominicaDominican RepublicEastern AfricaEastern AsiaEastern EuropeEcuadorEgyptEl SalvadorEnglandEritreaEthiopiaEuropeFijiFranceGermanyGhanaGreeceGrenadaGuatemalaGuyanaHaitiHondurasHong KongHungaryIndiaIndonesiaIranIraqIrelandIsraelItalyJamaicaJapanJordanKazakhstanKenyaKoreaKuwaitLaosLatin AmericaLatviaLebanonLiberiaLithuaniaMalaysiaMexicoMicronesiaMiddle AfricaMoldovaMoroccoNepalNetherlandsNicaraguaNigeriaNorth MacedoniaNorthern AfricaNorthern EuropeNorwayOceaniaPakistanPanamaPeruPhilippinesPolandPortugalRomaniaRussiaSaudi ArabiaScotlandSenegalSerbiaSierra LeoneSingaporeSomaliaSouth AfricaSouth AmericaSouth Central AsiaSouth Eastern AsiaSouthern EuropeSpainSri LankaSt. Vincent and the GrenadinesSudanSwedenSwitzerlandSyriaTaiwanThailandTrinidad and TobagoTurkeyUgandaUkraineUruguayUzbekistanVenezuelaVietnamWest IndiesWestern AfricaWestern AsiaWestern EuropeYemenZaireZimbabwe
Income
Income (Families)
Income (Households)
Poverty
Poverty (Families)
Unemployment
Employment Occupations
Employment Industries
Employer Class
Commute Time
Commute Means
School Enrollment
Education by Degree Field
Occupancy
Finances
Physical Characteristics
Washington
Compare Cities
Comparison Subject

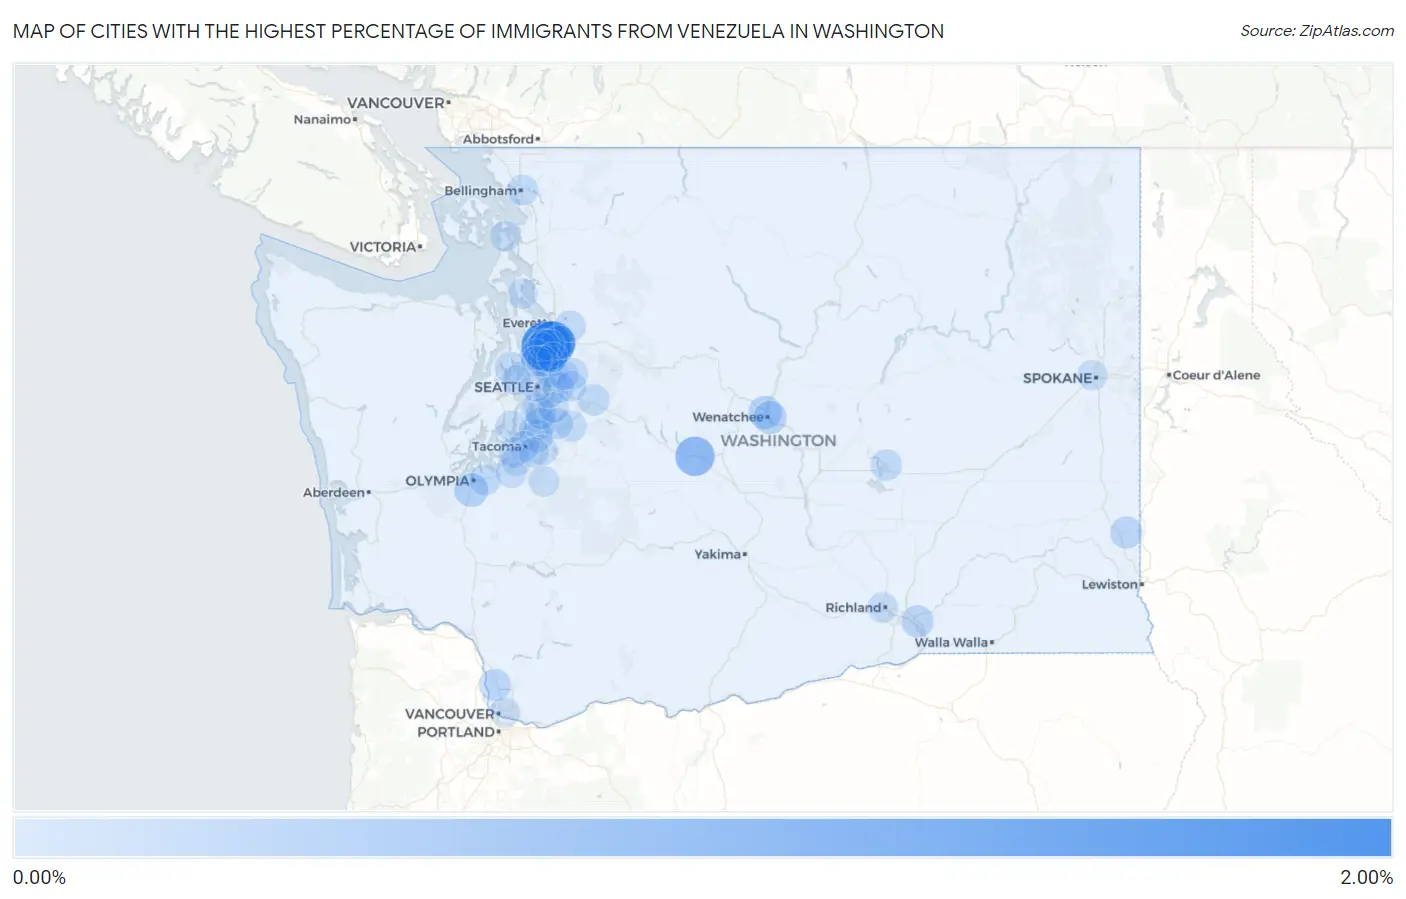
Map of Cities with the Highest Percentage of Immigrants from Venezuela in Washington

0.00%
2.00%
Cities with the Highest Percentage of Immigrants from Venezuela in Washington Map

Cities with the Highest Percentage of Immigrants from Venezuela in Washington

City Venezuela vs State vs National
1.Larch Way1.82%0.041%(+1.78)#20.16%(+1.66)#847
2.Mill Creek1.39%0.041%(+1.35)#70.16%(+1.23)#1,526
3.Tehaleh1.13%0.041%(+1.09)#180.16%(+0.972)#1,982
4.South Cle Elum0.84%0.041%(+0.798)#530.16%(+0.682)#3,199
5.Tumwater0.34%0.041%(+0.298)#1020.16%(+0.183)#4,898
6.Silver Firs0.32%0.041%(+0.283)#1030.16%(+0.167)#4,899
7.Wenatchee0.29%0.041%(+0.247)#1370.16%(+0.132)#5,806
8.East Wenatchee0.27%0.041%(+0.229)#1380.16%(+0.113)#5,807
9.Lynnwood0.25%0.041%(+0.207)#1390.16%(+0.092)#5,808
10.Federal Way0.23%0.041%(+0.188)#1400.16%(+0.072)#5,809
11.Kenmore0.20%0.041%(+0.162)#1410.16%(+0.047)#5,810
12.Pullman0.19%0.041%(+0.149)#1420.16%(+0.034)#5,811
13.Burbank0.18%0.041%(+0.136)#1650.16%(+0.021)#6,743
14.Ridgefield0.17%0.041%(+0.133)#1660.16%(+0.017)#6,744
15.Kirkland0.15%0.041%(+0.112)#1670.16%(-0.004)#6,745
16.Des Moines0.14%0.041%(+0.096)#1680.16%(-0.019)#6,746
17.Union Hill Novelty Hill0.13%0.041%(+0.092)#1690.16%(-0.023)#6,747
18.Moses Lake0.12%0.041%(+0.078)#1700.16%(-0.038)#6,748
19.Esperance0.12%0.041%(+0.076)#1890.16%(-0.040)#7,259
20.Snoqualmie0.12%0.041%(+0.075)#1900.16%(-0.041)#7,260
21.Suquamish0.12%0.041%(+0.074)#1910.16%(-0.041)#7,261
22.Everett0.11%0.041%(+0.073)#1920.16%(-0.042)#7,262
23.Burien0.10%0.041%(+0.062)#1930.16%(-0.054)#7,263
24.Lacey0.100%0.041%(+0.058)#1940.16%(-0.057)#7,264
25.Bellevue0.092%0.041%(+0.050)#1950.16%(-0.065)#7,265
26.North Lynnwood0.091%0.041%(+0.049)#1960.16%(-0.066)#7,266
27.Maplewood0.091%0.041%(+0.049)#1970.16%(-0.066)#7,267
28.Maple Valley0.086%0.041%(+0.045)#1980.16%(-0.071)#7,268
29.Seatac0.084%0.041%(+0.043)#1990.16%(-0.073)#7,269
30.Bellingham0.079%0.041%(+0.037)#2000.16%(-0.078)#7,270
31.Martha Lake0.077%0.041%(+0.036)#2010.16%(-0.079)#7,271
32.Kent0.077%0.041%(+0.036)#2020.16%(-0.080)#7,272
33.Mercer Island0.075%0.041%(+0.033)#2030.16%(-0.082)#7,273
34.Fort Lewis0.074%0.041%(+0.033)#2040.16%(-0.082)#7,274
35.Lake Forest Park0.067%0.041%(+0.025)#2050.16%(-0.090)#7,275
36.Graham0.063%0.041%(+0.022)#2060.16%(-0.094)#7,276
37.Shoreline0.058%0.041%(+0.017)#2070.16%(-0.099)#7,277
38.Edgewood0.056%0.041%(+0.015)#2080.16%(-0.100)#7,278
39.Renton0.051%0.041%(+0.010)#2090.16%(-0.106)#7,279
40.University Place0.049%0.041%(+0.008)#2100.16%(-0.108)#7,280
41.Sammamish0.047%0.041%(+0.005)#2110.16%(-0.110)#7,281
42.Seattle0.045%0.041%(+0.004)#2120.16%(-0.111)#7,282
43.Bainbridge Island0.045%0.041%(+0.003)#2130.16%(-0.112)#7,283
44.Camano0.040%0.041%(-0.002)#2140.16%(-0.117)#7,860
45.Richland0.039%0.041%(-0.002)#2150.16%(-0.117)#7,861
46.Spokane0.032%0.041%(-0.009)#2160.16%(-0.125)#7,862
47.Tacoma0.032%0.041%(-0.009)#2170.16%(-0.125)#7,863
48.Redmond0.028%0.041%(-0.013)#2180.16%(-0.128)#7,864
49.Anacortes0.023%0.041%(-0.019)#2190.16%(-0.134)#7,865
50.Bothell0.019%0.041%(-0.023)#2200.16%(-0.138)#7,866
51.Lakewood0.014%0.041%(-0.027)#2210.16%(-0.143)#7,867
52.Waller0.013%0.041%(-0.029)#2220.16%(-0.144)#7,868
53.Vancouver0.0089%0.041%(-0.032)#2230.16%(-0.148)#7,869

Common Questions

What are the Top 10 Cities with the Highest Percentage of Immigrants from Venezuela in Washington?
Top 10 Cities with the Highest Percentage of Immigrants from Venezuela in Washington are:
#1
1.82%
#2
1.39%
#3
0.84%
#4
0.34%
#5
0.32%
#6
0.29%
#7
0.27%
#8
0.25%
#9
0.23%
#10
0.20%
What city has the Highest Percentage of Immigrants from Venezuela in Washington?
Larch Way has the Highest Percentage of Immigrants from Venezuela in Washington with 1.82%.
What is the Percentage of Immigrants from Venezuela in the State of Washington?
Percentage of Immigrants from Venezuela in Washington is 0.041%.
What is the Percentage of Immigrants from Venezuela in the United States?
Percentage of Immigrants from Venezuela in the United States is 0.16%.