Cities with the Highest Percentage of Icelander Population in Washington
RELATED REPORTS & OPTIONS
Icelander
Washington
Compare Cities
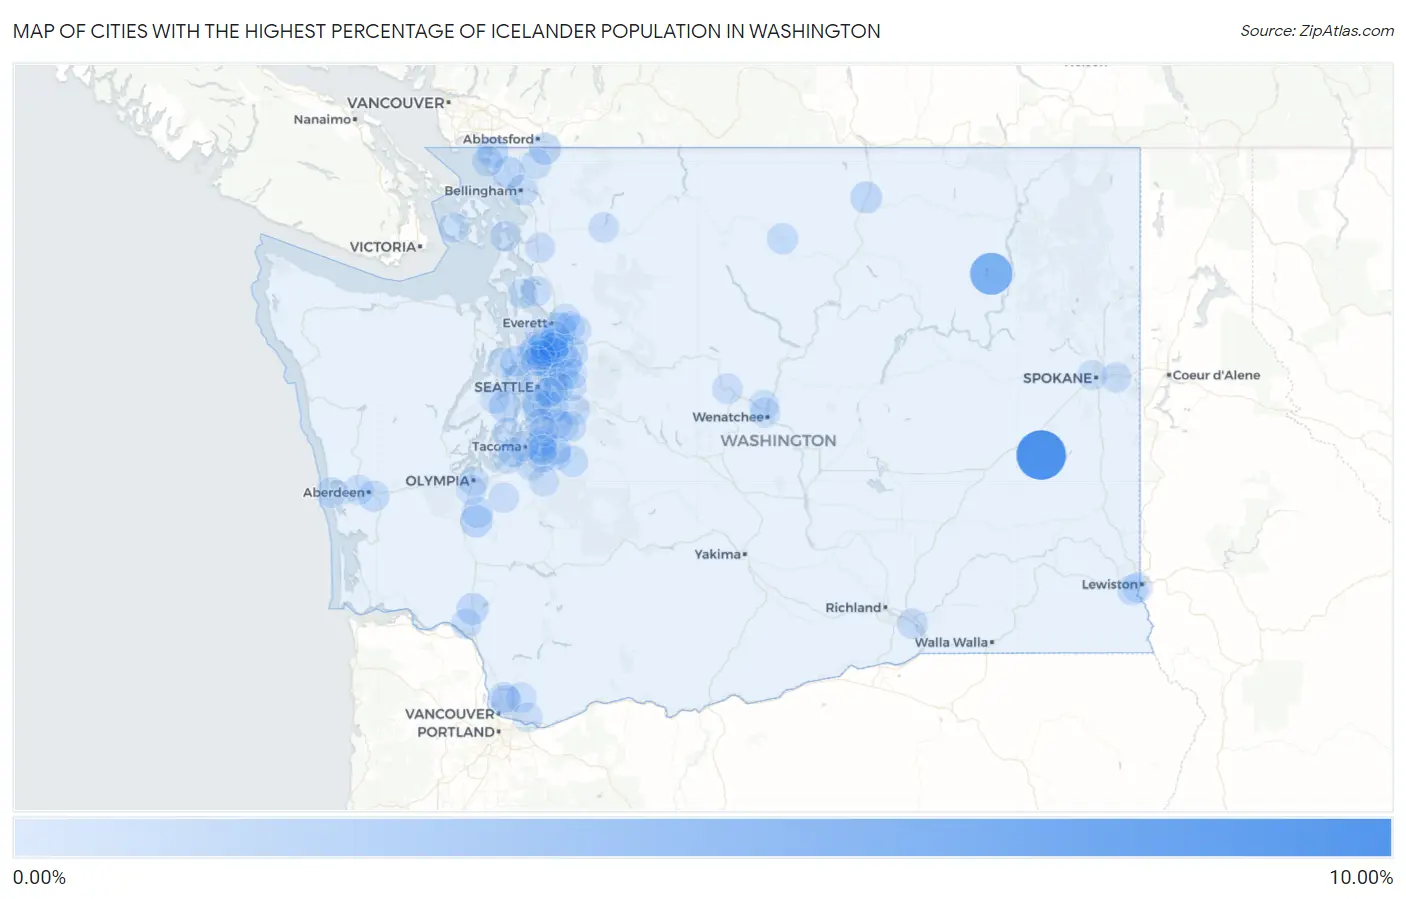
Map of Cities with the Highest Percentage of Icelander Population in Washington
0.00%
10.00%
Cities with the Highest Percentage of Icelander Population in Washington
| City | Icelander | vs State | vs National | |
| 1. | Lamont | 8.81% | 0.074%(+8.73)#1 | 0.016%(+8.79)#11 |
| 2. | Twin Lakes | 5.41% | 0.074%(+5.33)#2 | 0.016%(+5.39)#17 |
| 3. | Fobes Hill | 1.12% | 0.074%(+1.04)#3 | 0.016%(+1.10)#102 |
| 4. | Lexington | 1.08% | 0.074%(+1.00)#4 | 0.016%(+1.06)#108 |
| 5. | Bucoda | 1.06% | 0.074%(+0.989)#5 | 0.016%(+1.05)#110 |
| 6. | Erlands Point | 1.00% | 0.074%(+0.922)#6 | 0.016%(+0.981)#120 |
| 7. | Roche Harbor | 0.93% | 0.074%(+0.855)#7 | 0.016%(+0.914)#130 |
| 8. | Bethel | 0.92% | 0.074%(+0.850)#8 | 0.016%(+0.909)#132 |
| 9. | Cottage Lake | 0.92% | 0.074%(+0.842)#9 | 0.016%(+0.901)#133 |
| 10. | Ferndale | 0.89% | 0.074%(+0.811)#10 | 0.016%(+0.870)#142 |
| 11. | Sumas | 0.86% | 0.074%(+0.784)#11 | 0.016%(+0.843)#148 |
| 12. | Castle Rock | 0.80% | 0.074%(+0.726)#12 | 0.016%(+0.785)#159 |
| 13. | Tonasket | 0.77% | 0.074%(+0.693)#13 | 0.016%(+0.752)#169 |
| 14. | Blaine | 0.75% | 0.074%(+0.676)#14 | 0.016%(+0.735)#174 |
| 15. | Buckley | 0.54% | 0.074%(+0.465)#15 | 0.016%(+0.524)#224 |
| 16. | Tenino | 0.54% | 0.074%(+0.463)#16 | 0.016%(+0.522)#225 |
| 17. | Winthrop | 0.49% | 0.074%(+0.416)#17 | 0.016%(+0.475)#239 |
| 18. | Cosmopolis | 0.49% | 0.074%(+0.413)#18 | 0.016%(+0.472)#240 |
| 19. | Milton | 0.43% | 0.074%(+0.359)#19 | 0.016%(+0.417)#259 |
| 20. | Indianola | 0.42% | 0.074%(+0.348)#20 | 0.016%(+0.407)#263 |
| 21. | High Bridge | 0.42% | 0.074%(+0.343)#21 | 0.016%(+0.402)#265 |
| 22. | Beaux Arts Village | 0.39% | 0.074%(+0.313)#22 | 0.016%(+0.372)#282 |
| 23. | Bellingham | 0.35% | 0.074%(+0.278)#23 | 0.016%(+0.337)#306 |
| 24. | Warm Beach | 0.35% | 0.074%(+0.274)#24 | 0.016%(+0.333)#310 |
| 25. | Bonney Lake | 0.34% | 0.074%(+0.262)#25 | 0.016%(+0.321)#320 |
| 26. | Mount Vista | 0.32% | 0.074%(+0.243)#26 | 0.016%(+0.302)#331 |
| 27. | Finley | 0.31% | 0.074%(+0.233)#27 | 0.016%(+0.292)#338 |
| 28. | Clarkston Heights Vineland | 0.29% | 0.074%(+0.220)#28 | 0.016%(+0.279)#350 |
| 29. | Clover Creek | 0.29% | 0.074%(+0.211)#29 | 0.016%(+0.270)#359 |
| 30. | Birch Bay | 0.28% | 0.074%(+0.204)#30 | 0.016%(+0.263)#363 |
| 31. | Lake Forest Park | 0.27% | 0.074%(+0.193)#31 | 0.016%(+0.252)#374 |
| 32. | Leavenworth | 0.27% | 0.074%(+0.193)#32 | 0.016%(+0.252)#375 |
| 33. | Maltby | 0.26% | 0.074%(+0.190)#33 | 0.016%(+0.249)#380 |
| 34. | Ocean Shores | 0.26% | 0.074%(+0.189)#34 | 0.016%(+0.248)#382 |
| 35. | Concrete | 0.25% | 0.074%(+0.178)#35 | 0.016%(+0.237)#394 |
| 36. | Yelm | 0.25% | 0.074%(+0.175)#36 | 0.016%(+0.233)#398 |
| 37. | Hockinson | 0.24% | 0.074%(+0.166)#37 | 0.016%(+0.224)#409 |
| 38. | Gig Harbor | 0.23% | 0.074%(+0.160)#38 | 0.016%(+0.219)#415 |
| 39. | Three Lakes | 0.22% | 0.074%(+0.150)#39 | 0.016%(+0.208)#430 |
| 40. | Kenmore | 0.22% | 0.074%(+0.146)#40 | 0.016%(+0.205)#434 |
| 41. | Mirrormont | 0.22% | 0.074%(+0.145)#41 | 0.016%(+0.204)#435 |
| 42. | Barberton | 0.21% | 0.074%(+0.139)#42 | 0.016%(+0.198)#443 |
| 43. | Maple Valley | 0.20% | 0.074%(+0.126)#43 | 0.016%(+0.185)#462 |
| 44. | Anacortes | 0.19% | 0.074%(+0.118)#44 | 0.016%(+0.177)#474 |
| 45. | Longview Heights | 0.19% | 0.074%(+0.116)#45 | 0.016%(+0.175)#480 |
| 46. | West Clarkston Highland | 0.18% | 0.074%(+0.106)#46 | 0.016%(+0.165)#497 |
| 47. | Woodway | 0.18% | 0.074%(+0.104)#47 | 0.016%(+0.163)#500 |
| 48. | Mount Vernon | 0.17% | 0.074%(+0.099)#48 | 0.016%(+0.158)#508 |
| 49. | Lake Tapps | 0.16% | 0.074%(+0.090)#49 | 0.016%(+0.148)#533 |
| 50. | Edmonds | 0.16% | 0.074%(+0.087)#50 | 0.016%(+0.146)#536 |
| 51. | Bainbridge Island | 0.16% | 0.074%(+0.084)#51 | 0.016%(+0.142)#545 |
| 52. | Lakeland South | 0.15% | 0.074%(+0.076)#52 | 0.016%(+0.135)#553 |
| 53. | Lynnwood | 0.15% | 0.074%(+0.076)#53 | 0.016%(+0.135)#554 |
| 54. | Kirkland | 0.15% | 0.074%(+0.075)#54 | 0.016%(+0.134)#556 |
| 55. | Spokane Valley | 0.15% | 0.074%(+0.074)#55 | 0.016%(+0.133)#558 |
| 56. | Graham | 0.15% | 0.074%(+0.072)#56 | 0.016%(+0.131)#560 |
| 57. | Puyallup | 0.14% | 0.074%(+0.069)#57 | 0.016%(+0.128)#571 |
| 58. | Alderwood Manor | 0.14% | 0.074%(+0.068)#58 | 0.016%(+0.127)#574 |
| 59. | Renton | 0.14% | 0.074%(+0.067)#59 | 0.016%(+0.126)#577 |
| 60. | Sunnyslope | 0.14% | 0.074%(+0.066)#60 | 0.016%(+0.125)#578 |
| 61. | Mill Creek | 0.14% | 0.074%(+0.065)#61 | 0.016%(+0.124)#582 |
| 62. | Covington | 0.14% | 0.074%(+0.065)#62 | 0.016%(+0.124)#583 |
| 63. | Brier | 0.14% | 0.074%(+0.063)#63 | 0.016%(+0.122)#589 |
| 64. | Hoquiam | 0.14% | 0.074%(+0.063)#64 | 0.016%(+0.122)#591 |
| 65. | Everson | 0.14% | 0.074%(+0.061)#65 | 0.016%(+0.120)#594 |
| 66. | Steilacoom | 0.13% | 0.074%(+0.060)#66 | 0.016%(+0.119)#596 |
| 67. | Burien | 0.13% | 0.074%(+0.054)#67 | 0.016%(+0.113)#612 |
| 68. | Sammamish | 0.13% | 0.074%(+0.052)#68 | 0.016%(+0.111)#617 |
| 69. | Friday Harbor | 0.11% | 0.074%(+0.039)#69 | 0.016%(+0.098)#645 |
| 70. | Bryn Mawr Skyway | 0.11% | 0.074%(+0.036)#70 | 0.016%(+0.095)#652 |
| 71. | Spokane | 0.11% | 0.074%(+0.034)#71 | 0.016%(+0.093)#654 |
| 72. | Seattle | 0.11% | 0.074%(+0.031)#72 | 0.016%(+0.090)#662 |
| 73. | White Center | 0.10% | 0.074%(+0.029)#73 | 0.016%(+0.088)#667 |
| 74. | North Lynnwood | 0.10% | 0.074%(+0.029)#74 | 0.016%(+0.088)#668 |
| 75. | Kent | 0.095% | 0.074%(+0.021)#75 | 0.016%(+0.080)#685 |
| 76. | Redmond | 0.094% | 0.074%(+0.019)#76 | 0.016%(+0.078)#690 |
| 77. | Wenatchee | 0.093% | 0.074%(+0.019)#77 | 0.016%(+0.078)#693 |
| 78. | Des Moines | 0.092% | 0.074%(+0.017)#78 | 0.016%(+0.076)#697 |
| 79. | Bremerton | 0.091% | 0.074%(+0.016)#79 | 0.016%(+0.075)#702 |
| 80. | Union Hill Novelty Hill | 0.086% | 0.074%(+0.012)#80 | 0.016%(+0.071)#715 |
| 81. | Everett | 0.081% | 0.074%(+0.007)#81 | 0.016%(+0.066)#737 |
| 82. | Silver Firs | 0.081% | 0.074%(+0.006)#82 | 0.016%(+0.065)#738 |
| 83. | Lakeland North | 0.080% | 0.074%(+0.006)#83 | 0.016%(+0.065)#740 |
| 84. | Bothell East | 0.079% | 0.074%(+0.004)#84 | 0.016%(+0.063)#746 |
| 85. | Eastmont | 0.078% | 0.074%(+0.003)#85 | 0.016%(+0.062)#748 |
| 86. | Poulsbo | 0.076% | 0.074%(+0.002)#86 | 0.016%(+0.061)#755 |
| 87. | Mill Creek East | 0.075% | 0.074%(+0.001)#87 | 0.016%(+0.059)#758 |
| 88. | Mountlake Terrace | 0.075% | 0.074%(+0.000)#88 | 0.016%(+0.059)#759 |
| 89. | Tacoma | 0.074% | 0.074%(-0.001)#89 | 0.016%(+0.058)#764 |
| 90. | University Place | 0.072% | 0.074%(-0.002)#90 | 0.016%(+0.056)#770 |
| 91. | Shoreline | 0.072% | 0.074%(-0.003)#91 | 0.016%(+0.056)#772 |
| 92. | Tumwater | 0.070% | 0.074%(-0.004)#92 | 0.016%(+0.055)#782 |
| 93. | Camano | 0.068% | 0.074%(-0.006)#93 | 0.016%(+0.052)#793 |
| 94. | Olympia | 0.060% | 0.074%(-0.015)#94 | 0.016%(+0.044)#842 |
| 95. | Camas | 0.057% | 0.074%(-0.018)#95 | 0.016%(+0.041)#857 |
| 96. | Edgewood | 0.056% | 0.074%(-0.018)#96 | 0.016%(+0.041)#859 |
| 97. | Bellevue | 0.056% | 0.074%(-0.018)#97 | 0.016%(+0.041)#860 |
| 98. | Mukilteo | 0.051% | 0.074%(-0.023)#98 | 0.016%(+0.036)#889 |
| 99. | Mercer Island | 0.051% | 0.074%(-0.023)#99 | 0.016%(+0.035)#895 |
| 100. | Lake Stevens | 0.049% | 0.074%(-0.026)#100 | 0.016%(+0.033)#902 |
Common Questions
What are the Top 10 Cities with the Highest Percentage of Icelander Population in Washington?
Top 10 Cities with the Highest Percentage of Icelander Population in Washington are:
#1
8.81%
#2
5.41%
#3
1.12%
#4
1.06%
#5
0.92%
#6
0.92%
#7
0.89%
#8
0.86%
#9
0.80%
#10
0.77%
What city has the Highest Percentage of Icelander Population in Washington?
Lamont has the Highest Percentage of Icelander Population in Washington with 8.81%.
What is the Percentage of Icelander Population in the State of Washington?
Percentage of Icelander Population in Washington is 0.074%.
What is the Percentage of Icelander Population in the United States?
Percentage of Icelander Population in the United States is 0.016%.