Cities with the Most Immigrants from Northern Europe in Washington
RELATED REPORTS & OPTIONS
Northern Europe
Washington
Compare Cities
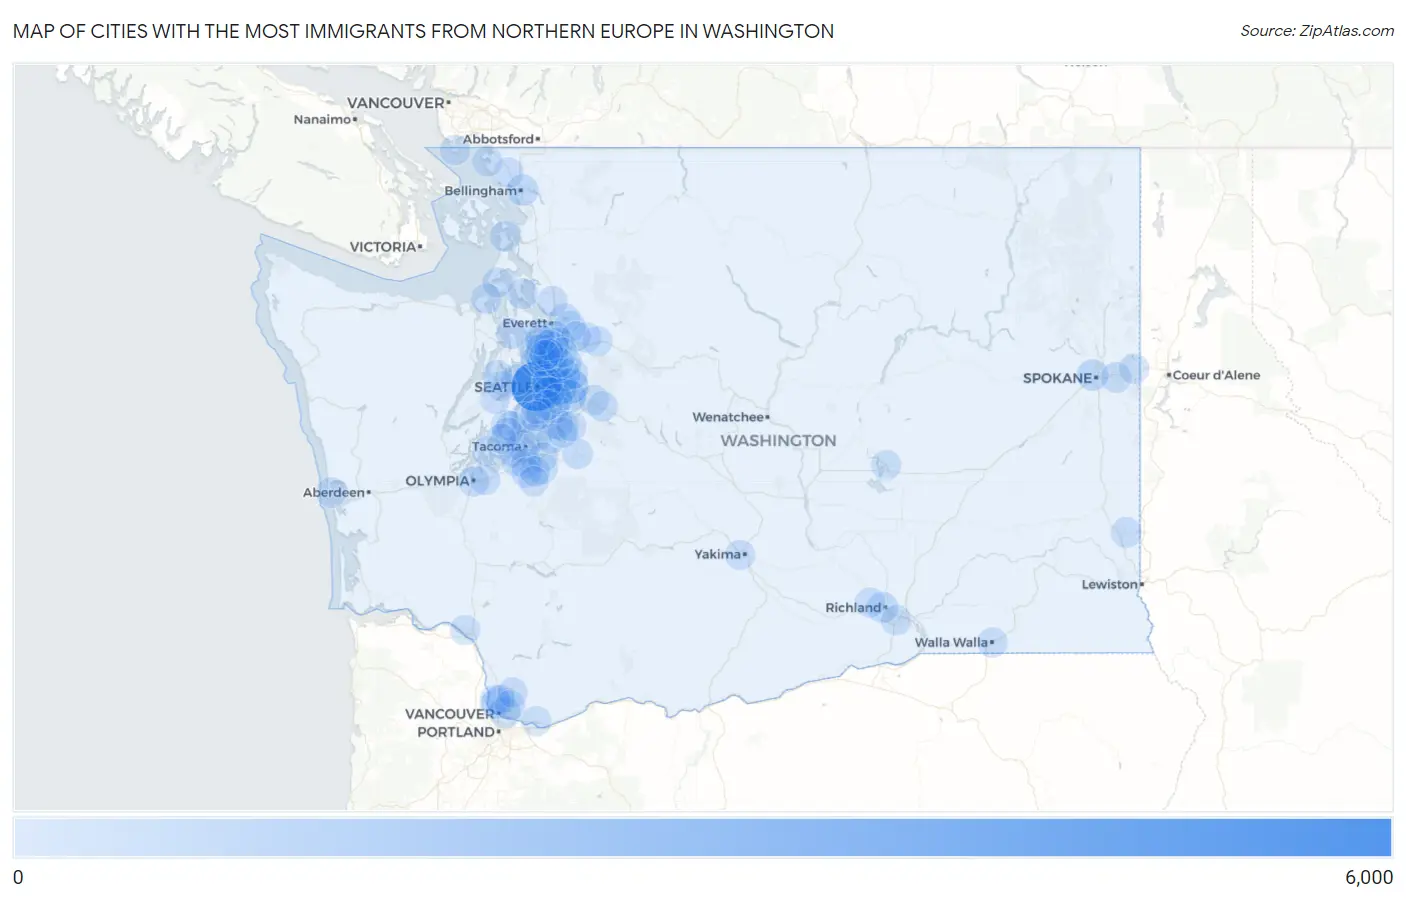
Map of Cities with the Most Immigrants from Northern Europe in Washington
0
6,000
Cities with the Most Immigrants from Northern Europe in Washington
| City | Northern Europe | vs State | vs National | |
| 1. | Seattle | 5,376 | 31,955(16.82%)#1 | 944,917(0.57%)#7 |
| 2. | Bellevue | 1,433 | 31,955(4.48%)#2 | 944,917(0.15%)#39 |
| 3. | Sammamish | 1,230 | 31,955(3.85%)#3 | 944,917(0.13%)#55 |
| 4. | Kirkland | 1,141 | 31,955(3.57%)#4 | 944,917(0.12%)#67 |
| 5. | Redmond | 752 | 31,955(2.35%)#5 | 944,917(0.08%)#124 |
| 6. | Tacoma | 695 | 31,955(2.17%)#6 | 944,917(0.07%)#141 |
| 7. | Issaquah | 609 | 31,955(1.91%)#7 | 944,917(0.06%)#167 |
| 8. | Vancouver | 474 | 31,955(1.48%)#8 | 944,917(0.05%)#210 |
| 9. | Renton | 439 | 31,955(1.37%)#9 | 944,917(0.05%)#238 |
| 10. | Spokane | 428 | 31,955(1.34%)#10 | 944,917(0.05%)#252 |
| 11. | Shoreline | 423 | 31,955(1.32%)#11 | 944,917(0.04%)#259 |
| 12. | Mercer Island | 408 | 31,955(1.28%)#12 | 944,917(0.04%)#274 |
| 13. | Union Hill Novelty Hill | 394 | 31,955(1.23%)#13 | 944,917(0.04%)#291 |
| 14. | Bellingham | 380 | 31,955(1.19%)#14 | 944,917(0.04%)#307 |
| 15. | Kenmore | 313 | 31,955(0.98%)#15 | 944,917(0.03%)#381 |
| 16. | Bainbridge Island | 300 | 31,955(0.94%)#16 | 944,917(0.03%)#401 |
| 17. | Edmonds | 286 | 31,955(0.90%)#17 | 944,917(0.03%)#421 |
| 18. | Richland | 285 | 31,955(0.89%)#18 | 944,917(0.03%)#423 |
| 19. | Bothell | 282 | 31,955(0.88%)#19 | 944,917(0.03%)#432 |
| 20. | Mill Creek | 281 | 31,955(0.88%)#20 | 944,917(0.03%)#440 |
| 21. | Cottage Lake | 280 | 31,955(0.88%)#21 | 944,917(0.03%)#443 |
| 22. | Mountlake Terrace | 254 | 31,955(0.79%)#22 | 944,917(0.03%)#508 |
| 23. | Everett | 246 | 31,955(0.77%)#23 | 944,917(0.03%)#536 |
| 24. | Camano | 204 | 31,955(0.64%)#24 | 944,917(0.02%)#687 |
| 25. | Kent | 196 | 31,955(0.61%)#25 | 944,917(0.02%)#714 |
| 26. | Olympia | 190 | 31,955(0.59%)#26 | 944,917(0.02%)#735 |
| 27. | Pullman | 187 | 31,955(0.59%)#27 | 944,917(0.02%)#752 |
| 28. | Federal Way | 179 | 31,955(0.56%)#28 | 944,917(0.02%)#782 |
| 29. | Lake Forest Park | 175 | 31,955(0.55%)#29 | 944,917(0.02%)#792 |
| 30. | Kennewick | 171 | 31,955(0.54%)#30 | 944,917(0.02%)#815 |
| 31. | Vashon | 161 | 31,955(0.50%)#31 | 944,917(0.02%)#884 |
| 32. | Snoqualmie | 156 | 31,955(0.49%)#32 | 944,917(0.02%)#921 |
| 33. | Anacortes | 155 | 31,955(0.49%)#33 | 944,917(0.02%)#926 |
| 34. | Lake Stevens | 154 | 31,955(0.48%)#34 | 944,917(0.02%)#933 |
| 35. | Spokane Valley | 153 | 31,955(0.48%)#35 | 944,917(0.02%)#940 |
| 36. | Enumclaw | 151 | 31,955(0.47%)#36 | 944,917(0.02%)#954 |
| 37. | Eastmont | 145 | 31,955(0.45%)#37 | 944,917(0.02%)#991 |
| 38. | Medina | 144 | 31,955(0.45%)#38 | 944,917(0.02%)#997 |
| 39. | Silver Firs | 141 | 31,955(0.44%)#39 | 944,917(0.01%)#1,021 |
| 40. | Hansville | 140 | 31,955(0.44%)#40 | 944,917(0.01%)#1,032 |
| 41. | Mill Creek East | 135 | 31,955(0.42%)#41 | 944,917(0.01%)#1,070 |
| 42. | Mukilteo | 135 | 31,955(0.42%)#42 | 944,917(0.01%)#1,071 |
| 43. | Lynnwood | 127 | 31,955(0.40%)#43 | 944,917(0.01%)#1,135 |
| 44. | Marysville | 125 | 31,955(0.39%)#44 | 944,917(0.01%)#1,150 |
| 45. | Lakewood | 125 | 31,955(0.39%)#45 | 944,917(0.01%)#1,152 |
| 46. | University Place | 124 | 31,955(0.39%)#46 | 944,917(0.01%)#1,165 |
| 47. | Bremerton | 123 | 31,955(0.38%)#47 | 944,917(0.01%)#1,173 |
| 48. | Burien | 122 | 31,955(0.38%)#48 | 944,917(0.01%)#1,177 |
| 49. | Lake Shore | 121 | 31,955(0.38%)#49 | 944,917(0.01%)#1,188 |
| 50. | Canterwood | 120 | 31,955(0.38%)#50 | 944,917(0.01%)#1,203 |
| 51. | Port Townsend | 119 | 31,955(0.37%)#51 | 944,917(0.01%)#1,214 |
| 52. | South Hill | 102 | 31,955(0.32%)#52 | 944,917(0.01%)#1,399 |
| 53. | Woodinville | 101 | 31,955(0.32%)#53 | 944,917(0.01%)#1,431 |
| 54. | Newcastle | 101 | 31,955(0.32%)#54 | 944,917(0.01%)#1,432 |
| 55. | Woods Creek | 101 | 31,955(0.32%)#55 | 944,917(0.01%)#1,436 |
| 56. | Coupeville | 100 | 31,955(0.31%)#56 | 944,917(0.01%)#1,449 |
| 57. | Tracyton | 99 | 31,955(0.31%)#57 | 944,917(0.01%)#1,460 |
| 58. | Maplewood | 97 | 31,955(0.30%)#58 | 944,917(0.01%)#1,496 |
| 59. | Covington | 96 | 31,955(0.30%)#59 | 944,917(0.01%)#1,508 |
| 60. | Ferndale | 95 | 31,955(0.30%)#60 | 944,917(0.01%)#1,532 |
| 61. | North Bend | 95 | 31,955(0.30%)#61 | 944,917(0.01%)#1,535 |
| 62. | Martha Lake | 94 | 31,955(0.29%)#62 | 944,917(0.01%)#1,542 |
| 63. | Gig Harbor | 93 | 31,955(0.29%)#63 | 944,917(0.01%)#1,556 |
| 64. | Felida | 93 | 31,955(0.29%)#64 | 944,917(0.01%)#1,558 |
| 65. | Parkland | 90 | 31,955(0.28%)#65 | 944,917(0.01%)#1,603 |
| 66. | Ocean Shores | 84 | 31,955(0.26%)#66 | 944,917(0.01%)#1,701 |
| 67. | Bothell West | 80 | 31,955(0.25%)#67 | 944,917(0.01%)#1,754 |
| 68. | Spanaway | 79 | 31,955(0.25%)#68 | 944,917(0.01%)#1,762 |
| 69. | Seatac | 78 | 31,955(0.24%)#69 | 944,917(0.01%)#1,783 |
| 70. | Silverdale | 78 | 31,955(0.24%)#70 | 944,917(0.01%)#1,789 |
| 71. | Lacey | 76 | 31,955(0.24%)#71 | 944,917(0.01%)#1,815 |
| 72. | Walla Walla | 76 | 31,955(0.24%)#72 | 944,917(0.01%)#1,819 |
| 73. | Longbranch | 73 | 31,955(0.23%)#73 | 944,917(0.01%)#1,885 |
| 74. | Puyallup | 72 | 31,955(0.23%)#74 | 944,917(0.01%)#1,892 |
| 75. | Auburn | 70 | 31,955(0.22%)#75 | 944,917(0.01%)#1,935 |
| 76. | Sultan | 69 | 31,955(0.22%)#76 | 944,917(0.01%)#1,977 |
| 77. | Chain Lake | 69 | 31,955(0.22%)#77 | 944,917(0.01%)#1,978 |
| 78. | Bryn Mawr Skyway | 68 | 31,955(0.21%)#78 | 944,917(0.01%)#1,991 |
| 79. | Lake Morton Berrydale | 67 | 31,955(0.21%)#79 | 944,917(0.01%)#2,012 |
| 80. | Otis Orchards East Farms | 67 | 31,955(0.21%)#80 | 944,917(0.01%)#2,015 |
| 81. | Birch Bay | 66 | 31,955(0.21%)#81 | 944,917(0.01%)#2,038 |
| 82. | Normandy Park | 66 | 31,955(0.21%)#82 | 944,917(0.01%)#2,045 |
| 83. | Salmon Creek | 62 | 31,955(0.19%)#83 | 944,917(0.01%)#2,133 |
| 84. | Yakima | 61 | 31,955(0.19%)#84 | 944,917(0.01%)#2,161 |
| 85. | Frederickson | 61 | 31,955(0.19%)#85 | 944,917(0.01%)#2,169 |
| 86. | Elk Plain | 60 | 31,955(0.19%)#86 | 944,917(0.01%)#2,203 |
| 87. | Picnic Point | 60 | 31,955(0.19%)#87 | 944,917(0.01%)#2,208 |
| 88. | Meadow Glade | 59 | 31,955(0.18%)#88 | 944,917(0.01%)#2,246 |
| 89. | Five Corners | 58 | 31,955(0.18%)#89 | 944,917(0.01%)#2,264 |
| 90. | Maple Valley | 57 | 31,955(0.18%)#90 | 944,917(0.01%)#2,292 |
| 91. | Maltby | 57 | 31,955(0.18%)#91 | 944,917(0.01%)#2,304 |
| 92. | Artondale | 54 | 31,955(0.17%)#92 | 944,917(0.01%)#2,397 |
| 93. | Moses Lake | 53 | 31,955(0.17%)#93 | 944,917(0.01%)#2,426 |
| 94. | Point Roberts | 53 | 31,955(0.17%)#94 | 944,917(0.01%)#2,451 |
| 95. | Fairwood Cdp King County | 51 | 31,955(0.16%)#95 | 944,917(0.01%)#2,509 |
| 96. | Tehaleh | 51 | 31,955(0.16%)#96 | 944,917(0.01%)#2,527 |
| 97. | Brier | 49 | 31,955(0.15%)#97 | 944,917(0.01%)#2,593 |
| 98. | Longview | 47 | 31,955(0.15%)#98 | 944,917(0.00%)#2,639 |
| 99. | Washougal | 47 | 31,955(0.15%)#99 | 944,917(0.00%)#2,649 |
| 100. | West Richland | 46 | 31,955(0.14%)#100 | 944,917(0.00%)#2,687 |
Common Questions
What are the Top 10 Cities with the Most Immigrants from Northern Europe in Washington?
Top 10 Cities with the Most Immigrants from Northern Europe in Washington are:
What city has the Most Immigrants from Northern Europe in Washington?
Seattle has the Most Immigrants from Northern Europe in Washington with 5,376.
What is the Total Immigrants from Northern Europe in the State of Washington?
Total Immigrants from Northern Europe in Washington is 31,955.
What is the Total Immigrants from Northern Europe in the United States?
Total Immigrants from Northern Europe in the United States is 944,917.