Cities with the Largest Iranian Community in Washington
RELATED REPORTS & OPTIONS
Iranian
Washington
Compare Cities
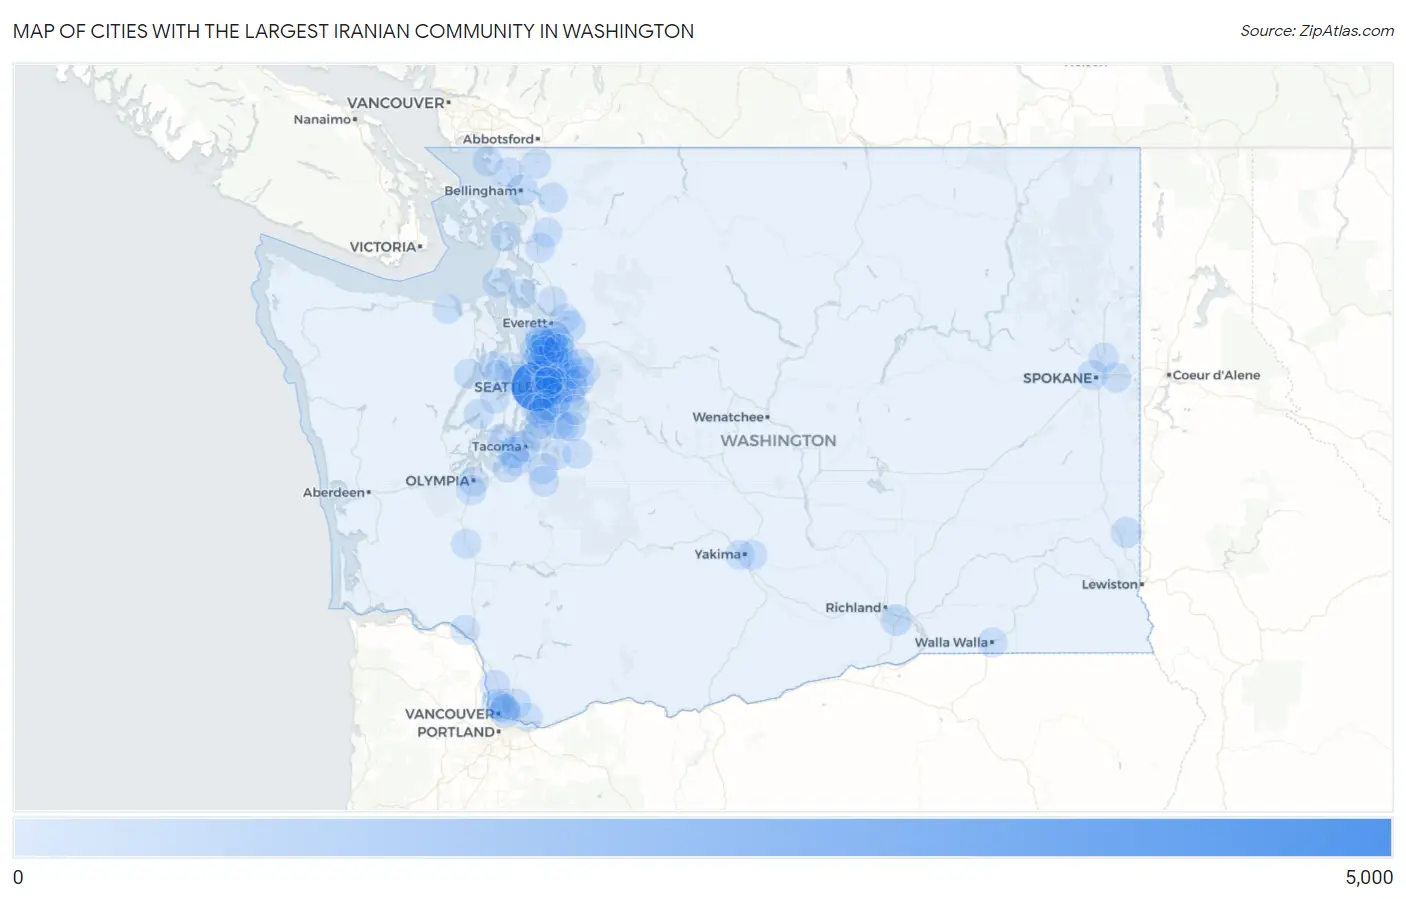
Map of Cities with the Largest Iranian Community in Washington
0
5,000
Cities with the Largest Iranian Community in Washington
| City | Iranian | vs State | vs National | |
| 1. | Seattle | 4,011 | 15,015(26.71%)#1 | 487,189(0.82%)#9 |
| 2. | Kirkland | 1,412 | 15,015(9.40%)#2 | 487,189(0.29%)#37 |
| 3. | Bellevue | 877 | 15,015(5.84%)#3 | 487,189(0.18%)#72 |
| 4. | Sammamish | 561 | 15,015(3.74%)#4 | 487,189(0.12%)#122 |
| 5. | Bothell | 508 | 15,015(3.38%)#5 | 487,189(0.10%)#138 |
| 6. | Redmond | 405 | 15,015(2.70%)#6 | 487,189(0.08%)#184 |
| 7. | Tacoma | 347 | 15,015(2.31%)#7 | 487,189(0.07%)#222 |
| 8. | Everett | 289 | 15,015(1.92%)#8 | 487,189(0.06%)#267 |
| 9. | Kenmore | 272 | 15,015(1.81%)#9 | 487,189(0.06%)#286 |
| 10. | Kennewick | 268 | 15,015(1.78%)#10 | 487,189(0.06%)#294 |
| 11. | University Place | 264 | 15,015(1.76%)#11 | 487,189(0.05%)#297 |
| 12. | Vancouver | 258 | 15,015(1.72%)#12 | 487,189(0.05%)#312 |
| 13. | Kent | 246 | 15,015(1.64%)#13 | 487,189(0.05%)#325 |
| 14. | Bellingham | 182 | 15,015(1.21%)#14 | 487,189(0.04%)#424 |
| 15. | Clyde Hill | 168 | 15,015(1.12%)#15 | 487,189(0.03%)#441 |
| 16. | Shoreline | 163 | 15,015(1.09%)#16 | 487,189(0.03%)#458 |
| 17. | Renton | 161 | 15,015(1.07%)#17 | 487,189(0.03%)#462 |
| 18. | Woodinville | 160 | 15,015(1.07%)#18 | 487,189(0.03%)#465 |
| 19. | Pullman | 159 | 15,015(1.06%)#19 | 487,189(0.03%)#467 |
| 20. | Martha Lake | 140 | 15,015(0.93%)#20 | 487,189(0.03%)#512 |
| 21. | Mercer Island | 135 | 15,015(0.90%)#21 | 487,189(0.03%)#534 |
| 22. | Silver Firs | 135 | 15,015(0.90%)#22 | 487,189(0.03%)#535 |
| 23. | Covington | 123 | 15,015(0.82%)#23 | 487,189(0.03%)#584 |
| 24. | Mukilteo | 122 | 15,015(0.81%)#24 | 487,189(0.03%)#591 |
| 25. | North Lynnwood | 118 | 15,015(0.79%)#25 | 487,189(0.02%)#612 |
| 26. | Burien | 116 | 15,015(0.77%)#26 | 487,189(0.02%)#618 |
| 27. | Bothell West | 109 | 15,015(0.73%)#27 | 487,189(0.02%)#644 |
| 28. | Maltby | 107 | 15,015(0.71%)#28 | 487,189(0.02%)#652 |
| 29. | Lynnwood | 103 | 15,015(0.69%)#29 | 487,189(0.02%)#666 |
| 30. | Issaquah | 102 | 15,015(0.68%)#30 | 487,189(0.02%)#672 |
| 31. | Spokane | 94 | 15,015(0.63%)#31 | 487,189(0.02%)#723 |
| 32. | Union Hill Novelty Hill | 85 | 15,015(0.57%)#32 | 487,189(0.02%)#785 |
| 33. | Mill Creek East | 84 | 15,015(0.56%)#33 | 487,189(0.02%)#791 |
| 34. | Bryn Mawr Skyway | 77 | 15,015(0.51%)#34 | 487,189(0.02%)#843 |
| 35. | Ridgefield | 76 | 15,015(0.51%)#35 | 487,189(0.02%)#847 |
| 36. | Federal Way | 74 | 15,015(0.49%)#36 | 487,189(0.02%)#854 |
| 37. | South Hill | 72 | 15,015(0.48%)#37 | 487,189(0.01%)#878 |
| 38. | Graham | 69 | 15,015(0.46%)#38 | 487,189(0.01%)#907 |
| 39. | Ferndale | 68 | 15,015(0.45%)#39 | 487,189(0.01%)#917 |
| 40. | Edmonds | 65 | 15,015(0.43%)#40 | 487,189(0.01%)#943 |
| 41. | Mill Creek | 64 | 15,015(0.43%)#41 | 487,189(0.01%)#952 |
| 42. | Cottage Lake | 63 | 15,015(0.42%)#42 | 487,189(0.01%)#960 |
| 43. | Maple Valley | 62 | 15,015(0.41%)#43 | 487,189(0.01%)#972 |
| 44. | Lake Shore | 59 | 15,015(0.39%)#44 | 487,189(0.01%)#1,011 |
| 45. | Acme | 59 | 15,015(0.39%)#45 | 487,189(0.01%)#1,014 |
| 46. | Bothell East | 57 | 15,015(0.38%)#46 | 487,189(0.01%)#1,035 |
| 47. | Mountlake Terrace | 56 | 15,015(0.37%)#47 | 487,189(0.01%)#1,047 |
| 48. | Lake Stickney | 54 | 15,015(0.36%)#48 | 487,189(0.01%)#1,073 |
| 49. | Artondale | 53 | 15,015(0.35%)#49 | 487,189(0.01%)#1,086 |
| 50. | Ames Lake | 51 | 15,015(0.34%)#50 | 487,189(0.01%)#1,114 |
| 51. | Hazel Dell | 49 | 15,015(0.33%)#51 | 487,189(0.01%)#1,136 |
| 52. | Orchards | 48 | 15,015(0.32%)#52 | 487,189(0.01%)#1,152 |
| 53. | Lake Stevens | 40 | 15,015(0.27%)#53 | 487,189(0.01%)#1,281 |
| 54. | Chehalis | 38 | 15,015(0.25%)#54 | 487,189(0.01%)#1,327 |
| 55. | Belfair | 38 | 15,015(0.25%)#55 | 487,189(0.01%)#1,331 |
| 56. | Newcastle | 35 | 15,015(0.23%)#56 | 487,189(0.01%)#1,392 |
| 57. | Yarrow Point | 35 | 15,015(0.23%)#57 | 487,189(0.01%)#1,401 |
| 58. | Eastmont | 33 | 15,015(0.22%)#58 | 487,189(0.01%)#1,437 |
| 59. | Lake Forest Park | 32 | 15,015(0.21%)#59 | 487,189(0.01%)#1,458 |
| 60. | Bangor Base | 32 | 15,015(0.21%)#60 | 487,189(0.01%)#1,464 |
| 61. | Terrace Heights | 29 | 15,015(0.19%)#61 | 487,189(0.01%)#1,531 |
| 62. | Lakewood | 27 | 15,015(0.18%)#62 | 487,189(0.01%)#1,582 |
| 63. | Seatac | 27 | 15,015(0.18%)#63 | 487,189(0.01%)#1,590 |
| 64. | Tukwila | 26 | 15,015(0.17%)#64 | 487,189(0.01%)#1,625 |
| 65. | Longview | 25 | 15,015(0.17%)#65 | 487,189(0.01%)#1,642 |
| 66. | Anacortes | 25 | 15,015(0.17%)#66 | 487,189(0.01%)#1,652 |
| 67. | Camas | 24 | 15,015(0.16%)#67 | 487,189(0.00%)#1,682 |
| 68. | Picnic Point | 24 | 15,015(0.16%)#68 | 487,189(0.00%)#1,688 |
| 69. | Sedro Woolley | 23 | 15,015(0.15%)#69 | 487,189(0.00%)#1,717 |
| 70. | Marysville | 21 | 15,015(0.14%)#70 | 487,189(0.00%)#1,765 |
| 71. | North Fort Lewis | 21 | 15,015(0.14%)#71 | 487,189(0.00%)#1,790 |
| 72. | Bonney Lake | 20 | 15,015(0.13%)#72 | 487,189(0.00%)#1,815 |
| 73. | Olympia | 18 | 15,015(0.12%)#73 | 487,189(0.00%)#1,870 |
| 74. | Alderwood Manor | 18 | 15,015(0.12%)#74 | 487,189(0.00%)#1,901 |
| 75. | Coupeville | 18 | 15,015(0.12%)#75 | 487,189(0.00%)#1,920 |
| 76. | Mount Vernon | 17 | 15,015(0.11%)#76 | 487,189(0.00%)#1,927 |
| 77. | Spokane Valley | 16 | 15,015(0.11%)#77 | 487,189(0.00%)#1,964 |
| 78. | Tehaleh | 16 | 15,015(0.11%)#78 | 487,189(0.00%)#1,992 |
| 79. | Lake Marcel Stillwater | 16 | 15,015(0.11%)#79 | 487,189(0.00%)#2,001 |
| 80. | Walla Walla | 15 | 15,015(0.10%)#80 | 487,189(0.00%)#2,022 |
| 81. | Des Moines | 15 | 15,015(0.10%)#81 | 487,189(0.00%)#2,023 |
| 82. | River Road | 14 | 15,015(0.09%)#82 | 487,189(0.00%)#2,114 |
| 83. | Medina | 13 | 15,015(0.09%)#83 | 487,189(0.00%)#2,156 |
| 84. | Brinnon | 13 | 15,015(0.09%)#84 | 487,189(0.00%)#2,166 |
| 85. | Bremerton | 12 | 15,015(0.08%)#85 | 487,189(0.00%)#2,176 |
| 86. | Fairwood Cdp King County | 12 | 15,015(0.08%)#86 | 487,189(0.00%)#2,197 |
| 87. | Clearview | 12 | 15,015(0.08%)#87 | 487,189(0.00%)#2,213 |
| 88. | Everson | 12 | 15,015(0.08%)#88 | 487,189(0.00%)#2,216 |
| 89. | Yakima | 11 | 15,015(0.07%)#89 | 487,189(0.00%)#2,225 |
| 90. | Minnehaha | 11 | 15,015(0.07%)#90 | 487,189(0.00%)#2,260 |
| 91. | Mead | 11 | 15,015(0.07%)#91 | 487,189(0.00%)#2,265 |
| 92. | Tumwater | 10 | 15,015(0.07%)#92 | 487,189(0.00%)#2,312 |
| 93. | Birch Bay | 10 | 15,015(0.07%)#93 | 487,189(0.00%)#2,337 |
| 94. | Suquamish | 10 | 15,015(0.07%)#94 | 487,189(0.00%)#2,356 |
| 95. | Mirrormont | 10 | 15,015(0.07%)#95 | 487,189(0.00%)#2,357 |
| 96. | Bainbridge Island | 9 | 15,015(0.06%)#96 | 487,189(0.00%)#2,394 |
| 97. | Camano | 9 | 15,015(0.06%)#97 | 487,189(0.00%)#2,404 |
| 98. | Enumclaw | 9 | 15,015(0.06%)#98 | 487,189(0.00%)#2,409 |
| 99. | Duvall | 9 | 15,015(0.06%)#99 | 487,189(0.00%)#2,422 |
| 100. | Silverdale | 8 | 15,015(0.05%)#100 | 487,189(0.00%)#2,478 |
Common Questions
What are the Top 10 Cities with the Largest Iranian Community in Washington?
Top 10 Cities with the Largest Iranian Community in Washington are:
What city has the Largest Iranian Community in Washington?
Seattle has the Largest Iranian Community in Washington with 4,011.
What is the Total Iranian Population in the State of Washington?
Total Iranian Population in Washington is 15,015.
What is the Total Iranian Population in the United States?
Total Iranian Population in the United States is 487,189.