Cities with the Highest Percentage of Immigrants from Eastern Europe in Washington
RELATED REPORTS & OPTIONS
Eastern Europe
Washington
Compare Cities
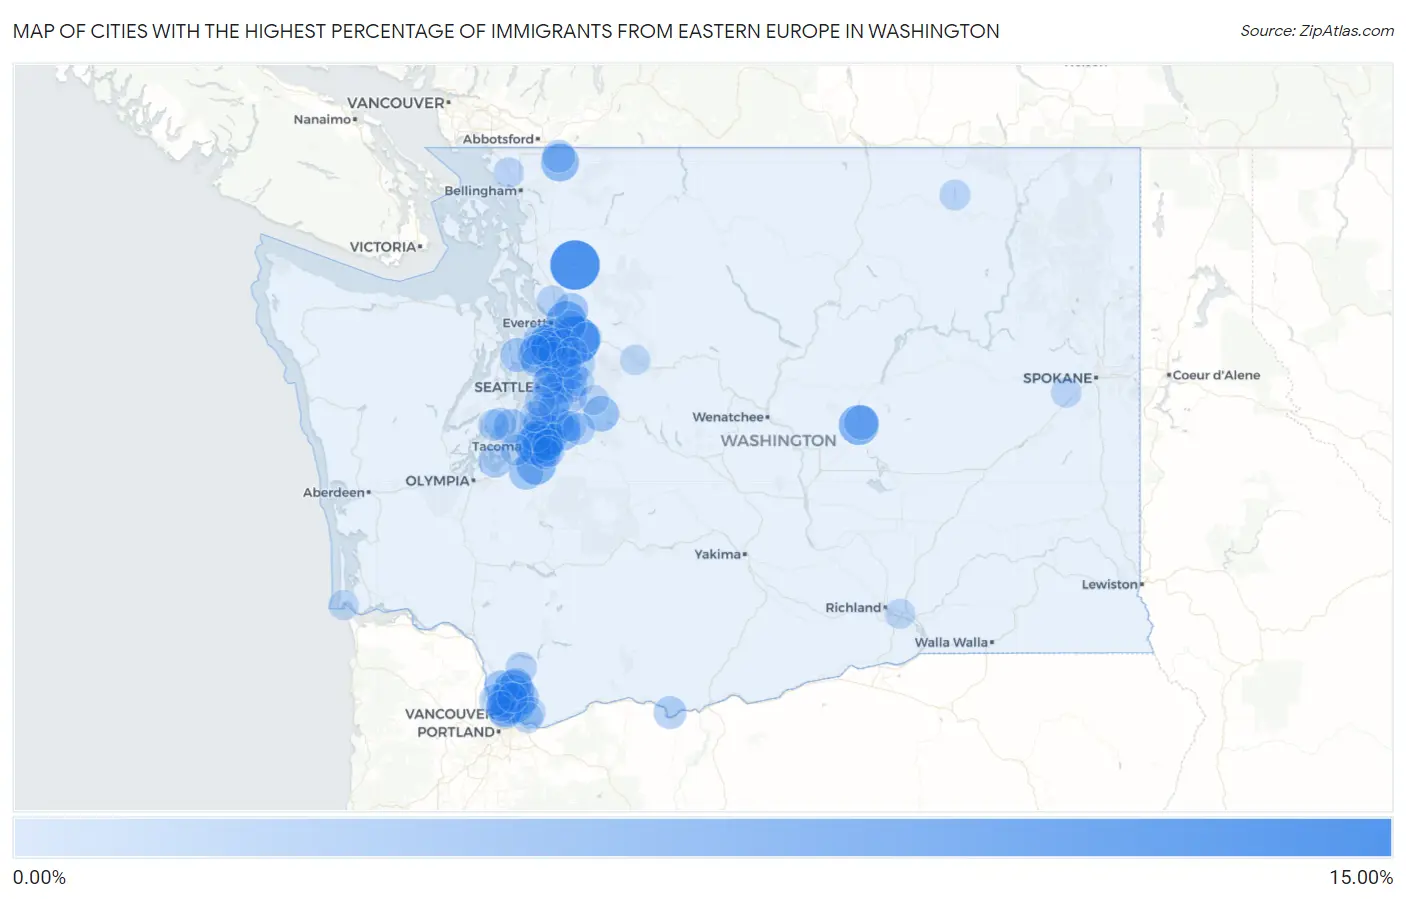
Map of Cities with the Highest Percentage of Immigrants from Eastern Europe in Washington
0.00%
15.00%
Cities with the Highest Percentage of Immigrants from Eastern Europe in Washington
| City | Eastern Europe | vs State | vs National | |
| 1. | Lake Cavanaugh | 11.73% | 1.25%(+10.5)#1 | 0.67%(+11.1)#58 |
| 2. | Monroe North | 10.59% | 1.25%(+9.34)#2 | 0.67%(+9.92)#70 |
| 3. | Fife Heights | 7.25% | 1.25%(+6.00)#3 | 0.67%(+6.58)#129 |
| 4. | Lakeland South | 6.72% | 1.25%(+5.47)#4 | 0.67%(+6.05)#147 |
| 5. | Battle Ground | 6.68% | 1.25%(+5.43)#5 | 0.67%(+6.01)#151 |
| 6. | Cavalero | 6.66% | 1.25%(+5.41)#6 | 0.67%(+5.99)#153 |
| 7. | Lakeview | 6.49% | 1.25%(+5.25)#7 | 0.67%(+5.83)#162 |
| 8. | Summit View | 6.15% | 1.25%(+4.90)#8 | 0.67%(+5.48)#181 |
| 9. | Kendall | 5.42% | 1.25%(+4.18)#9 | 0.67%(+4.76)#225 |
| 10. | Orchards | 5.10% | 1.25%(+3.85)#10 | 0.67%(+4.43)#258 |
| 11. | Five Corners | 4.88% | 1.25%(+3.63)#11 | 0.67%(+4.21)#281 |
| 12. | Meadow Glade | 4.69% | 1.25%(+3.44)#12 | 0.67%(+4.02)#298 |
| 13. | Esperance | 4.69% | 1.25%(+3.44)#13 | 0.67%(+4.02)#299 |
| 14. | Lake Morton Berrydale | 4.58% | 1.25%(+3.33)#14 | 0.67%(+3.91)#310 |
| 15. | Minnehaha | 4.35% | 1.25%(+3.10)#15 | 0.67%(+3.68)#335 |
| 16. | Martha Lake | 4.33% | 1.25%(+3.08)#16 | 0.67%(+3.66)#341 |
| 17. | Woodinville | 4.29% | 1.25%(+3.05)#17 | 0.67%(+3.63)#343 |
| 18. | Barberton | 4.25% | 1.25%(+3.01)#18 | 0.67%(+3.59)#348 |
| 19. | Lakeland North | 4.24% | 1.25%(+2.99)#19 | 0.67%(+3.57)#351 |
| 20. | Maltby | 4.23% | 1.25%(+2.98)#20 | 0.67%(+3.56)#353 |
| 21. | Wilderness Rim | 4.22% | 1.25%(+2.97)#21 | 0.67%(+3.55)#354 |
| 22. | Eastmont | 3.95% | 1.25%(+2.71)#22 | 0.67%(+3.29)#398 |
| 23. | Edgewood | 3.95% | 1.25%(+2.71)#23 | 0.67%(+3.29)#400 |
| 24. | Hockinson | 3.93% | 1.25%(+2.68)#24 | 0.67%(+3.26)#403 |
| 25. | Algona | 3.71% | 1.25%(+2.46)#25 | 0.67%(+3.04)#438 |
| 26. | Milton | 3.68% | 1.25%(+2.43)#26 | 0.67%(+3.01)#445 |
| 27. | Soap Lake | 3.63% | 1.25%(+2.38)#27 | 0.67%(+2.96)#455 |
| 28. | Maplewood | 3.61% | 1.25%(+2.36)#28 | 0.67%(+2.94)#462 |
| 29. | Spanaway | 3.60% | 1.25%(+2.35)#29 | 0.67%(+2.93)#466 |
| 30. | Redmond | 3.59% | 1.25%(+2.35)#30 | 0.67%(+2.93)#467 |
| 31. | Duluth | 3.59% | 1.25%(+2.35)#31 | 0.67%(+2.93)#468 |
| 32. | Kingston | 3.47% | 1.25%(+2.22)#32 | 0.67%(+2.80)#494 |
| 33. | Lochsloy | 3.36% | 1.25%(+2.11)#33 | 0.67%(+2.69)#513 |
| 34. | Issaquah | 3.21% | 1.25%(+1.96)#34 | 0.67%(+2.54)#545 |
| 35. | North Lynnwood | 3.10% | 1.25%(+1.86)#35 | 0.67%(+2.44)#572 |
| 36. | Des Moines | 3.08% | 1.25%(+1.83)#36 | 0.67%(+2.41)#582 |
| 37. | Bothell West | 2.99% | 1.25%(+1.74)#37 | 0.67%(+2.32)#602 |
| 38. | Picnic Point | 2.97% | 1.25%(+1.73)#38 | 0.67%(+2.31)#607 |
| 39. | Bellevue | 2.96% | 1.25%(+1.71)#39 | 0.67%(+2.29)#609 |
| 40. | Covington | 2.95% | 1.25%(+1.70)#40 | 0.67%(+2.28)#615 |
| 41. | Vancouver | 2.82% | 1.25%(+1.57)#41 | 0.67%(+2.15)#664 |
| 42. | Peaceful Valley | 2.80% | 1.25%(+1.55)#42 | 0.67%(+2.13)#671 |
| 43. | Anderson Island | 2.78% | 1.25%(+1.53)#43 | 0.67%(+2.11)#679 |
| 44. | Kent | 2.76% | 1.25%(+1.51)#44 | 0.67%(+2.09)#684 |
| 45. | Dallesport | 2.73% | 1.25%(+1.49)#45 | 0.67%(+2.07)#693 |
| 46. | Lake Stickney | 2.68% | 1.25%(+1.43)#46 | 0.67%(+2.01)#713 |
| 47. | Duvall | 2.62% | 1.25%(+1.37)#47 | 0.67%(+1.95)#743 |
| 48. | Wauna | 2.54% | 1.25%(+1.29)#48 | 0.67%(+1.87)#782 |
| 49. | Auburn | 2.48% | 1.25%(+1.23)#49 | 0.67%(+1.81)#813 |
| 50. | Clyde Hill | 2.48% | 1.25%(+1.23)#50 | 0.67%(+1.81)#814 |
| 51. | Fife | 2.44% | 1.25%(+1.20)#51 | 0.67%(+1.78)#836 |
| 52. | Ravensdale | 2.43% | 1.25%(+1.19)#52 | 0.67%(+1.77)#841 |
| 53. | Sammamish | 2.43% | 1.25%(+1.18)#53 | 0.67%(+1.76)#844 |
| 54. | Mercer Island | 2.36% | 1.25%(+1.12)#54 | 0.67%(+1.70)#876 |
| 55. | Kirkland | 2.35% | 1.25%(+1.10)#55 | 0.67%(+1.68)#885 |
| 56. | Lynnwood | 2.31% | 1.25%(+1.06)#56 | 0.67%(+1.64)#906 |
| 57. | Newcastle | 2.30% | 1.25%(+1.06)#57 | 0.67%(+1.64)#907 |
| 58. | Mill Creek | 2.30% | 1.25%(+1.06)#58 | 0.67%(+1.64)#909 |
| 59. | Everett | 2.28% | 1.25%(+1.03)#59 | 0.67%(+1.61)#925 |
| 60. | Cathcart | 2.23% | 1.25%(+0.986)#60 | 0.67%(+1.57)#949 |
| 61. | Alderwood Manor | 2.20% | 1.25%(+0.957)#61 | 0.67%(+1.54)#960 |
| 62. | North Puyallup | 2.20% | 1.25%(+0.955)#62 | 0.67%(+1.53)#963 |
| 63. | Felida | 2.20% | 1.25%(+0.949)#63 | 0.67%(+1.53)#965 |
| 64. | Tukwila | 2.19% | 1.25%(+0.941)#64 | 0.67%(+1.52)#970 |
| 65. | Lewisville | 2.18% | 1.25%(+0.936)#65 | 0.67%(+1.52)#975 |
| 66. | Fairwood Cdp King County | 2.15% | 1.25%(+0.902)#66 | 0.67%(+1.48)#994 |
| 67. | Federal Way | 2.10% | 1.25%(+0.856)#67 | 0.67%(+1.44)#1,025 |
| 68. | Marysville | 2.05% | 1.25%(+0.805)#68 | 0.67%(+1.39)#1,066 |
| 69. | Fircrest | 2.03% | 1.25%(+0.782)#69 | 0.67%(+1.36)#1,083 |
| 70. | Fern Prairie | 2.00% | 1.25%(+0.757)#70 | 0.67%(+1.34)#1,096 |
| 71. | Stansberry Lake | 1.99% | 1.25%(+0.742)#71 | 0.67%(+1.32)#1,105 |
| 72. | Camas | 1.98% | 1.25%(+0.731)#72 | 0.67%(+1.31)#1,110 |
| 73. | Amboy | 1.96% | 1.25%(+0.717)#73 | 0.67%(+1.30)#1,120 |
| 74. | Pacific | 1.96% | 1.25%(+0.711)#74 | 0.67%(+1.29)#1,127 |
| 75. | Sumner | 1.95% | 1.25%(+0.698)#75 | 0.67%(+1.28)#1,136 |
| 76. | Renton | 1.93% | 1.25%(+0.682)#76 | 0.67%(+1.26)#1,142 |
| 77. | Bothell | 1.92% | 1.25%(+0.671)#77 | 0.67%(+1.25)#1,155 |
| 78. | Clear Lake Cdp Skagit County | 1.87% | 1.25%(+0.626)#78 | 0.67%(+1.21)#1,195 |
| 79. | Shoreline | 1.87% | 1.25%(+0.624)#79 | 0.67%(+1.20)#1,198 |
| 80. | Bothell East | 1.86% | 1.25%(+0.617)#80 | 0.67%(+1.20)#1,204 |
| 81. | Normandy Park | 1.81% | 1.25%(+0.560)#81 | 0.67%(+1.14)#1,256 |
| 82. | Union Hill Novelty Hill | 1.80% | 1.25%(+0.557)#82 | 0.67%(+1.14)#1,261 |
| 83. | Woods Creek | 1.75% | 1.25%(+0.498)#83 | 0.67%(+1.08)#1,321 |
| 84. | Curlew Lake | 1.71% | 1.25%(+0.462)#84 | 0.67%(+1.04)#1,353 |
| 85. | Larch Way | 1.66% | 1.25%(+0.412)#85 | 0.67%(+0.992)#1,405 |
| 86. | Medical Lake | 1.59% | 1.25%(+0.342)#86 | 0.67%(+0.922)#1,496 |
| 87. | Hazel Dell | 1.58% | 1.25%(+0.333)#87 | 0.67%(+0.913)#1,507 |
| 88. | Medina | 1.57% | 1.25%(+0.327)#88 | 0.67%(+0.907)#1,515 |
| 89. | Maple Valley | 1.54% | 1.25%(+0.295)#89 | 0.67%(+0.875)#1,548 |
| 90. | Boulevard Park | 1.54% | 1.25%(+0.294)#90 | 0.67%(+0.874)#1,549 |
| 91. | Ames Lake | 1.53% | 1.25%(+0.287)#91 | 0.67%(+0.867)#1,557 |
| 92. | High Bridge | 1.53% | 1.25%(+0.285)#92 | 0.67%(+0.865)#1,559 |
| 93. | Ferndale | 1.53% | 1.25%(+0.280)#93 | 0.67%(+0.860)#1,566 |
| 94. | Brush Prairie | 1.49% | 1.25%(+0.240)#94 | 0.67%(+0.820)#1,627 |
| 95. | Edmonds | 1.48% | 1.25%(+0.230)#95 | 0.67%(+0.810)#1,635 |
| 96. | Ilwaco | 1.47% | 1.25%(+0.218)#96 | 0.67%(+0.798)#1,648 |
| 97. | Baring | 1.46% | 1.25%(+0.209)#97 | 0.67%(+0.789)#1,659 |
| 98. | Snoqualmie | 1.45% | 1.25%(+0.199)#98 | 0.67%(+0.779)#1,674 |
| 99. | Pasco | 1.44% | 1.25%(+0.193)#99 | 0.67%(+0.773)#1,683 |
| 100. | Cottage Lake | 1.44% | 1.25%(+0.190)#100 | 0.67%(+0.770)#1,685 |
Common Questions
What are the Top 10 Cities with the Highest Percentage of Immigrants from Eastern Europe in Washington?
Top 10 Cities with the Highest Percentage of Immigrants from Eastern Europe in Washington are:
#1
11.73%
#2
10.59%
#3
7.25%
#4
6.72%
#5
6.68%
#6
6.66%
#7
6.49%
#8
6.15%
#9
5.42%
#10
5.10%
What city has the Highest Percentage of Immigrants from Eastern Europe in Washington?
Lake Cavanaugh has the Highest Percentage of Immigrants from Eastern Europe in Washington with 11.73%.
What is the Percentage of Immigrants from Eastern Europe in the State of Washington?
Percentage of Immigrants from Eastern Europe in Washington is 1.25%.
What is the Percentage of Immigrants from Eastern Europe in the United States?
Percentage of Immigrants from Eastern Europe in the United States is 0.67%.