Cities with the Largest Belgian Community in Washington
RELATED REPORTS & OPTIONS
Belgian
Washington
Compare Cities
Map of Cities with the Largest Belgian Community in Washington
0
1,000
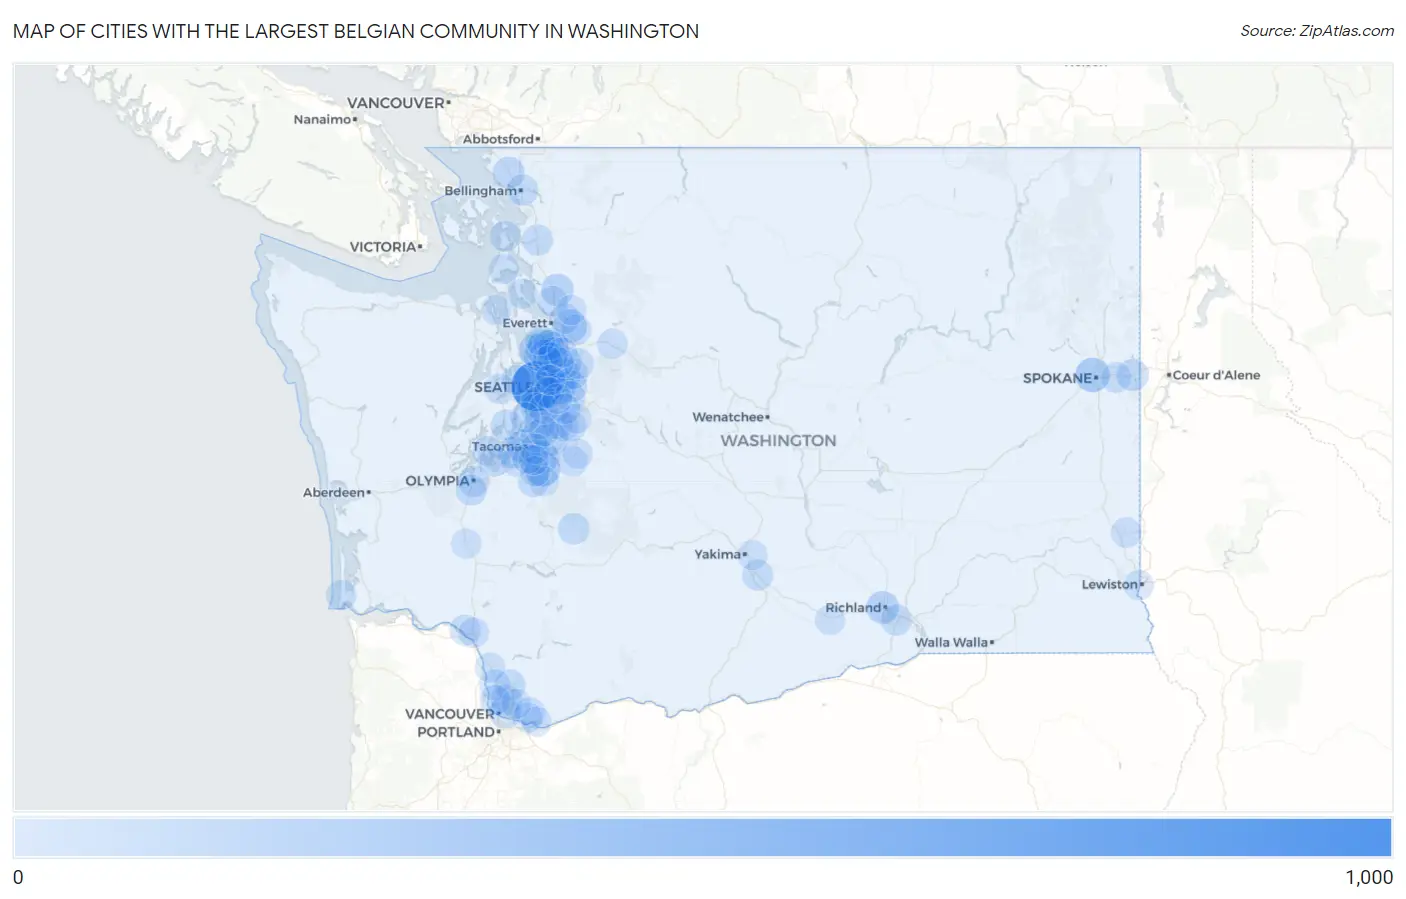
Cities with the Largest Belgian Community in Washington
| City | Belgian | vs State | vs National | |
| 1. | Seattle | 861 | 7,529(11.44%)#1 | 327,258(0.26%)#23 |
| 2. | South Hill | 244 | 7,529(3.24%)#2 | 327,258(0.07%)#135 |
| 3. | Spokane | 204 | 7,529(2.71%)#3 | 327,258(0.06%)#172 |
| 4. | Bellevue | 178 | 7,529(2.36%)#4 | 327,258(0.05%)#209 |
| 5. | Auburn | 173 | 7,529(2.30%)#5 | 327,258(0.05%)#215 |
| 6. | Tacoma | 163 | 7,529(2.16%)#6 | 327,258(0.05%)#238 |
| 7. | Everett | 152 | 7,529(2.02%)#7 | 327,258(0.05%)#262 |
| 8. | Mountlake Terrace | 133 | 7,529(1.77%)#8 | 327,258(0.04%)#307 |
| 9. | Redmond | 128 | 7,529(1.70%)#9 | 327,258(0.04%)#321 |
| 10. | Kirkland | 126 | 7,529(1.67%)#10 | 327,258(0.04%)#325 |
| 11. | Richland | 124 | 7,529(1.65%)#11 | 327,258(0.04%)#330 |
| 12. | Puyallup | 122 | 7,529(1.62%)#12 | 327,258(0.04%)#339 |
| 13. | Arlington | 113 | 7,529(1.50%)#13 | 327,258(0.03%)#376 |
| 14. | Edmonds | 107 | 7,529(1.42%)#14 | 327,258(0.03%)#403 |
| 15. | Burien | 86 | 7,529(1.14%)#15 | 327,258(0.03%)#539 |
| 16. | Vancouver | 85 | 7,529(1.13%)#16 | 327,258(0.03%)#544 |
| 17. | Liberty Lake | 84 | 7,529(1.12%)#17 | 327,258(0.03%)#557 |
| 18. | Ferndale | 81 | 7,529(1.08%)#18 | 327,258(0.02%)#581 |
| 19. | University Place | 79 | 7,529(1.05%)#19 | 327,258(0.02%)#602 |
| 20. | Sammamish | 77 | 7,529(1.02%)#20 | 327,258(0.02%)#620 |
| 21. | Federal Way | 75 | 7,529(1.00%)#21 | 327,258(0.02%)#642 |
| 22. | Elk Plain | 69 | 7,529(0.92%)#22 | 327,258(0.02%)#717 |
| 23. | Ashford | 69 | 7,529(0.92%)#23 | 327,258(0.02%)#720 |
| 24. | Union Hill Novelty Hill | 65 | 7,529(0.86%)#24 | 327,258(0.02%)#766 |
| 25. | Lynnwood | 63 | 7,529(0.84%)#25 | 327,258(0.02%)#799 |
| 26. | North Lynnwood | 63 | 7,529(0.84%)#26 | 327,258(0.02%)#801 |
| 27. | Bellingham | 60 | 7,529(0.80%)#27 | 327,258(0.02%)#840 |
| 28. | Mill Creek | 59 | 7,529(0.78%)#28 | 327,258(0.02%)#860 |
| 29. | Olympia | 58 | 7,529(0.77%)#29 | 327,258(0.02%)#866 |
| 30. | Kennewick | 55 | 7,529(0.73%)#30 | 327,258(0.02%)#920 |
| 31. | Mill Creek East | 55 | 7,529(0.73%)#31 | 327,258(0.02%)#931 |
| 32. | Donald | 55 | 7,529(0.73%)#32 | 327,258(0.02%)#939 |
| 33. | Burlington | 53 | 7,529(0.70%)#33 | 327,258(0.02%)#976 |
| 34. | Tumwater | 52 | 7,529(0.69%)#34 | 327,258(0.02%)#991 |
| 35. | Cherry Grove | 50 | 7,529(0.66%)#35 | 327,258(0.02%)#1,034 |
| 36. | Canterwood | 49 | 7,529(0.65%)#36 | 327,258(0.01%)#1,049 |
| 37. | White Center | 47 | 7,529(0.62%)#37 | 327,258(0.01%)#1,084 |
| 38. | Longview | 46 | 7,529(0.61%)#38 | 327,258(0.01%)#1,102 |
| 39. | Barberton | 46 | 7,529(0.61%)#39 | 327,258(0.01%)#1,113 |
| 40. | Cottage Lake | 42 | 7,529(0.56%)#40 | 327,258(0.01%)#1,207 |
| 41. | Renton | 41 | 7,529(0.54%)#41 | 327,258(0.01%)#1,226 |
| 42. | Anacortes | 40 | 7,529(0.53%)#42 | 327,258(0.01%)#1,264 |
| 43. | Ridgefield | 40 | 7,529(0.53%)#43 | 327,258(0.01%)#1,267 |
| 44. | Bothell East | 37 | 7,529(0.49%)#44 | 327,258(0.01%)#1,354 |
| 45. | Marysville | 36 | 7,529(0.48%)#45 | 327,258(0.01%)#1,374 |
| 46. | Fairwood Cdp Spokane County | 35 | 7,529(0.46%)#46 | 327,258(0.01%)#1,422 |
| 47. | Brier | 35 | 7,529(0.46%)#47 | 327,258(0.01%)#1,429 |
| 48. | Kent | 34 | 7,529(0.45%)#48 | 327,258(0.01%)#1,439 |
| 49. | Rocky Point | 34 | 7,529(0.45%)#49 | 327,258(0.01%)#1,477 |
| 50. | Three Lakes | 33 | 7,529(0.44%)#50 | 327,258(0.01%)#1,510 |
| 51. | Des Moines | 32 | 7,529(0.43%)#51 | 327,258(0.01%)#1,529 |
| 52. | Mercer Island | 32 | 7,529(0.43%)#52 | 327,258(0.01%)#1,531 |
| 53. | Spokane Valley | 31 | 7,529(0.41%)#53 | 327,258(0.01%)#1,562 |
| 54. | Covington | 31 | 7,529(0.41%)#54 | 327,258(0.01%)#1,578 |
| 55. | Lakewood | 30 | 7,529(0.40%)#55 | 327,258(0.01%)#1,604 |
| 56. | Buckley | 30 | 7,529(0.40%)#56 | 327,258(0.01%)#1,636 |
| 57. | Lake Stevens | 29 | 7,529(0.39%)#57 | 327,258(0.01%)#1,657 |
| 58. | Pullman | 28 | 7,529(0.37%)#58 | 327,258(0.01%)#1,695 |
| 59. | Felida | 28 | 7,529(0.37%)#59 | 327,258(0.01%)#1,711 |
| 60. | Issaquah | 25 | 7,529(0.33%)#60 | 327,258(0.01%)#1,828 |
| 61. | Duvall | 25 | 7,529(0.33%)#61 | 327,258(0.01%)#1,852 |
| 62. | Maple Valley | 24 | 7,529(0.32%)#62 | 327,258(0.01%)#1,884 |
| 63. | May Creek | 24 | 7,529(0.32%)#63 | 327,258(0.01%)#1,930 |
| 64. | Lakeland North | 23 | 7,529(0.31%)#64 | 327,258(0.01%)#1,953 |
| 65. | Fern Prairie | 23 | 7,529(0.31%)#65 | 327,258(0.01%)#1,988 |
| 66. | Anderson Island | 23 | 7,529(0.31%)#66 | 327,258(0.01%)#1,990 |
| 67. | Martha Lake | 22 | 7,529(0.29%)#67 | 327,258(0.01%)#2,012 |
| 68. | Longbranch | 22 | 7,529(0.29%)#68 | 327,258(0.01%)#2,044 |
| 69. | Long Beach | 22 | 7,529(0.29%)#69 | 327,258(0.01%)#2,057 |
| 70. | Woodinville | 20 | 7,529(0.27%)#70 | 327,258(0.01%)#2,142 |
| 71. | Kelso | 20 | 7,529(0.27%)#71 | 327,258(0.01%)#2,144 |
| 72. | East Renton Highlands | 20 | 7,529(0.27%)#72 | 327,258(0.01%)#2,146 |
| 73. | Camas | 18 | 7,529(0.24%)#73 | 327,258(0.01%)#2,296 |
| 74. | Oak Harbor | 18 | 7,529(0.24%)#74 | 327,258(0.01%)#2,297 |
| 75. | Enumclaw | 18 | 7,529(0.24%)#75 | 327,258(0.01%)#2,315 |
| 76. | Marrowstone | 18 | 7,529(0.24%)#76 | 327,258(0.01%)#2,360 |
| 77. | Bothell | 17 | 7,529(0.23%)#77 | 327,258(0.01%)#2,375 |
| 78. | Graham | 17 | 7,529(0.23%)#78 | 327,258(0.01%)#2,382 |
| 79. | Fife | 17 | 7,529(0.23%)#79 | 327,258(0.01%)#2,409 |
| 80. | Bainbridge Island | 16 | 7,529(0.21%)#80 | 327,258(0.00%)#2,472 |
| 81. | Chehalis | 16 | 7,529(0.21%)#81 | 327,258(0.00%)#2,508 |
| 82. | Kenmore | 14 | 7,529(0.19%)#82 | 327,258(0.00%)#2,683 |
| 83. | Tukwila | 14 | 7,529(0.19%)#83 | 327,258(0.00%)#2,687 |
| 84. | Washougal | 14 | 7,529(0.19%)#84 | 327,258(0.00%)#2,698 |
| 85. | Vashon | 14 | 7,529(0.19%)#85 | 327,258(0.00%)#2,714 |
| 86. | Picnic Point | 14 | 7,529(0.19%)#86 | 327,258(0.00%)#2,716 |
| 87. | Terrace Heights | 14 | 7,529(0.19%)#87 | 327,258(0.00%)#2,717 |
| 88. | Clarkston | 14 | 7,529(0.19%)#88 | 327,258(0.00%)#2,724 |
| 89. | Woodland | 14 | 7,529(0.19%)#89 | 327,258(0.00%)#2,725 |
| 90. | Lochsloy | 14 | 7,529(0.19%)#90 | 327,258(0.00%)#2,749 |
| 91. | Newcastle | 13 | 7,529(0.17%)#91 | 327,258(0.00%)#2,830 |
| 92. | Maltby | 13 | 7,529(0.17%)#92 | 327,258(0.00%)#2,835 |
| 93. | Yarrow Point | 13 | 7,529(0.17%)#93 | 327,258(0.00%)#2,898 |
| 94. | Orchards | 12 | 7,529(0.16%)#94 | 327,258(0.00%)#2,931 |
| 95. | Frederickson | 12 | 7,529(0.16%)#95 | 327,258(0.00%)#2,936 |
| 96. | Camano | 12 | 7,529(0.16%)#96 | 327,258(0.00%)#2,943 |
| 97. | Midland | 12 | 7,529(0.16%)#97 | 327,258(0.00%)#2,966 |
| 98. | Summit | 12 | 7,529(0.16%)#98 | 327,258(0.00%)#2,967 |
| 99. | Hobart | 12 | 7,529(0.16%)#99 | 327,258(0.00%)#2,980 |
| 100. | Prosser | 12 | 7,529(0.16%)#100 | 327,258(0.00%)#2,984 |
Common Questions
What are the Top 10 Cities with the Largest Belgian Community in Washington?
Top 10 Cities with the Largest Belgian Community in Washington are:
#1
861
#2
244
#3
204
#4
178
#5
173
#6
163
#7
152
#8
133
#9
128
#10
126
What city has the Largest Belgian Community in Washington?
Seattle has the Largest Belgian Community in Washington with 861.
What is the Total Belgian Population in the State of Washington?
Total Belgian Population in Washington is 7,529.
What is the Total Belgian Population in the United States?
Total Belgian Population in the United States is 327,258.