Summit View, WA Map & Demographics
Summit View Map
Summit View Overview
$43,501
PER CAPITA INCOME
$114,926
AVG FAMILY INCOME
$98,717
AVG HOUSEHOLD INCOME
37.9%
WAGE / INCOME GAP [ % ]
62.1¢/ $1
WAGE / INCOME GAP [ $ ]
0.39
INEQUALITY / GINI INDEX
8,748
TOTAL POPULATION
4,250
MALE POPULATION
4,498
FEMALE POPULATION
94.49
MALES / 100 FEMALES
105.84
FEMALES / 100 MALES
33.5
MEDIAN AGE
3.2
AVG FAMILY SIZE
2.7
AVG HOUSEHOLD SIZE
5,356
LABOR FORCE [ PEOPLE ]
75.6%
PERCENT IN LABOR FORCE
6.8%
UNEMPLOYMENT RATE
Income in Summit View
Income Overview in Summit View
Per Capita Income in Summit View is $43,501, while median incomes of families and households are $114,926 and $98,717 respectively.
| Characteristic | Number | Measure |
| Per Capita Income | 8,748 | $43,501 |
| Median Family Income | 2,009 | $114,926 |
| Mean Family Income | 2,009 | $137,689 |
| Median Household Income | 3,200 | $98,717 |
| Mean Household Income | 3,200 | $121,026 |
| Income Deficit | 2,009 | $0 |
| Wage / Income Gap (%) | 8,748 | 37.89% |
| Wage / Income Gap ($) | 8,748 | 62.11¢ per $1 |
| Gini / Inequality Index | 8,748 | 0.39 |
Earnings by Sex in Summit View
Average Earnings in Summit View are $45,812, $56,976 for men and $35,386 for women, a difference of 37.9%.
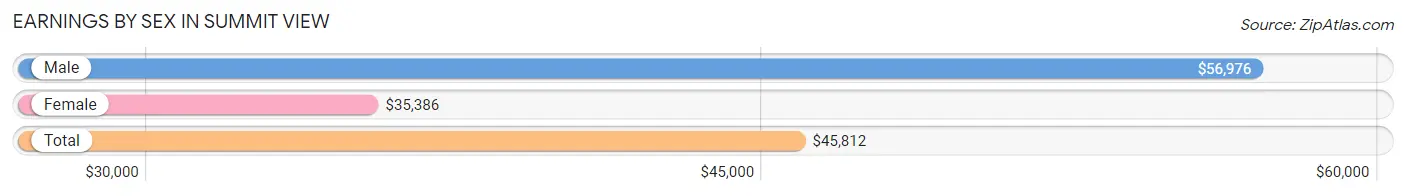
| Sex | Number | Average Earnings |
| Male | 2,749 (51.8%) | $56,976 |
| Female | 2,562 (48.2%) | $35,386 |
| Total | 5,311 (100.0%) | $45,812 |
Earnings by Sex by Income Bracket in Summit View
The most common earnings brackets in Summit View are $100,000+ for men (535 | 19.5%) and $30,000 to $34,999 for women (415 | 16.2%).
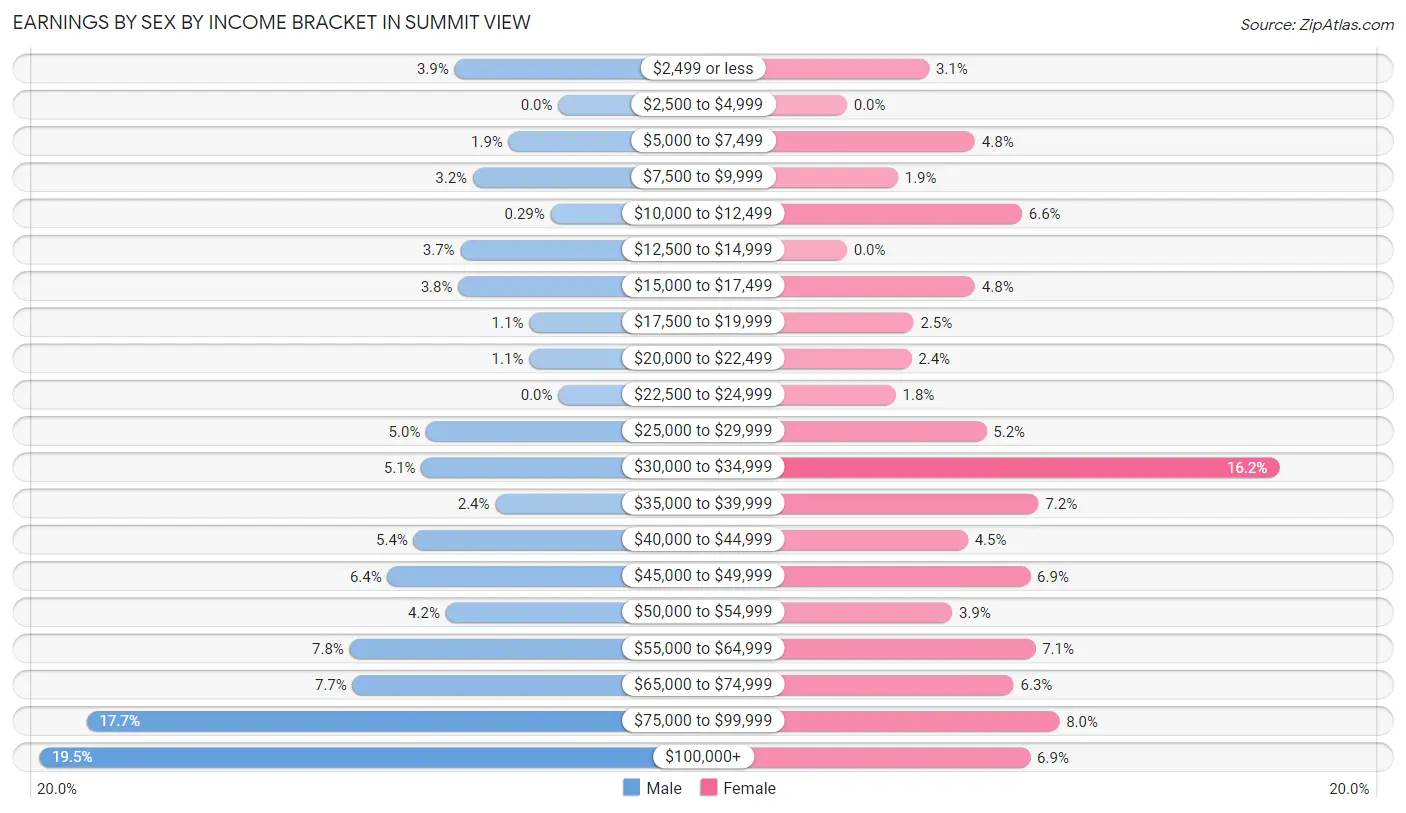
| Income | Male | Female |
| $2,499 or less | 107 (3.9%) | 79 (3.1%) |
| $2,500 to $4,999 | 0 (0.0%) | 0 (0.0%) |
| $5,000 to $7,499 | 51 (1.9%) | 123 (4.8%) |
| $7,500 to $9,999 | 88 (3.2%) | 49 (1.9%) |
| $10,000 to $12,499 | 8 (0.3%) | 168 (6.6%) |
| $12,500 to $14,999 | 101 (3.7%) | 0 (0.0%) |
| $15,000 to $17,499 | 103 (3.7%) | 123 (4.8%) |
| $17,500 to $19,999 | 30 (1.1%) | 64 (2.5%) |
| $20,000 to $22,499 | 30 (1.1%) | 62 (2.4%) |
| $22,500 to $24,999 | 0 (0.0%) | 47 (1.8%) |
| $25,000 to $29,999 | 136 (5.0%) | 134 (5.2%) |
| $30,000 to $34,999 | 141 (5.1%) | 415 (16.2%) |
| $35,000 to $39,999 | 65 (2.4%) | 184 (7.2%) |
| $40,000 to $44,999 | 149 (5.4%) | 116 (4.5%) |
| $45,000 to $49,999 | 176 (6.4%) | 176 (6.9%) |
| $50,000 to $54,999 | 116 (4.2%) | 101 (3.9%) |
| $55,000 to $64,999 | 215 (7.8%) | 181 (7.1%) |
| $65,000 to $74,999 | 212 (7.7%) | 160 (6.2%) |
| $75,000 to $99,999 | 486 (17.7%) | 204 (8.0%) |
| $100,000+ | 535 (19.5%) | 176 (6.9%) |
| Total | 2,749 (100.0%) | 2,562 (100.0%) |
Earnings by Sex by Educational Attainment in Summit View
Average earnings in Summit View are $66,806 for men and $37,035 for women, a difference of 44.6%. Men with an educational attainment of graduate degree enjoy the highest average annual earnings of $172,536, while those with college or associate's degree education earn the least with $54,976. Women with an educational attainment of bachelor's degree earn the most with the average annual earnings of $62,143, while those with less than high school education have the smallest earnings of $16,458.
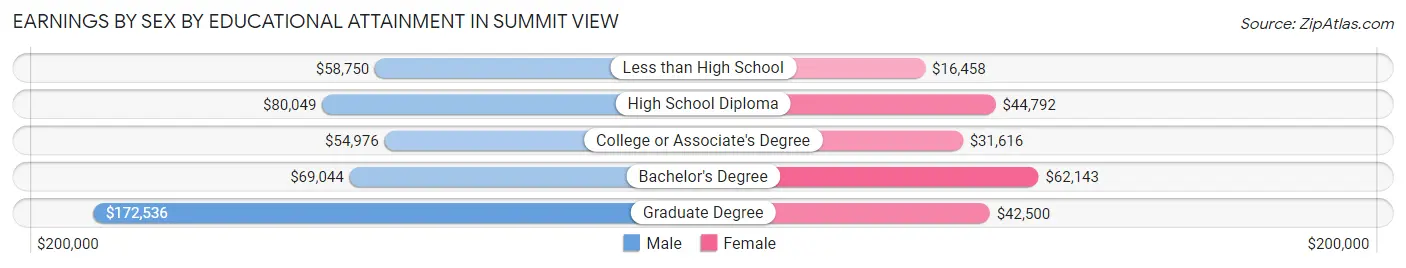
| Educational Attainment | Male Income | Female Income |
| Less than High School | $58,750 | $16,458 |
| High School Diploma | $80,049 | $44,792 |
| College or Associate's Degree | $54,976 | $31,616 |
| Bachelor's Degree | $69,044 | $62,143 |
| Graduate Degree | $172,536 | $42,500 |
| Total | $66,806 | $37,035 |
Family Income in Summit View
Family Income Brackets in Summit View
According to the Summit View family income data, there are 486 families falling into the $100,000 to $149,999 income range, which is the most common income bracket and makes up 24.2% of all families. Conversely, the $15,000 to $24,999 income bracket is the least frequent group with only 18 families (0.9%) belonging to this category.
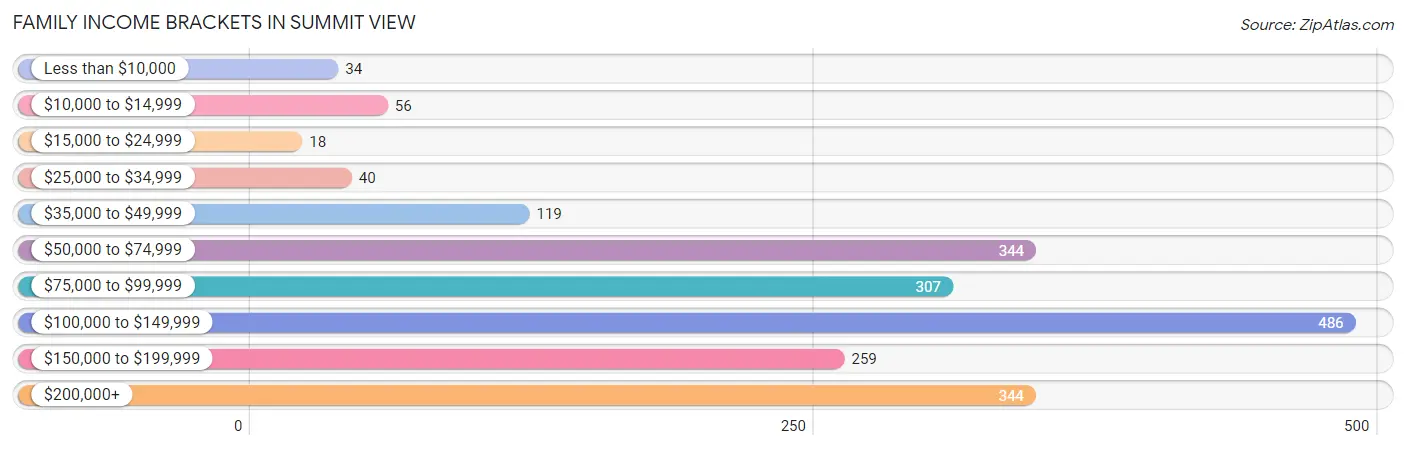
| Income Bracket | # Families | % Families |
| Less than $10,000 | 34 | 1.7% |
| $10,000 to $14,999 | 56 | 2.8% |
| $15,000 to $24,999 | 18 | 0.9% |
| $25,000 to $34,999 | 40 | 2.0% |
| $35,000 to $49,999 | 119 | 5.9% |
| $50,000 to $74,999 | 344 | 17.1% |
| $75,000 to $99,999 | 307 | 15.3% |
| $100,000 to $149,999 | 486 | 24.2% |
| $150,000 to $199,999 | 259 | 12.9% |
| $200,000+ | 344 | 17.1% |
Family Income by Famaliy Size in Summit View
7+ person families (52 | 2.6%) account for the highest median family income in Summit View with $197,292 per family, while 4-person families (290 | 14.4%) have the highest median income of $45,823 per family member.
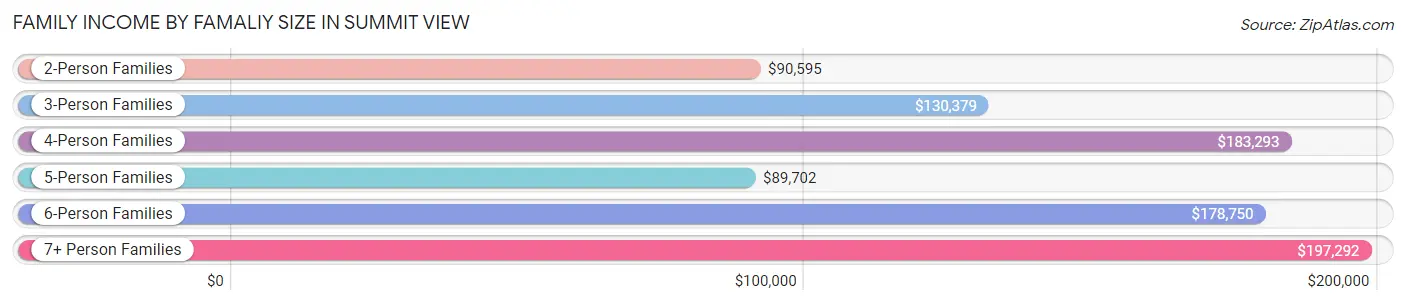
| Income Bracket | # Families | Median Income |
| 2-Person Families | 786 (39.1%) | $90,595 |
| 3-Person Families | 573 (28.5%) | $130,379 |
| 4-Person Families | 290 (14.4%) | $183,293 |
| 5-Person Families | 273 (13.6%) | $89,702 |
| 6-Person Families | 35 (1.7%) | $178,750 |
| 7+ Person Families | 52 (2.6%) | $197,292 |
| Total | 2,009 (100.0%) | $114,926 |
Family Income by Number of Earners in Summit View
The median family income in Summit View is $114,926, with families comprising 3+ earners (333) having the highest median family income of $161,375, while families with no earners (209) have the lowest median family income of $49,485, accounting for 16.6% and 10.4% of families, respectively.

| Number of Earners | # Families | Median Income |
| No Earners | 209 (10.4%) | $49,485 |
| 1 Earner | 555 (27.6%) | $86,719 |
| 2 Earners | 912 (45.4%) | $121,359 |
| 3+ Earners | 333 (16.6%) | $161,375 |
| Total | 2,009 (100.0%) | $114,926 |
Household Income in Summit View
Household Income Brackets in Summit View
With 685 households falling in the category, the $100,000 to $149,999 income range is the most frequent in Summit View, accounting for 21.4% of all households. In contrast, only 35 households (1.1%) fall into the $15,000 to $24,999 income bracket, making it the least populous group.
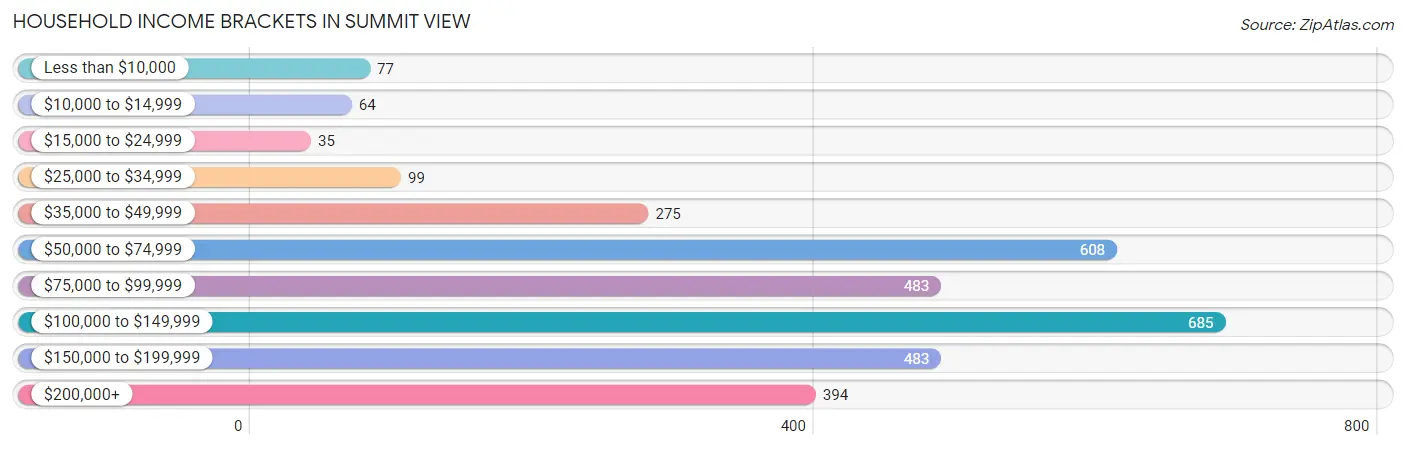
| Income Bracket | # Households | % Households |
| Less than $10,000 | 77 | 2.4% |
| $10,000 to $14,999 | 64 | 2.0% |
| $15,000 to $24,999 | 35 | 1.1% |
| $25,000 to $34,999 | 99 | 3.1% |
| $35,000 to $49,999 | 275 | 8.6% |
| $50,000 to $74,999 | 608 | 19.0% |
| $75,000 to $99,999 | 483 | 15.1% |
| $100,000 to $149,999 | 685 | 21.4% |
| $150,000 to $199,999 | 483 | 15.1% |
| $200,000+ | 394 | 12.3% |
Household Income by Householder Age in Summit View
The median household income in Summit View is $98,717, with the highest median household income of $146,490 found in the 25 to 44 years age bracket for the primary householder. A total of 1,394 households (43.6%) fall into this category. Meanwhile, the 15 to 24 years age bracket for the primary householder has the lowest median household income of $61,685, with 245 households (7.7%) in this group.
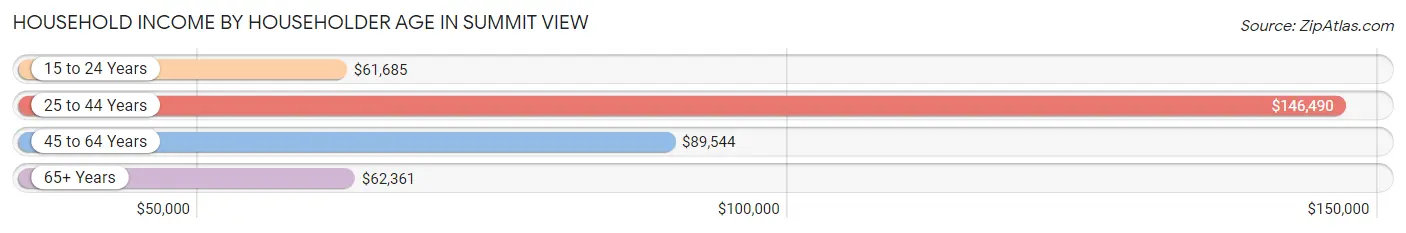
| Income Bracket | # Households | Median Income |
| 15 to 24 Years | 245 (7.7%) | $61,685 |
| 25 to 44 Years | 1,394 (43.6%) | $146,490 |
| 45 to 64 Years | 1,117 (34.9%) | $89,544 |
| 65+ Years | 444 (13.9%) | $62,361 |
| Total | 3,200 (100.0%) | $98,717 |
Poverty in Summit View
Income Below Poverty by Sex and Age in Summit View
With 10.4% poverty level for males and 5.7% for females among the residents of Summit View, 12 to 14 year old males and 6 to 11 year old females are the most vulnerable to poverty, with 45 males (29.2%) and 59 females (21.5%) in their respective age groups living below the poverty level.
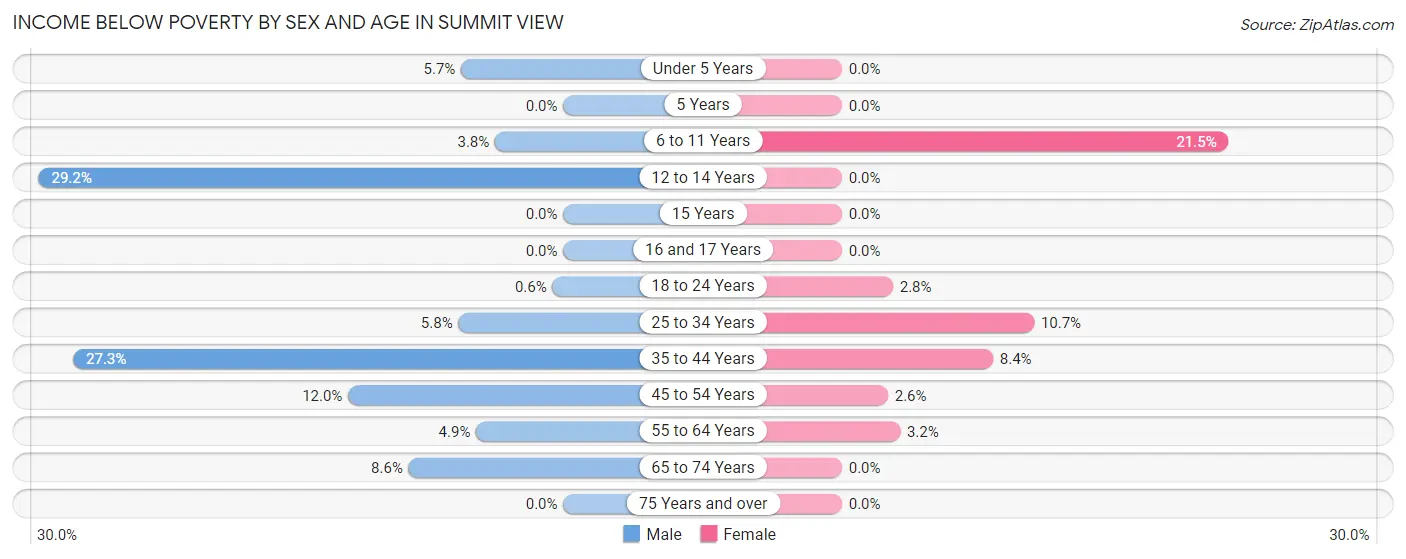
| Age Bracket | Male | Female |
| Under 5 Years | 14 (5.7%) | 0 (0.0%) |
| 5 Years | 0 (0.0%) | 0 (0.0%) |
| 6 to 11 Years | 13 (3.8%) | 59 (21.5%) |
| 12 to 14 Years | 45 (29.2%) | 0 (0.0%) |
| 15 Years | 0 (0.0%) | 0 (0.0%) |
| 16 and 17 Years | 0 (0.0%) | 0 (0.0%) |
| 18 to 24 Years | 3 (0.6%) | 15 (2.8%) |
| 25 to 34 Years | 50 (5.8%) | 90 (10.7%) |
| 35 to 44 Years | 205 (27.3%) | 66 (8.4%) |
| 45 to 54 Years | 69 (12.0%) | 9 (2.6%) |
| 55 to 64 Years | 19 (4.9%) | 18 (3.2%) |
| 65 to 74 Years | 18 (8.6%) | 0 (0.0%) |
| 75 Years and over | 0 (0.0%) | 0 (0.0%) |
| Total | 436 (10.4%) | 257 (5.7%) |
Income Above Poverty by Sex and Age in Summit View
According to the poverty statistics in Summit View, males aged 15 years and females aged under 5 years are the age groups that are most secure financially, with 100.0% of males and 100.0% of females in these age groups living above the poverty line.
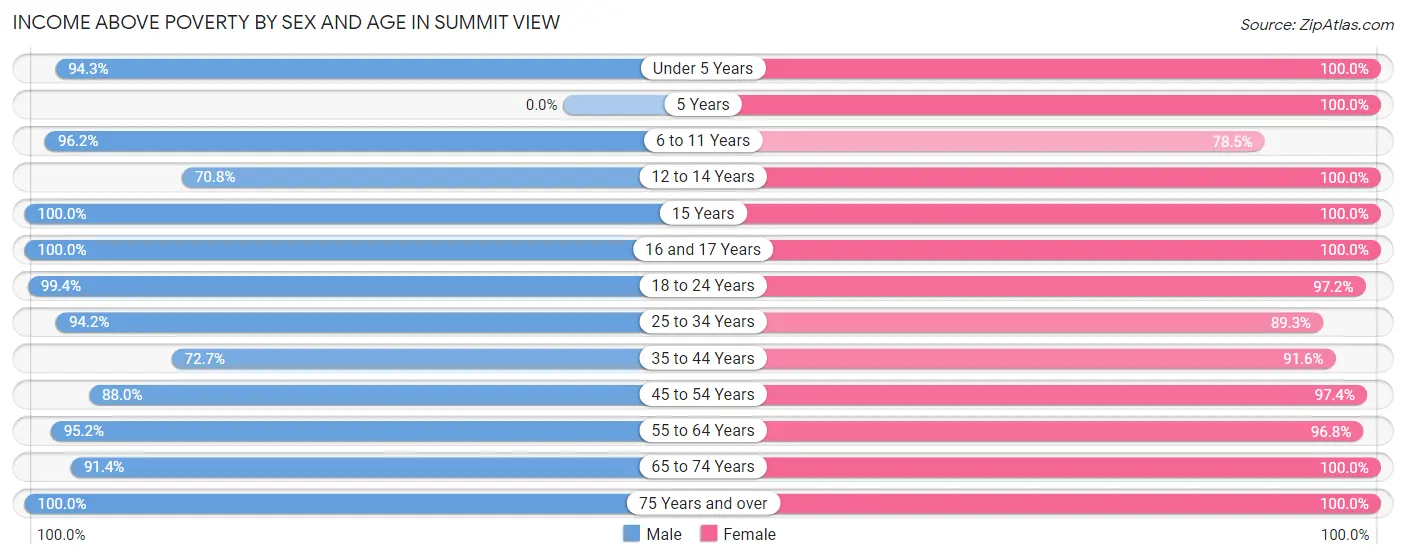
| Age Bracket | Male | Female |
| Under 5 Years | 232 (94.3%) | 281 (100.0%) |
| 5 Years | 0 (0.0%) | 77 (100.0%) |
| 6 to 11 Years | 329 (96.2%) | 215 (78.5%) |
| 12 to 14 Years | 109 (70.8%) | 136 (100.0%) |
| 15 Years | 56 (100.0%) | 52 (100.0%) |
| 16 and 17 Years | 47 (100.0%) | 121 (100.0%) |
| 18 to 24 Years | 493 (99.4%) | 513 (97.2%) |
| 25 to 34 Years | 806 (94.2%) | 751 (89.3%) |
| 35 to 44 Years | 546 (72.7%) | 719 (91.6%) |
| 45 to 54 Years | 507 (88.0%) | 343 (97.4%) |
| 55 to 64 Years | 373 (95.2%) | 538 (96.8%) |
| 65 to 74 Years | 191 (91.4%) | 288 (100.0%) |
| 75 Years and over | 80 (100.0%) | 207 (100.0%) |
| Total | 3,769 (89.6%) | 4,241 (94.3%) |
Income Below Poverty Among Married-Couple Families in Summit View
The poverty statistics for married-couple families in Summit View show that 4.4% or 73 of the total 1,645 families live below the poverty line. Families with 1 or 2 children have the highest poverty rate of 10.1%, comprising of 57 families. On the other hand, families with 3 or 4 children have the lowest poverty rate of 0.0%, which includes 0 families.
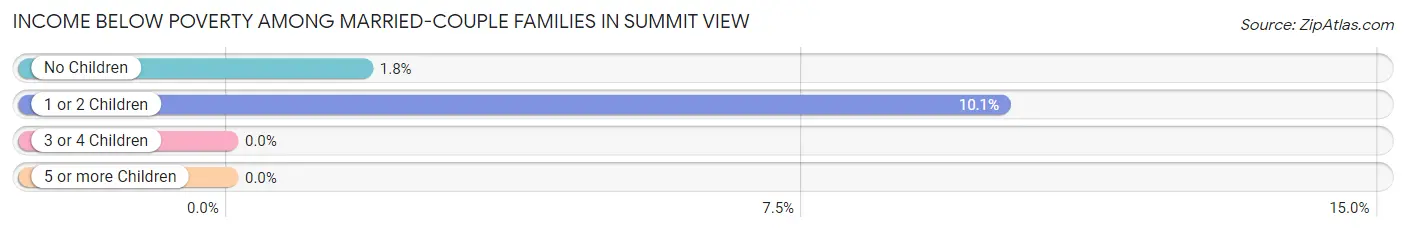
| Children | Above Poverty | Below Poverty |
| No Children | 892 (98.2%) | 16 (1.8%) |
| 1 or 2 Children | 508 (89.9%) | 57 (10.1%) |
| 3 or 4 Children | 135 (100.0%) | 0 (0.0%) |
| 5 or more Children | 37 (100.0%) | 0 (0.0%) |
| Total | 1,572 (95.6%) | 73 (4.4%) |
Income Below Poverty Among Single-Parent Households in Summit View
According to the poverty data in Summit View, 15.4% or 19 single-father households and 8.7% or 21 single-mother households are living below the poverty line. Among single-father households, those with 1 or 2 children have the highest poverty rate, with 19 households (26.4%) experiencing poverty. Likewise, among single-mother households, those with 1 or 2 children have the highest poverty rate, with 12 households (12.1%) falling below the poverty line.
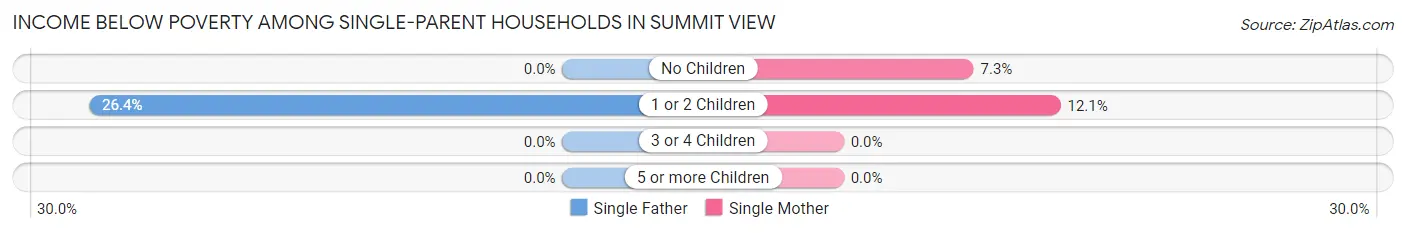
| Children | Single Father | Single Mother |
| No Children | 0 (0.0%) | 9 (7.3%) |
| 1 or 2 Children | 19 (26.4%) | 12 (12.1%) |
| 3 or 4 Children | 0 (0.0%) | 0 (0.0%) |
| 5 or more Children | 0 (0.0%) | 0 (0.0%) |
| Total | 19 (15.4%) | 21 (8.7%) |
Income Below Poverty Among Married-Couple vs Single-Parent Households in Summit View
The poverty data for Summit View shows that 73 of the married-couple family households (4.4%) and 40 of the single-parent households (11.0%) are living below the poverty level. Within the married-couple family households, those with 1 or 2 children have the highest poverty rate, with 57 households (10.1%) falling below the poverty line. Among the single-parent households, those with 1 or 2 children have the highest poverty rate, with 31 household (18.1%) living below poverty.
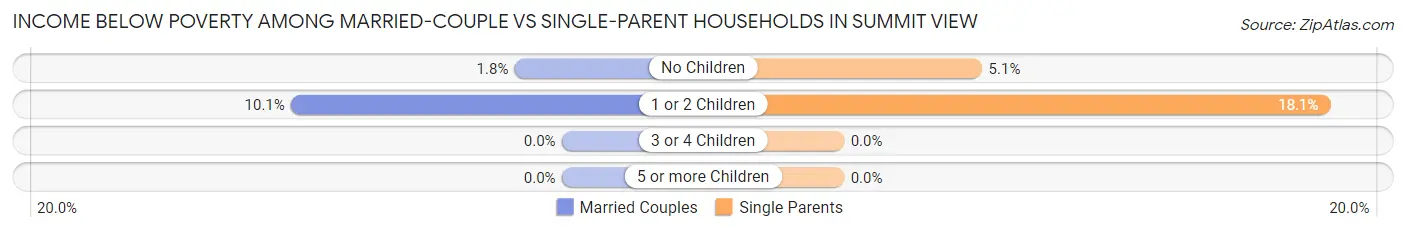
| Children | Married-Couple Families | Single-Parent Households |
| No Children | 16 (1.8%) | 9 (5.1%) |
| 1 or 2 Children | 57 (10.1%) | 31 (18.1%) |
| 3 or 4 Children | 0 (0.0%) | 0 (0.0%) |
| 5 or more Children | 0 (0.0%) | 0 (0.0%) |
| Total | 73 (4.4%) | 40 (11.0%) |
Race in Summit View
The most populous races in Summit View are White / Caucasian (6,250 | 71.4%), Two or more Races (1,077 | 12.3%), and Hispanic or Latino (937 | 10.7%).
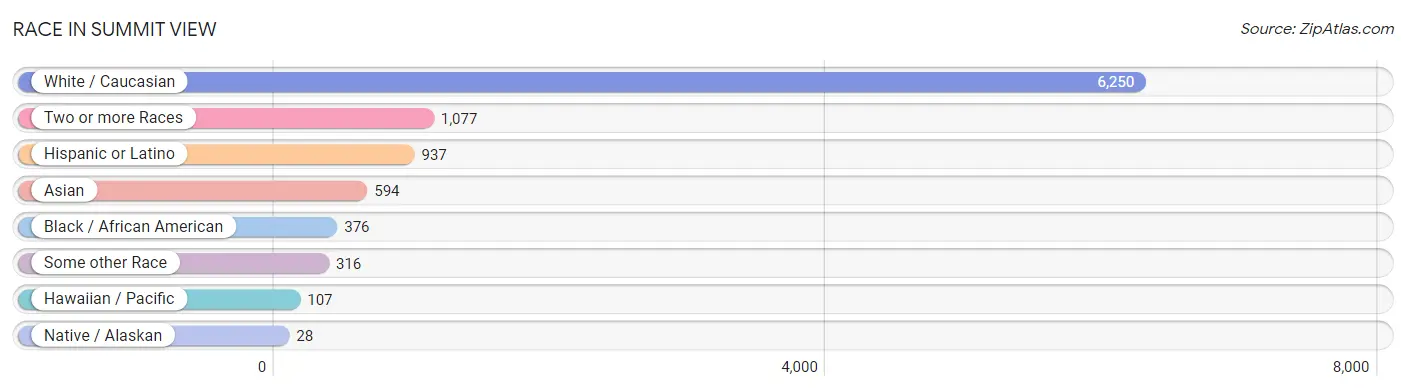
| Race | # Population | % Population |
| Asian | 594 | 6.8% |
| Black / African American | 376 | 4.3% |
| Hawaiian / Pacific | 107 | 1.2% |
| Hispanic or Latino | 937 | 10.7% |
| Native / Alaskan | 28 | 0.3% |
| White / Caucasian | 6,250 | 71.4% |
| Two or more Races | 1,077 | 12.3% |
| Some other Race | 316 | 3.6% |
| Total | 8,748 | 100.0% |
Ancestry in Summit View
The most populous ancestries reported in Summit View are German (1,375 | 15.7%), English (878 | 10.0%), Mexican (685 | 7.8%), Irish (647 | 7.4%), and American (536 | 6.1%), together accounting for 47.1% of all Summit View residents.
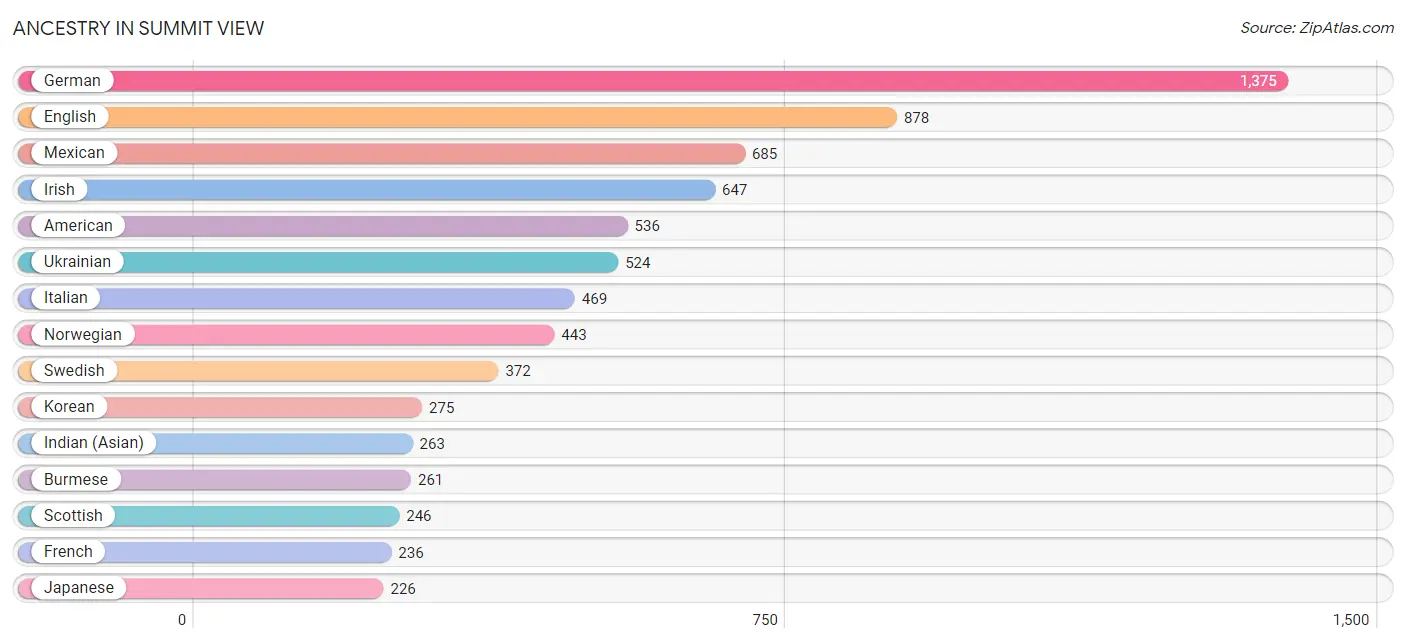
| Ancestry | # Population | % Population |
| African | 20 | 0.2% |
| Aleut | 83 | 0.9% |
| American | 536 | 6.1% |
| Austrian | 16 | 0.2% |
| Bhutanese | 15 | 0.2% |
| British | 53 | 0.6% |
| Burmese | 261 | 3.0% |
| Cherokee | 11 | 0.1% |
| Colville | 21 | 0.2% |
| Czech | 91 | 1.0% |
| Czechoslovakian | 40 | 0.5% |
| Danish | 76 | 0.9% |
| Dutch | 47 | 0.5% |
| English | 878 | 10.0% |
| European | 214 | 2.5% |
| French | 236 | 2.7% |
| French Canadian | 12 | 0.1% |
| German | 1,375 | 15.7% |
| Guamanian / Chamorro | 106 | 1.2% |
| Indian (Asian) | 263 | 3.0% |
| Irish | 647 | 7.4% |
| Italian | 469 | 5.4% |
| Japanese | 226 | 2.6% |
| Korean | 275 | 3.1% |
| Lithuanian | 11 | 0.1% |
| Mexican | 685 | 7.8% |
| Mexican American Indian | 46 | 0.5% |
| Native Hawaiian | 125 | 1.4% |
| Norwegian | 443 | 5.1% |
| Pakistani | 199 | 2.3% |
| Polish | 79 | 0.9% |
| Portuguese | 18 | 0.2% |
| Puerto Rican | 178 | 2.0% |
| Romanian | 8 | 0.1% |
| Russian | 103 | 1.2% |
| Scandinavian | 68 | 0.8% |
| Scotch-Irish | 91 | 1.0% |
| Scottish | 246 | 2.8% |
| Seminole | 22 | 0.3% |
| Sioux | 26 | 0.3% |
| Slavic | 16 | 0.2% |
| Spaniard | 74 | 0.9% |
| Sri Lankan | 25 | 0.3% |
| Subsaharan African | 20 | 0.2% |
| Swedish | 372 | 4.3% |
| Swiss | 162 | 1.8% |
| Thai | 134 | 1.5% |
| Ukrainian | 524 | 6.0% |
| Welsh | 223 | 2.5% | View All 49 Rows |
Immigrants in Summit View
The most numerous immigrant groups reported in Summit View came from Europe (562 | 6.4%), Eastern Europe (538 | 6.1%), Ukraine (517 | 5.9%), Asia (302 | 3.5%), and South Eastern Asia (131 | 1.5%), together accounting for 23.4% of all Summit View residents.
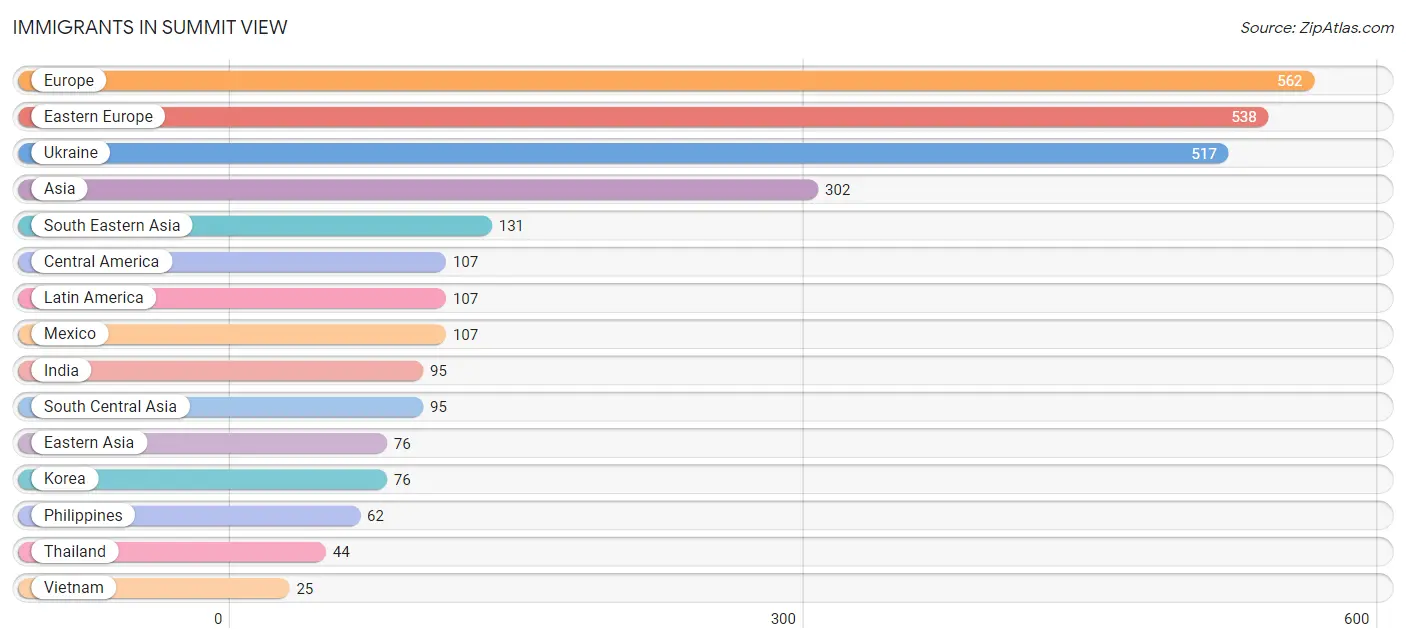
| Immigration Origin | # Population | % Population |
| Africa | 18 | 0.2% |
| Asia | 302 | 3.5% |
| Central America | 107 | 1.2% |
| Eastern Africa | 18 | 0.2% |
| Eastern Asia | 76 | 0.9% |
| Eastern Europe | 538 | 6.1% |
| Ethiopia | 18 | 0.2% |
| Europe | 562 | 6.4% |
| Germany | 15 | 0.2% |
| India | 95 | 1.1% |
| Korea | 76 | 0.9% |
| Latin America | 107 | 1.2% |
| Mexico | 107 | 1.2% |
| Moldova | 8 | 0.1% |
| Northern Europe | 9 | 0.1% |
| Philippines | 62 | 0.7% |
| Russia | 13 | 0.2% |
| South Central Asia | 95 | 1.1% |
| South Eastern Asia | 131 | 1.5% |
| Thailand | 44 | 0.5% |
| Ukraine | 517 | 5.9% |
| Vietnam | 25 | 0.3% |
| Western Europe | 15 | 0.2% | View All 23 Rows |
Sex and Age in Summit View
Sex and Age in Summit View
The most populous age groups in Summit View are 25 to 29 Years (544 | 12.8%) for men and 25 to 29 Years (515 | 11.5%) for women.
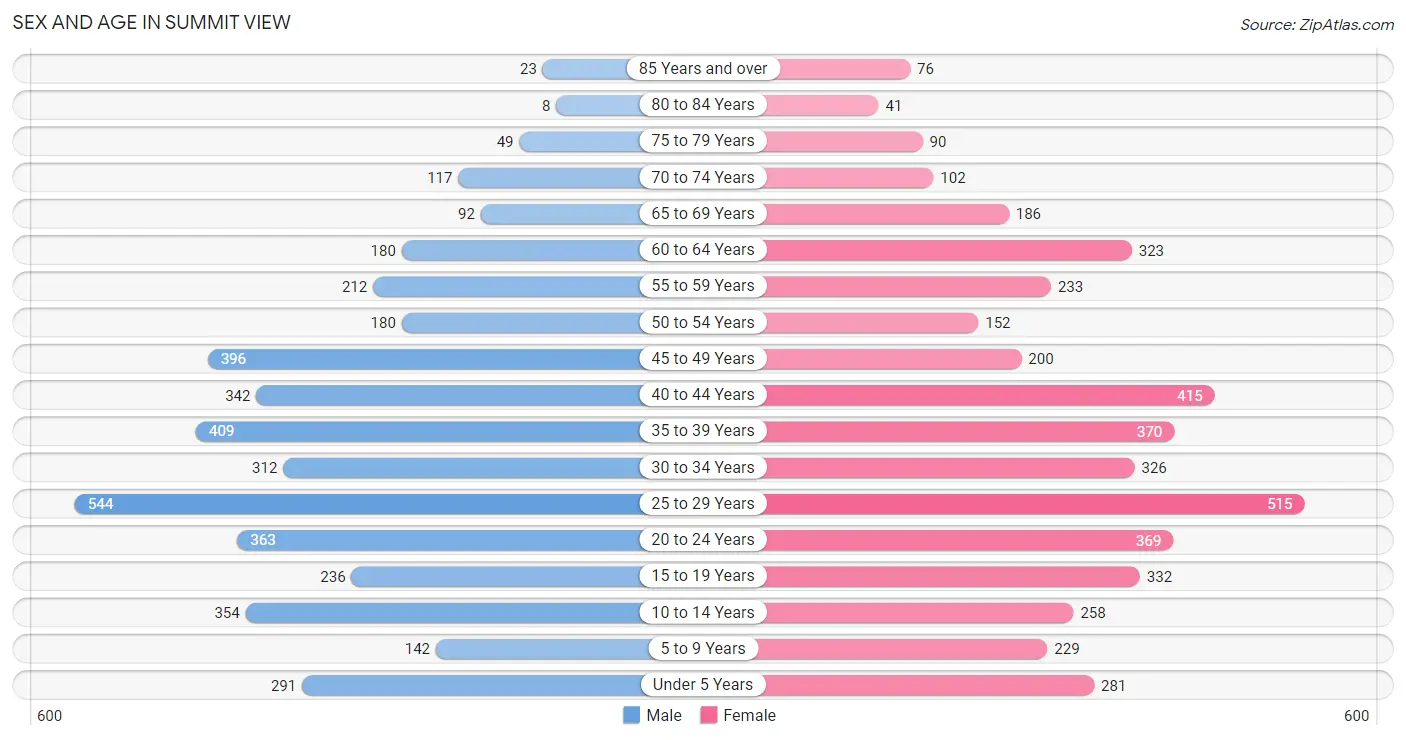
| Age Bracket | Male | Female |
| Under 5 Years | 291 (6.9%) | 281 (6.2%) |
| 5 to 9 Years | 142 (3.3%) | 229 (5.1%) |
| 10 to 14 Years | 354 (8.3%) | 258 (5.7%) |
| 15 to 19 Years | 236 (5.6%) | 332 (7.4%) |
| 20 to 24 Years | 363 (8.5%) | 369 (8.2%) |
| 25 to 29 Years | 544 (12.8%) | 515 (11.5%) |
| 30 to 34 Years | 312 (7.3%) | 326 (7.2%) |
| 35 to 39 Years | 409 (9.6%) | 370 (8.2%) |
| 40 to 44 Years | 342 (8.1%) | 415 (9.2%) |
| 45 to 49 Years | 396 (9.3%) | 200 (4.4%) |
| 50 to 54 Years | 180 (4.2%) | 152 (3.4%) |
| 55 to 59 Years | 212 (5.0%) | 233 (5.2%) |
| 60 to 64 Years | 180 (4.2%) | 323 (7.2%) |
| 65 to 69 Years | 92 (2.2%) | 186 (4.1%) |
| 70 to 74 Years | 117 (2.8%) | 102 (2.3%) |
| 75 to 79 Years | 49 (1.1%) | 90 (2.0%) |
| 80 to 84 Years | 8 (0.2%) | 41 (0.9%) |
| 85 Years and over | 23 (0.5%) | 76 (1.7%) |
| Total | 4,250 (100.0%) | 4,498 (100.0%) |
Families and Households in Summit View
Median Family Size in Summit View
The median family size in Summit View is 3.24 persons per family, with married-couple families (1,645 | 81.9%) accounting for the largest median family size of 3.36 persons per family. On the other hand, single male/father families (123 | 6.1%) represent the smallest median family size with 2.50 persons per family.
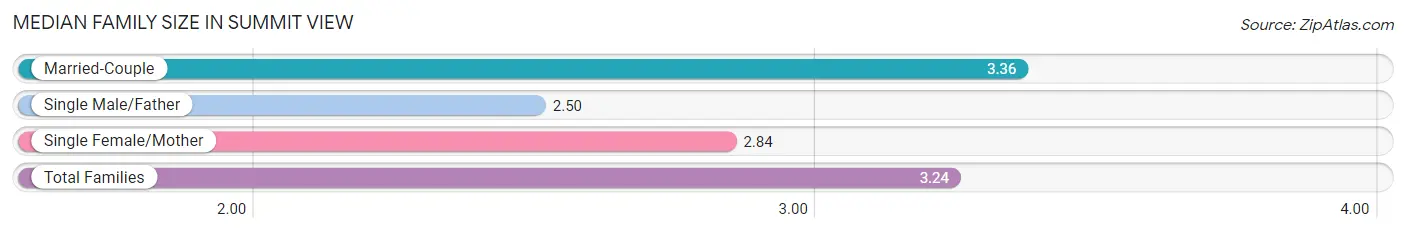
| Family Type | # Families | Family Size |
| Married-Couple | 1,645 (81.9%) | 3.36 |
| Single Male/Father | 123 (6.1%) | 2.50 |
| Single Female/Mother | 241 (12.0%) | 2.84 |
| Total Families | 2,009 (100.0%) | 3.24 |
Median Household Size in Summit View
The median household size in Summit View is 2.73 persons per household, with single male/father households (123 | 3.8%) accounting for the largest median household size of 3.43 persons per household. non-family households (1,191 | 37.2%) represent the smallest median household size with 1.62 persons per household.
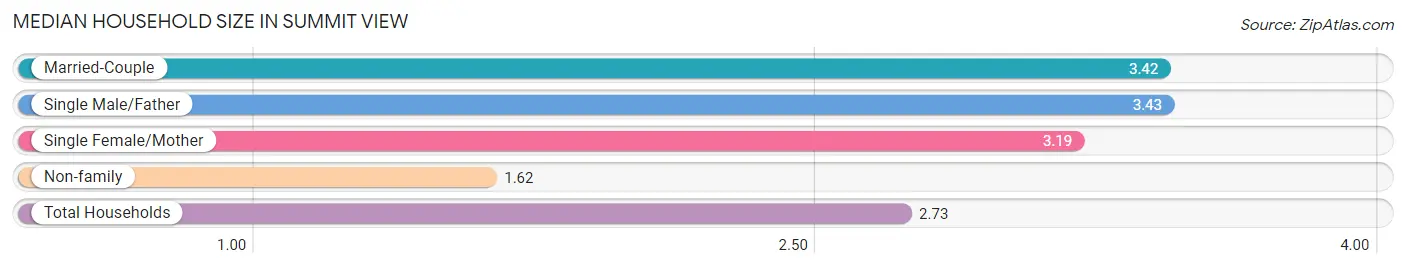
| Household Type | # Households | Household Size |
| Married-Couple | 1,645 (51.4%) | 3.42 |
| Single Male/Father | 123 (3.8%) | 3.43 |
| Single Female/Mother | 241 (7.5%) | 3.19 |
| Non-family | 1,191 (37.2%) | 1.62 |
| Total Households | 3,200 (100.0%) | 2.73 |
Household Size by Marriage Status in Summit View
Out of a total of 3,200 households in Summit View, 2,009 (62.8%) are family households, while 1,191 (37.2%) are nonfamily households. The most numerous type of family households are 2-person households, comprising 721, and the most common type of nonfamily households are 1-person households, comprising 708.
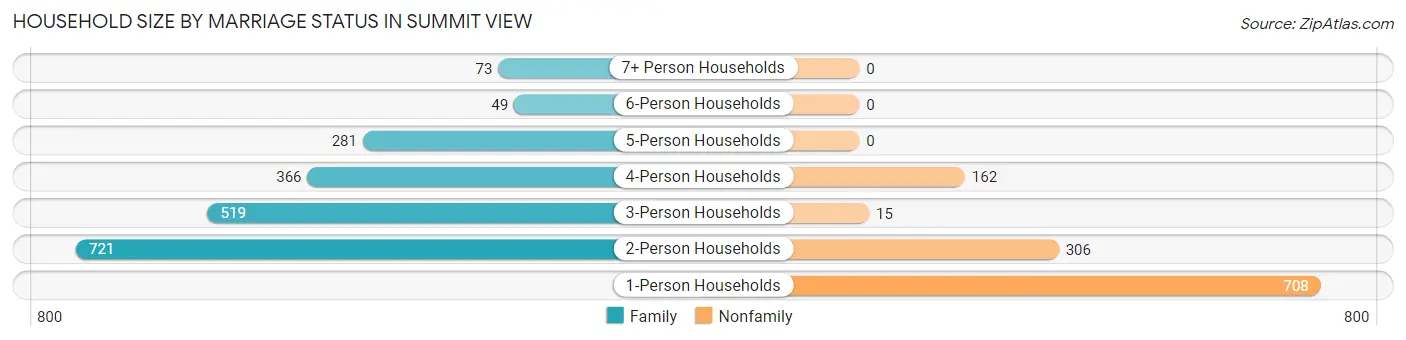
| Household Size | Family Households | Nonfamily Households |
| 1-Person Households | - | 708 (22.1%) |
| 2-Person Households | 721 (22.5%) | 306 (9.6%) |
| 3-Person Households | 519 (16.2%) | 15 (0.5%) |
| 4-Person Households | 366 (11.4%) | 162 (5.1%) |
| 5-Person Households | 281 (8.8%) | 0 (0.0%) |
| 6-Person Households | 49 (1.5%) | 0 (0.0%) |
| 7+ Person Households | 73 (2.3%) | 0 (0.0%) |
| Total | 2,009 (62.8%) | 1,191 (37.2%) |
Female Fertility in Summit View
Fertility by Age in Summit View
Average fertility rate in Summit View is 50.0 births per 1,000 women. Women in the age bracket of 20 to 34 years have the highest fertility rate with 93.0 births per 1,000 women. Women in the age bracket of 20 to 34 years acount for 86.2% of all women with births.
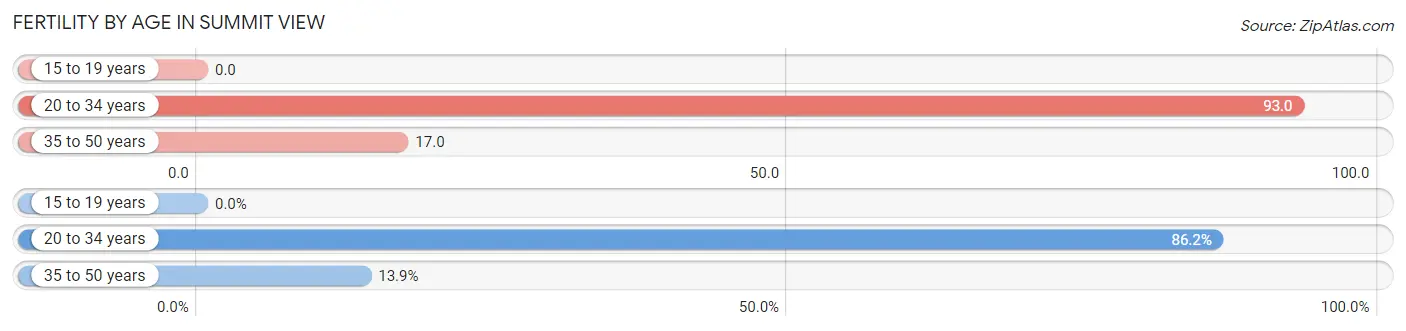
| Age Bracket | Women with Births | Births / 1,000 Women |
| 15 to 19 years | 0 (0.0%) | 0.0 |
| 20 to 34 years | 112 (86.2%) | 93.0 |
| 35 to 50 years | 18 (13.9%) | 17.0 |
| Total | 130 (100.0%) | 50.0 |
Fertility by Age by Marriage Status in Summit View
67.7% of women with births (130) in Summit View are married. The highest percentage of unmarried women with births falls into 35 to 50 years age bracket with 50.0% of them unmarried at the time of birth, while the lowest percentage of unmarried women with births belong to 20 to 34 years age bracket with 29.5% of them unmarried.
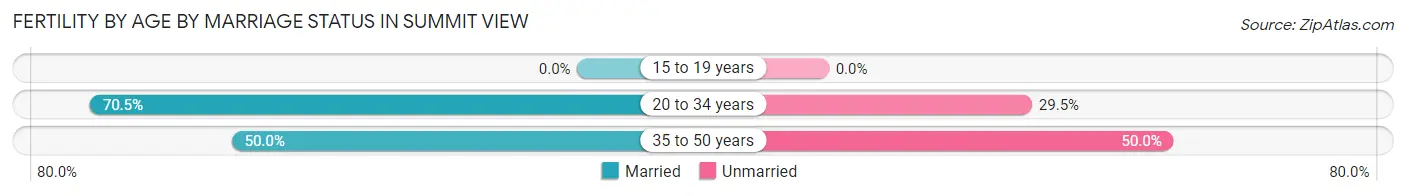
| Age Bracket | Married | Unmarried |
| 15 to 19 years | 0 (0.0%) | 0 (0.0%) |
| 20 to 34 years | 79 (70.5%) | 33 (29.5%) |
| 35 to 50 years | 9 (50.0%) | 9 (50.0%) |
| Total | 88 (67.7%) | 42 (32.3%) |
Fertility by Education in Summit View
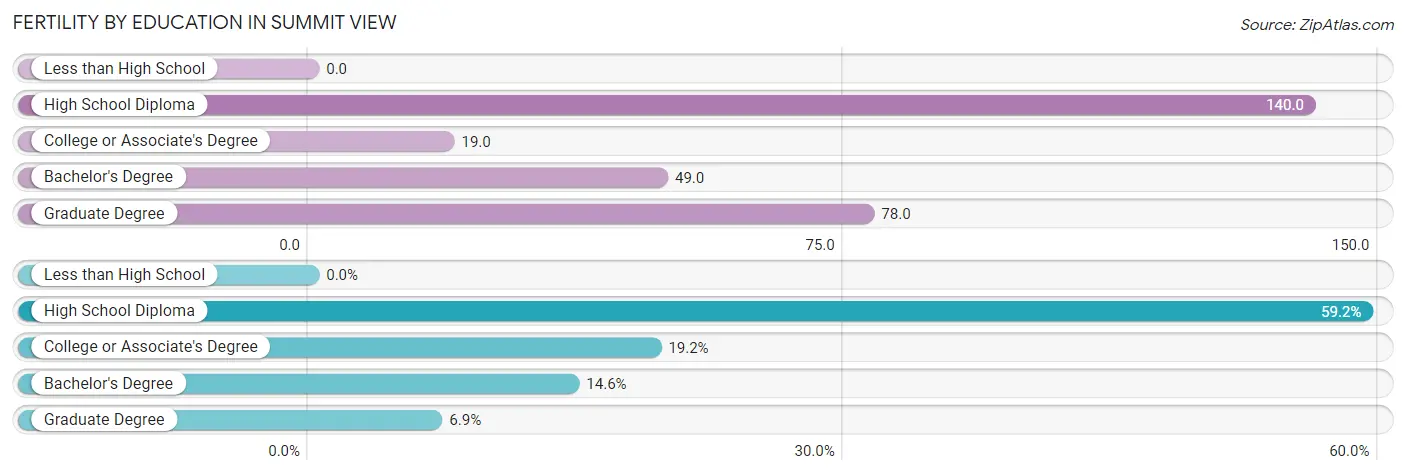
| Educational Attainment | Women with Births | Births / 1,000 Women |
| Less than High School | 0 (0.0%) | 0.0 |
| High School Diploma | 77 (59.2%) | 140.0 |
| College or Associate's Degree | 25 (19.2%) | 19.0 |
| Bachelor's Degree | 19 (14.6%) | 49.0 |
| Graduate Degree | 9 (6.9%) | 78.0 |
| Total | 130 (100.0%) | 50.0 |
Fertility by Education by Marriage Status in Summit View
32.3% of women with births in Summit View are unmarried. Women with the educational attainment of bachelor's degree are most likely to be married with 100.0% of them married at childbirth, while women with the educational attainment of high school diploma are least likely to be married with 42.9% of them unmarried at childbirth.
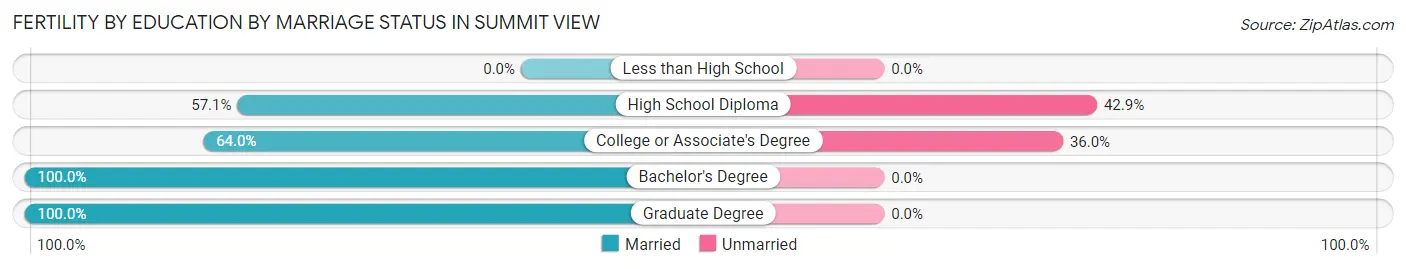
| Educational Attainment | Married | Unmarried |
| Less than High School | 0 (0.0%) | 0 (0.0%) |
| High School Diploma | 44 (57.1%) | 33 (42.9%) |
| College or Associate's Degree | 16 (64.0%) | 9 (36.0%) |
| Bachelor's Degree | 19 (100.0%) | 0 (0.0%) |
| Graduate Degree | 9 (100.0%) | 0 (0.0%) |
| Total | 88 (67.7%) | 42 (32.3%) |
Employment Characteristics in Summit View
Employment by Class of Employer in Summit View
Among the 4,920 employed individuals in Summit View, private company employees (3,230 | 65.6%), local government employees (525 | 10.7%), and not-for-profit organizations (385 | 7.8%) make up the most common classes of employment.
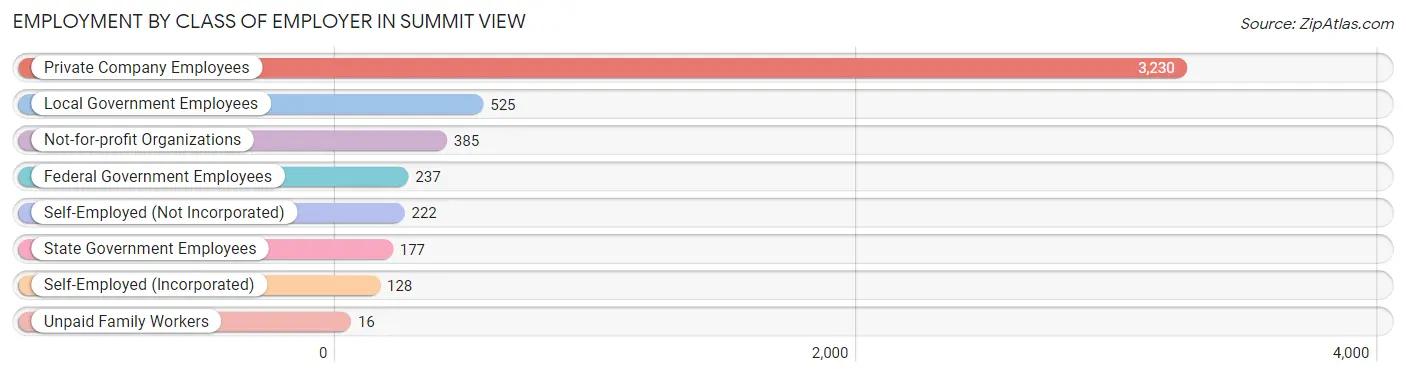
| Employer Class | # Employees | % Employees |
| Private Company Employees | 3,230 | 65.6% |
| Self-Employed (Incorporated) | 128 | 2.6% |
| Self-Employed (Not Incorporated) | 222 | 4.5% |
| Not-for-profit Organizations | 385 | 7.8% |
| Local Government Employees | 525 | 10.7% |
| State Government Employees | 177 | 3.6% |
| Federal Government Employees | 237 | 4.8% |
| Unpaid Family Workers | 16 | 0.3% |
| Total | 4,920 | 100.0% |
Employment Status by Age in Summit View
According to the labor force statistics for Summit View, out of the total population over 16 years of age (7,085), 75.6% or 5,356 individuals are in the labor force, with 6.8% or 364 of them unemployed. The age group with the highest labor force participation rate is 20 to 24 years, with 97.7% or 715 individuals in the labor force. Within the labor force, the 16 to 19 years age range has the highest percentage of unemployed individuals, with 43.2% or 104 of them being unemployed.
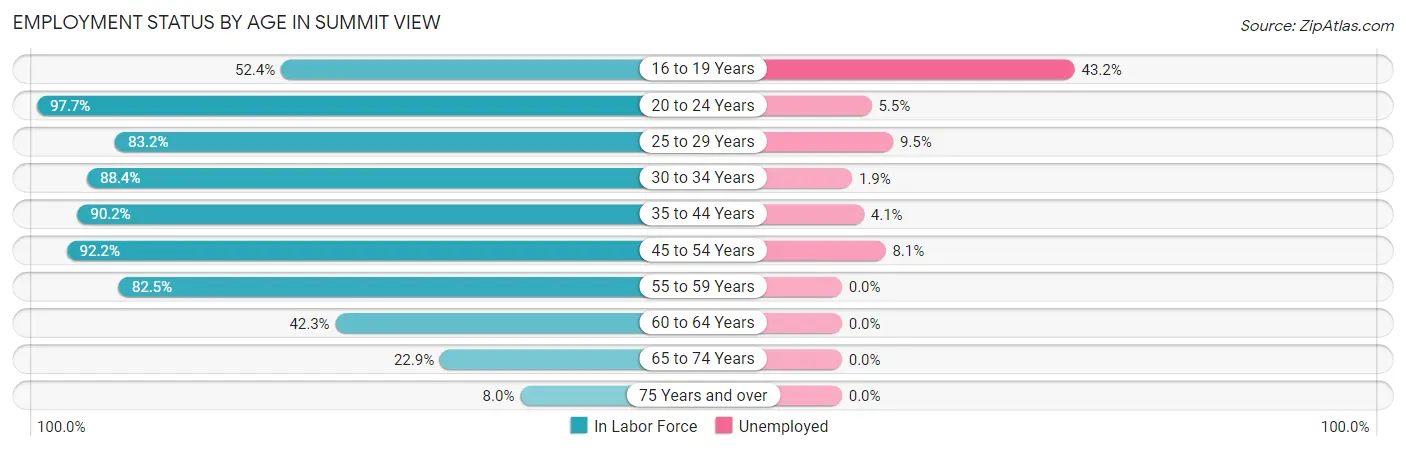
| Age Bracket | In Labor Force | Unemployed |
| 16 to 19 Years | 241 (52.4%) | 104 (43.2%) |
| 20 to 24 Years | 715 (97.7%) | 39 (5.5%) |
| 25 to 29 Years | 881 (83.2%) | 84 (9.5%) |
| 30 to 34 Years | 564 (88.4%) | 11 (1.9%) |
| 35 to 44 Years | 1,385 (90.2%) | 57 (4.1%) |
| 45 to 54 Years | 856 (92.2%) | 69 (8.1%) |
| 55 to 59 Years | 367 (82.5%) | 0 (0.0%) |
| 60 to 64 Years | 213 (42.3%) | 0 (0.0%) |
| 65 to 74 Years | 114 (22.9%) | 0 (0.0%) |
| 75 Years and over | 23 (8.0%) | 0 (0.0%) |
| Total | 5,356 (75.6%) | 364 (6.8%) |
Employment Status by Educational Attainment in Summit View
According to labor force statistics for Summit View, 83.5% of individuals (4,266) out of the total population between 25 and 64 years of age (5,109) are in the labor force, with 5.2% or 222 of them being unemployed. The group with the highest labor force participation rate are those with the educational attainment of bachelor's degree or higher, with 90.2% or 826 individuals in the labor force. Within the labor force, individuals with high school diploma education have the highest percentage of unemployment, with 10.9% or 140 of them being unemployed.
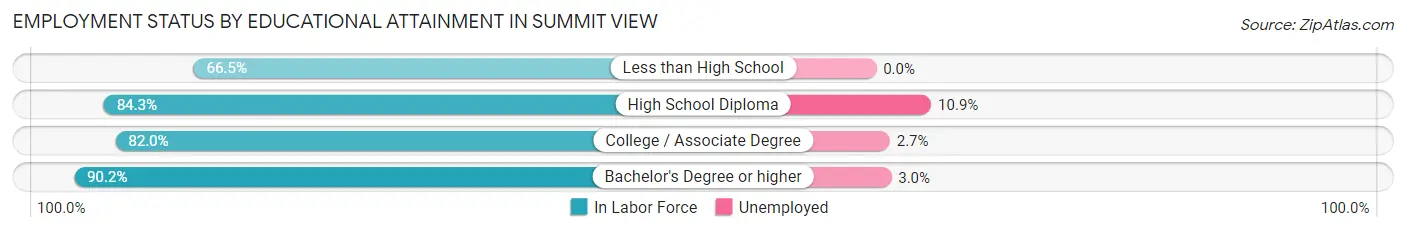
| Educational Attainment | In Labor Force | Unemployed |
| Less than High School | 143 (66.5%) | 0 (0.0%) |
| High School Diploma | 1,281 (84.3%) | 166 (10.9%) |
| College / Associate Degree | 2,016 (82.0%) | 66 (2.7%) |
| Bachelor's Degree or higher | 826 (90.2%) | 27 (3.0%) |
| Total | 4,266 (83.5%) | 266 (5.2%) |
Employment Occupations by Sex in Summit View
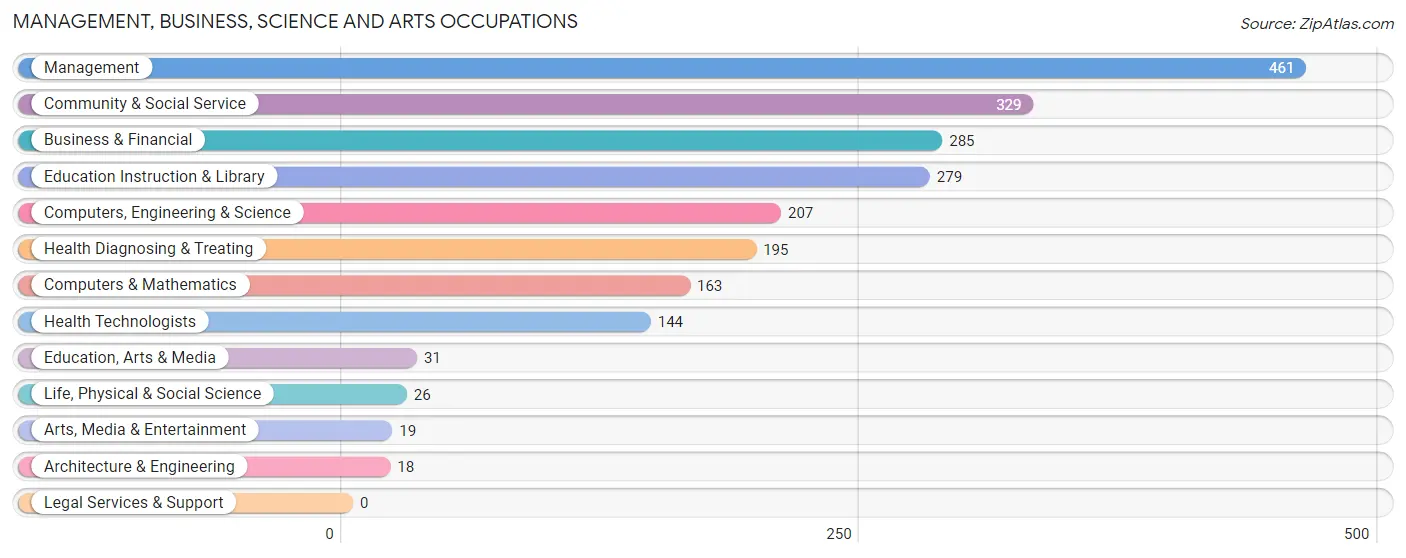
Management, Business, Science and Arts Occupations
The most common Management, Business, Science and Arts occupations in Summit View are Management (461 | 9.5%), Community & Social Service (329 | 6.7%), Business & Financial (285 | 5.8%), Education Instruction & Library (279 | 5.7%), and Computers, Engineering & Science (207 | 4.2%).
Management, Business, Science and Arts Occupations by Sex
Within the Management, Business, Science and Arts occupations in Summit View, the most male-oriented occupations are Business & Financial (95.1%), Management (65.3%), and Life, Physical & Social Science (46.2%), while the most female-oriented occupations are Education, Arts & Media (100.0%), Arts, Media & Entertainment (100.0%), and Health Technologists (100.0%).
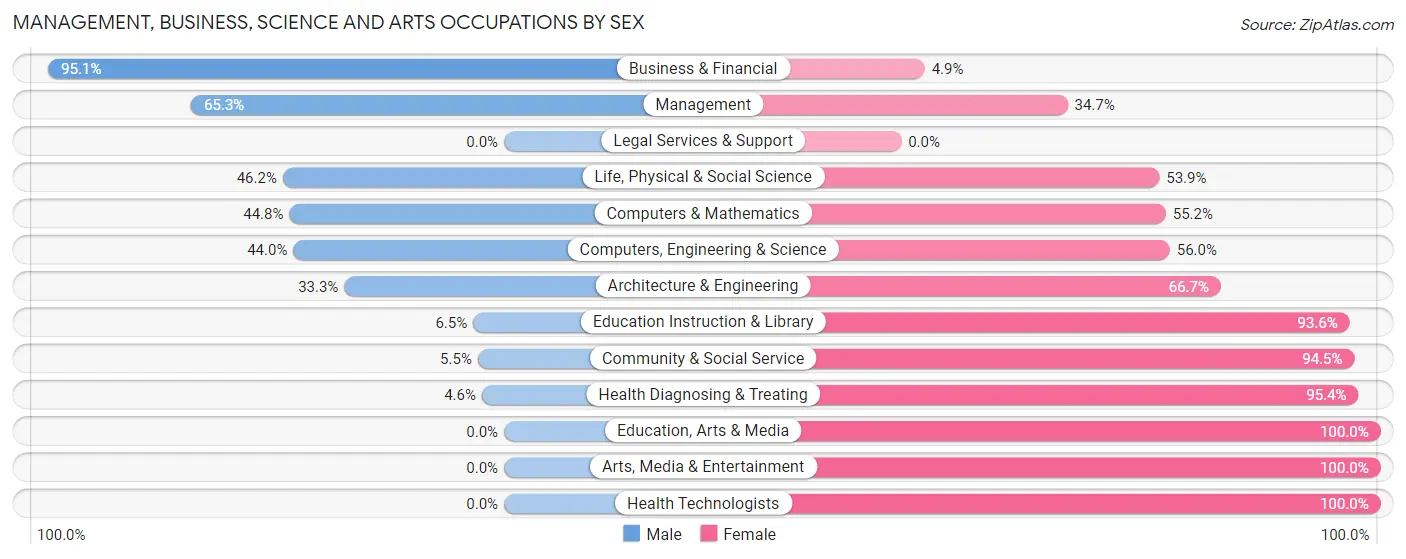
| Occupation | Male | Female |
| Management | 301 (65.3%) | 160 (34.7%) |
| Business & Financial | 271 (95.1%) | 14 (4.9%) |
| Computers, Engineering & Science | 91 (44.0%) | 116 (56.0%) |
| Computers & Mathematics | 73 (44.8%) | 90 (55.2%) |
| Architecture & Engineering | 6 (33.3%) | 12 (66.7%) |
| Life, Physical & Social Science | 12 (46.2%) | 14 (53.8%) |
| Community & Social Service | 18 (5.5%) | 311 (94.5%) |
| Education, Arts & Media | 0 (0.0%) | 31 (100.0%) |
| Legal Services & Support | 0 (0.0%) | 0 (0.0%) |
| Education Instruction & Library | 18 (6.5%) | 261 (93.5%) |
| Arts, Media & Entertainment | 0 (0.0%) | 19 (100.0%) |
| Health Diagnosing & Treating | 9 (4.6%) | 186 (95.4%) |
| Health Technologists | 0 (0.0%) | 144 (100.0%) |
| Total (Category) | 690 (46.7%) | 787 (53.3%) |
| Total (Overall) | 2,489 (51.0%) | 2,389 (49.0%) |
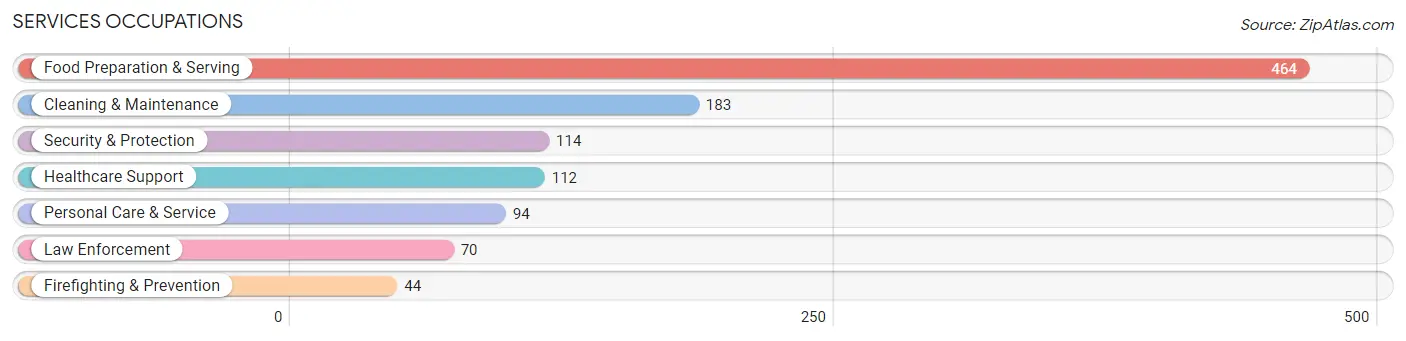
Services Occupations
The most common Services occupations in Summit View are Food Preparation & Serving (464 | 9.5%), Cleaning & Maintenance (183 | 3.7%), Security & Protection (114 | 2.3%), Healthcare Support (112 | 2.3%), and Personal Care & Service (94 | 1.9%).
Services Occupations by Sex
Within the Services occupations in Summit View, the most male-oriented occupations are Security & Protection (100.0%), Firefighting & Prevention (100.0%), and Law Enforcement (100.0%), while the most female-oriented occupations are Healthcare Support (100.0%), Personal Care & Service (100.0%), and Food Preparation & Serving (89.2%).
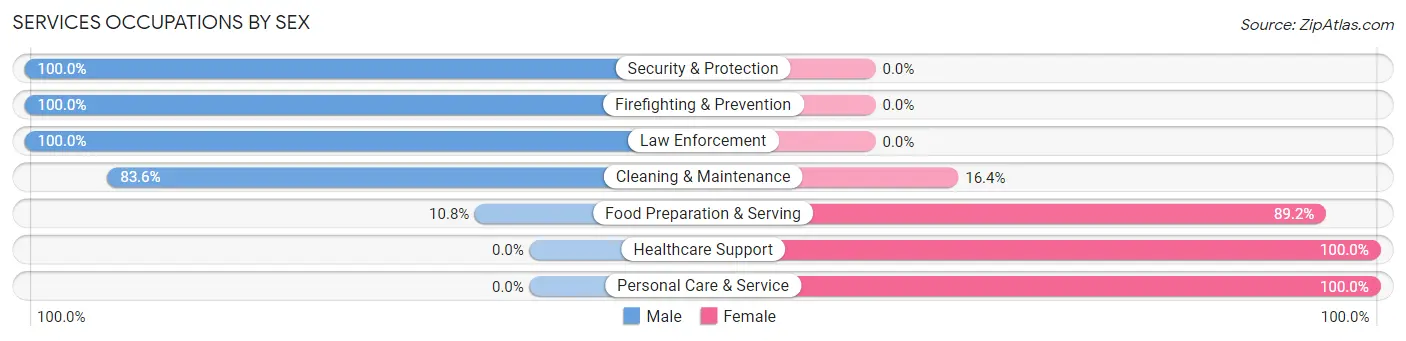
| Occupation | Male | Female |
| Healthcare Support | 0 (0.0%) | 112 (100.0%) |
| Security & Protection | 114 (100.0%) | 0 (0.0%) |
| Firefighting & Prevention | 44 (100.0%) | 0 (0.0%) |
| Law Enforcement | 70 (100.0%) | 0 (0.0%) |
| Food Preparation & Serving | 50 (10.8%) | 414 (89.2%) |
| Cleaning & Maintenance | 153 (83.6%) | 30 (16.4%) |
| Personal Care & Service | 0 (0.0%) | 94 (100.0%) |
| Total (Category) | 317 (32.8%) | 650 (67.2%) |
| Total (Overall) | 2,489 (51.0%) | 2,389 (49.0%) |
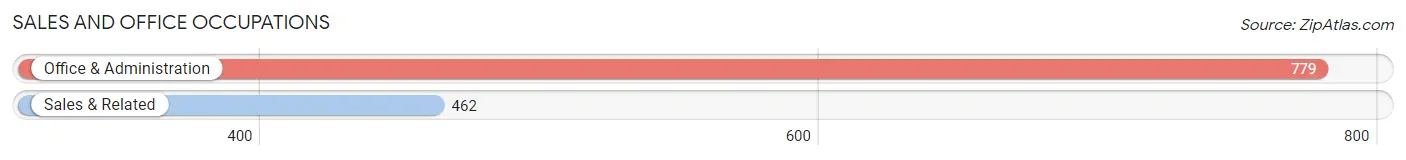
Sales and Office Occupations
The most common Sales and Office occupations in Summit View are Office & Administration (779 | 16.0%), and Sales & Related (462 | 9.5%).
Sales and Office Occupations by Sex
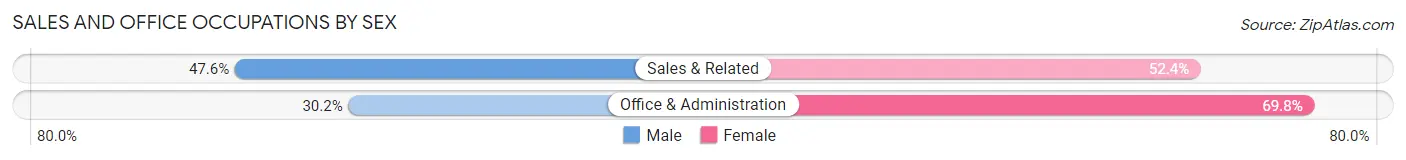
| Occupation | Male | Female |
| Sales & Related | 220 (47.6%) | 242 (52.4%) |
| Office & Administration | 235 (30.2%) | 544 (69.8%) |
| Total (Category) | 455 (36.7%) | 786 (63.3%) |
| Total (Overall) | 2,489 (51.0%) | 2,389 (49.0%) |
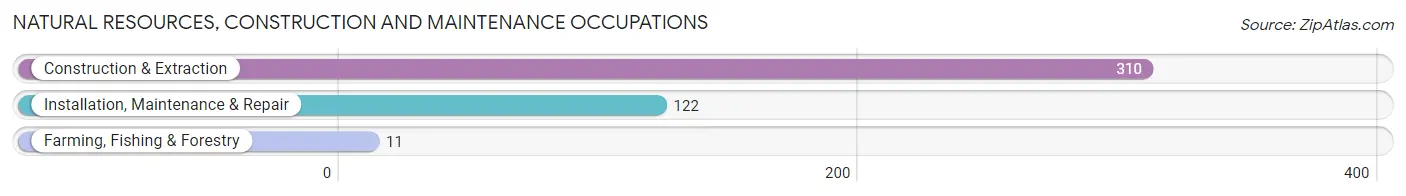
Natural Resources, Construction and Maintenance Occupations
The most common Natural Resources, Construction and Maintenance occupations in Summit View are Construction & Extraction (310 | 6.4%), Installation, Maintenance & Repair (122 | 2.5%), and Farming, Fishing & Forestry (11 | 0.2%).
Natural Resources, Construction and Maintenance Occupations by Sex
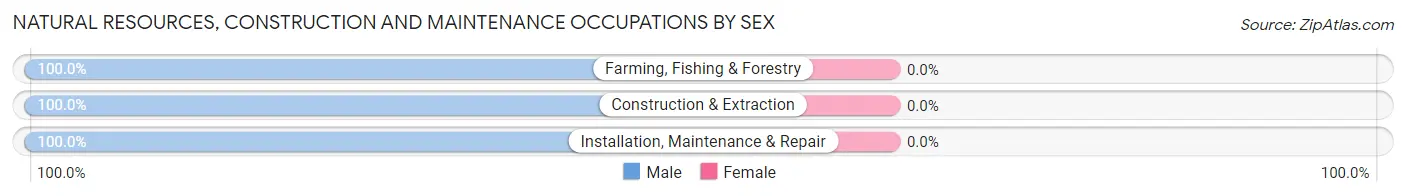
| Occupation | Male | Female |
| Farming, Fishing & Forestry | 11 (100.0%) | 0 (0.0%) |
| Construction & Extraction | 310 (100.0%) | 0 (0.0%) |
| Installation, Maintenance & Repair | 122 (100.0%) | 0 (0.0%) |
| Total (Category) | 443 (100.0%) | 0 (0.0%) |
| Total (Overall) | 2,489 (51.0%) | 2,389 (49.0%) |
Production, Transportation and Moving Occupations
The most common Production, Transportation and Moving occupations in Summit View are Material Moving (326 | 6.7%), Production (291 | 6.0%), and Transportation (133 | 2.7%).
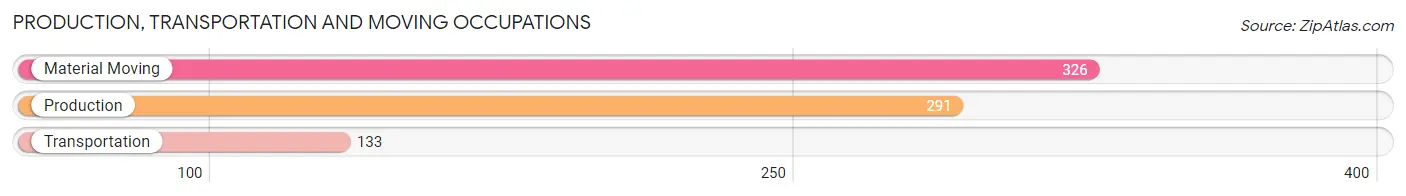
Production, Transportation and Moving Occupations by Sex
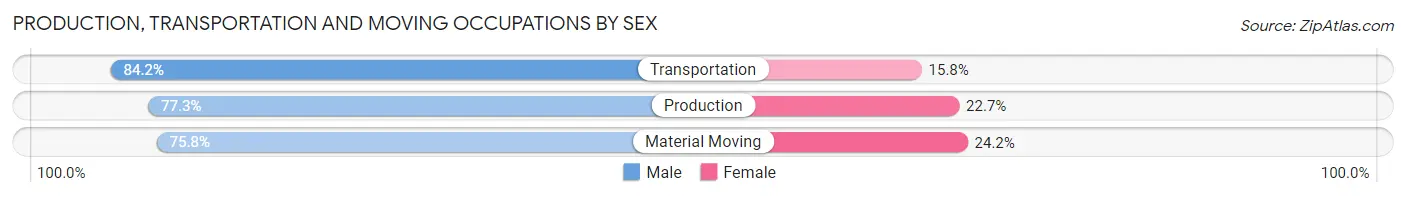
| Occupation | Male | Female |
| Production | 225 (77.3%) | 66 (22.7%) |
| Transportation | 112 (84.2%) | 21 (15.8%) |
| Material Moving | 247 (75.8%) | 79 (24.2%) |
| Total (Category) | 584 (77.9%) | 166 (22.1%) |
| Total (Overall) | 2,489 (51.0%) | 2,389 (49.0%) |
Employment Industries by Sex in Summit View
Employment Industries in Summit View
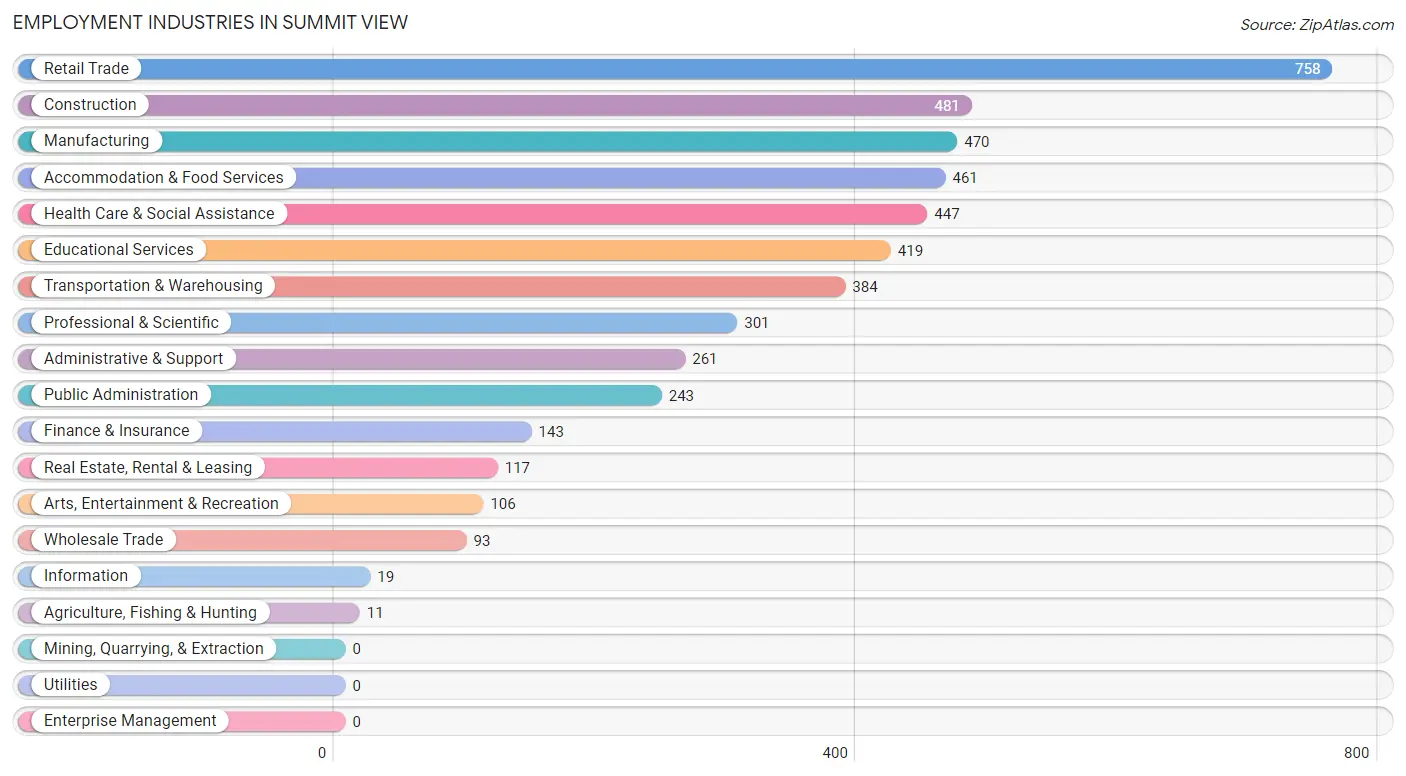
The major employment industries in Summit View include Retail Trade (758 | 15.5%), Construction (481 | 9.9%), Manufacturing (470 | 9.6%), Accommodation & Food Services (461 | 9.5%), and Health Care & Social Assistance (447 | 9.2%).
Employment Industries by Sex in Summit View
The Summit View industries that see more men than women are Agriculture, Fishing & Hunting (100.0%), Real Estate, Rental & Leasing (100.0%), and Construction (97.1%), whereas the industries that tend to have a higher number of women are Information (100.0%), Health Care & Social Assistance (93.3%), and Accommodation & Food Services (88.3%).
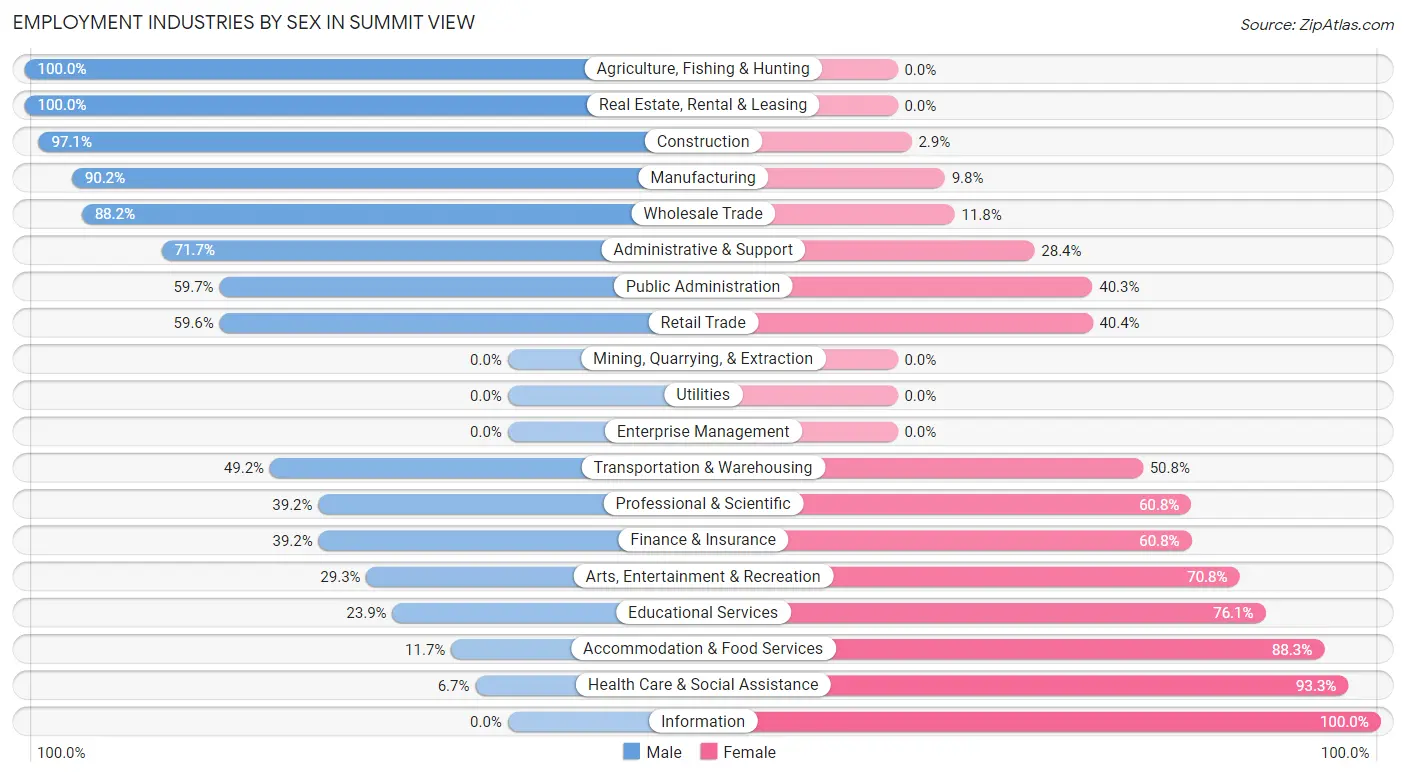
| Industry | Male | Female |
| Agriculture, Fishing & Hunting | 11 (100.0%) | 0 (0.0%) |
| Mining, Quarrying, & Extraction | 0 (0.0%) | 0 (0.0%) |
| Construction | 467 (97.1%) | 14 (2.9%) |
| Manufacturing | 424 (90.2%) | 46 (9.8%) |
| Wholesale Trade | 82 (88.2%) | 11 (11.8%) |
| Retail Trade | 452 (59.6%) | 306 (40.4%) |
| Transportation & Warehousing | 189 (49.2%) | 195 (50.8%) |
| Utilities | 0 (0.0%) | 0 (0.0%) |
| Information | 0 (0.0%) | 19 (100.0%) |
| Finance & Insurance | 56 (39.2%) | 87 (60.8%) |
| Real Estate, Rental & Leasing | 117 (100.0%) | 0 (0.0%) |
| Professional & Scientific | 118 (39.2%) | 183 (60.8%) |
| Enterprise Management | 0 (0.0%) | 0 (0.0%) |
| Administrative & Support | 187 (71.7%) | 74 (28.3%) |
| Educational Services | 100 (23.9%) | 319 (76.1%) |
| Health Care & Social Assistance | 30 (6.7%) | 417 (93.3%) |
| Arts, Entertainment & Recreation | 31 (29.2%) | 75 (70.8%) |
| Accommodation & Food Services | 54 (11.7%) | 407 (88.3%) |
| Public Administration | 145 (59.7%) | 98 (40.3%) |
| Total | 2,489 (51.0%) | 2,389 (49.0%) |
Education in Summit View
School Enrollment in Summit View
The most common levels of schooling among the 1,860 students in Summit View are middle school (551 | 29.6%), college / undergraduate (439 | 23.6%), and elementary school (330 | 17.7%).
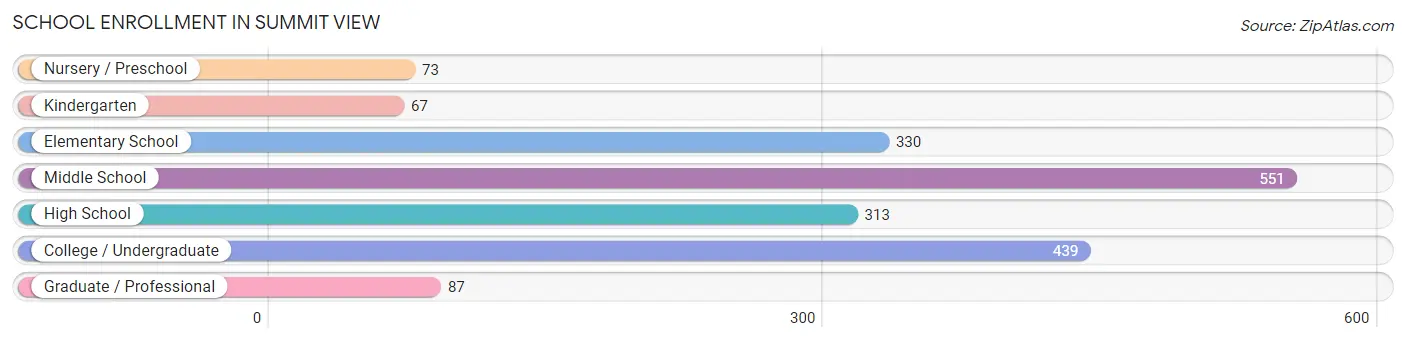
| School Level | # Students | % Students |
| Nursery / Preschool | 73 | 3.9% |
| Kindergarten | 67 | 3.6% |
| Elementary School | 330 | 17.7% |
| Middle School | 551 | 29.6% |
| High School | 313 | 16.8% |
| College / Undergraduate | 439 | 23.6% |
| Graduate / Professional | 87 | 4.7% |
| Total | 1,860 | 100.0% |
School Enrollment by Age by Funding Source in Summit View
Out of a total of 1,860 students who are enrolled in schools in Summit View, 303 (16.3%) attend a private institution, while the remaining 1,557 (83.7%) are enrolled in public schools. The age group of 25 to 34 year olds has the highest likelihood of being enrolled in private schools, with 64 (28.8% in the age bracket) enrolled. Conversely, the age group of 3 to 4 year olds has the lowest likelihood of being enrolled in a private school, with 73 (100.0% in the age bracket) attending a public institution.
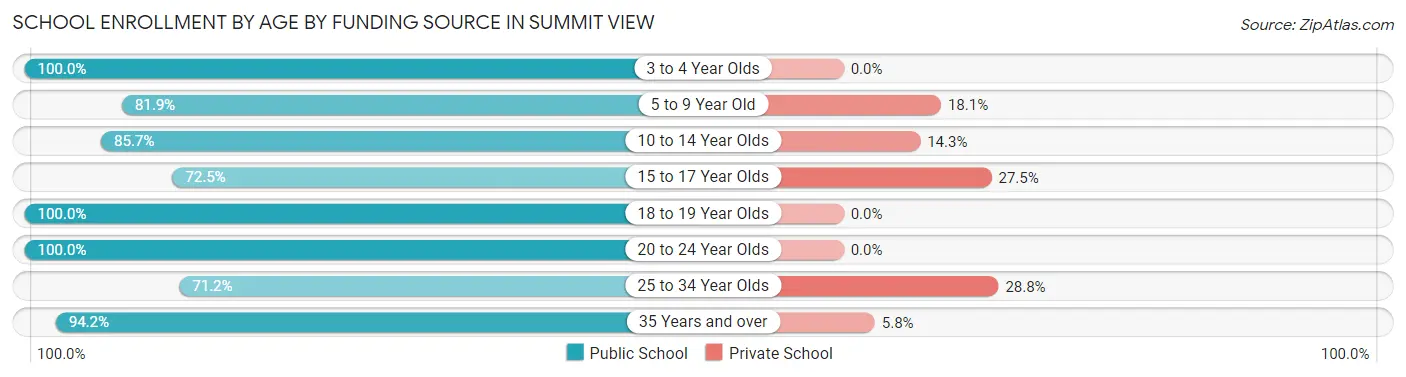
| Age Bracket | Public School | Private School |
| 3 to 4 Year Olds | 73 (100.0%) | 0 (0.0%) |
| 5 to 9 Year Old | 289 (81.9%) | 64 (18.1%) |
| 10 to 14 Year Olds | 517 (85.7%) | 86 (14.3%) |
| 15 to 17 Year Olds | 200 (72.5%) | 76 (27.5%) |
| 18 to 19 Year Olds | 29 (100.0%) | 0 (0.0%) |
| 20 to 24 Year Olds | 63 (100.0%) | 0 (0.0%) |
| 25 to 34 Year Olds | 158 (71.2%) | 64 (28.8%) |
| 35 Years and over | 227 (94.2%) | 14 (5.8%) |
| Total | 1,557 (83.7%) | 303 (16.3%) |
Educational Attainment by Field of Study in Summit View
Business (319 | 28.8%), arts & humanities (131 | 11.8%), social sciences (115 | 10.4%), education (106 | 9.6%), and science & technology (104 | 9.4%) are the most common fields of study among 1,107 individuals in Summit View who have obtained a bachelor's degree or higher.
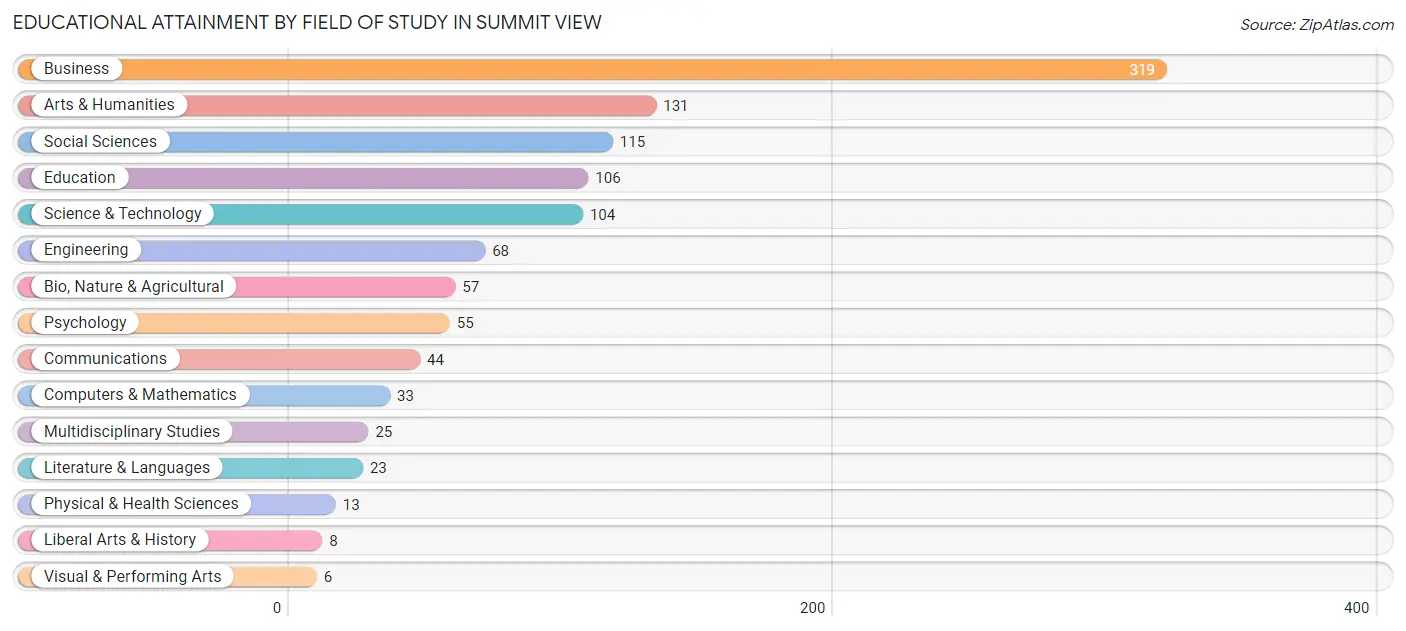
| Field of Study | # Graduates | % Graduates |
| Computers & Mathematics | 33 | 3.0% |
| Bio, Nature & Agricultural | 57 | 5.1% |
| Physical & Health Sciences | 13 | 1.2% |
| Psychology | 55 | 5.0% |
| Social Sciences | 115 | 10.4% |
| Engineering | 68 | 6.1% |
| Multidisciplinary Studies | 25 | 2.3% |
| Science & Technology | 104 | 9.4% |
| Business | 319 | 28.8% |
| Education | 106 | 9.6% |
| Literature & Languages | 23 | 2.1% |
| Liberal Arts & History | 8 | 0.7% |
| Visual & Performing Arts | 6 | 0.5% |
| Communications | 44 | 4.0% |
| Arts & Humanities | 131 | 11.8% |
| Total | 1,107 | 100.0% |
Transportation & Commute in Summit View
Vehicle Availability by Sex in Summit View
The most prevalent vehicle ownership categories in Summit View are males with 2 vehicles (1,122, accounting for 43.4%) and females with 2 vehicles (942, making up 48.0%).
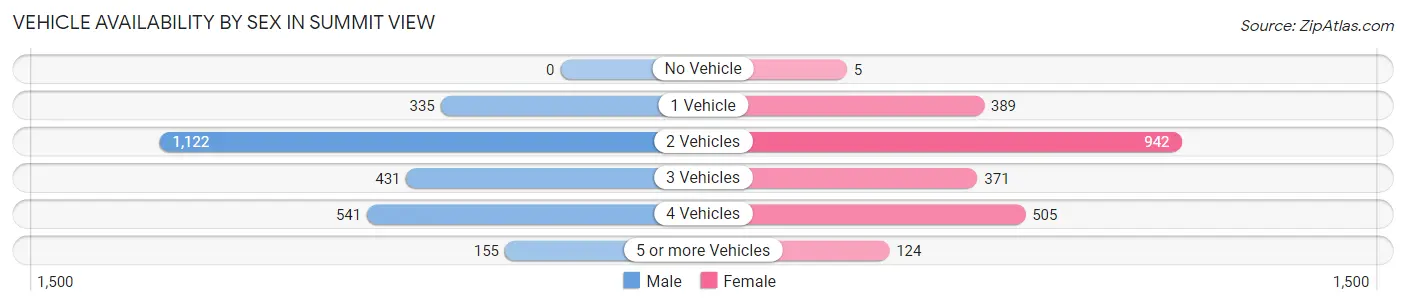
| Vehicles Available | Male | Female |
| No Vehicle | 0 (0.0%) | 5 (0.2%) |
| 1 Vehicle | 335 (13.0%) | 389 (16.7%) |
| 2 Vehicles | 1,122 (43.4%) | 942 (40.3%) |
| 3 Vehicles | 431 (16.7%) | 371 (15.9%) |
| 4 Vehicles | 541 (20.9%) | 505 (21.6%) |
| 5 or more Vehicles | 155 (6.0%) | 124 (5.3%) |
| Total | 2,584 (100.0%) | 2,336 (100.0%) |
Commute Time in Summit View
The most frequently occuring commute durations in Summit View are 20 to 24 minutes (766 commuters, 16.6%), 15 to 19 minutes (688 commuters, 14.9%), and 30 to 34 minutes (630 commuters, 13.7%).
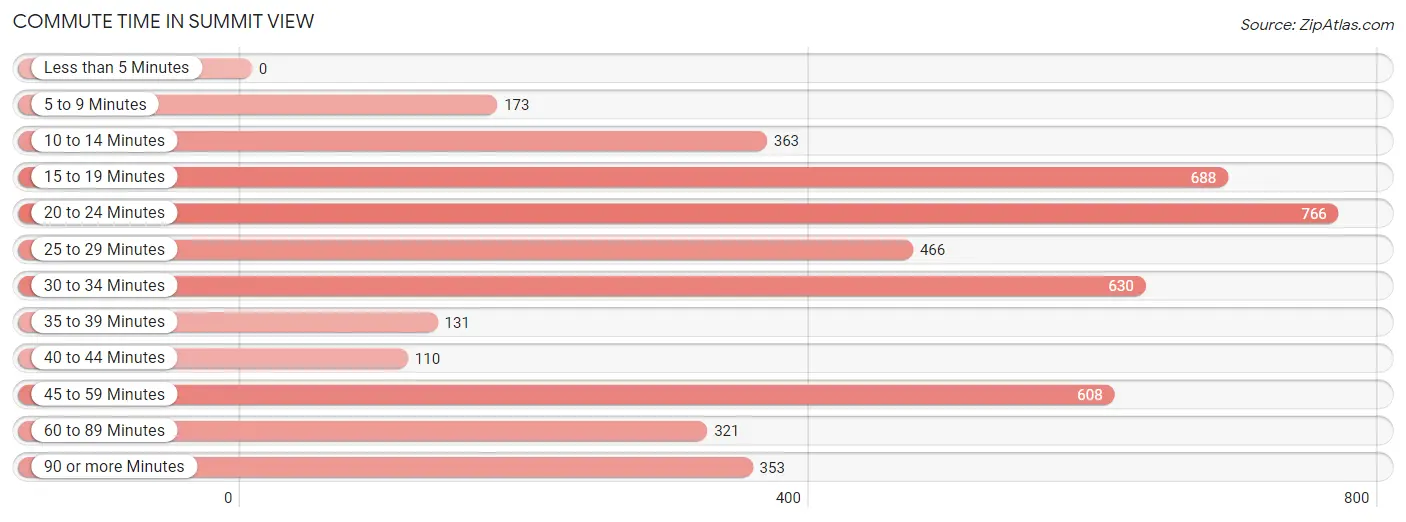
| Commute Time | # Commuters | % Commuters |
| Less than 5 Minutes | 0 | 0.0% |
| 5 to 9 Minutes | 173 | 3.7% |
| 10 to 14 Minutes | 363 | 7.9% |
| 15 to 19 Minutes | 688 | 14.9% |
| 20 to 24 Minutes | 766 | 16.6% |
| 25 to 29 Minutes | 466 | 10.1% |
| 30 to 34 Minutes | 630 | 13.7% |
| 35 to 39 Minutes | 131 | 2.8% |
| 40 to 44 Minutes | 110 | 2.4% |
| 45 to 59 Minutes | 608 | 13.2% |
| 60 to 89 Minutes | 321 | 7.0% |
| 90 or more Minutes | 353 | 7.7% |
Commute Time by Sex in Summit View
The most common commute times in Summit View are 30 to 34 minutes (420 commuters, 17.3%) for males and 20 to 24 minutes (529 commuters, 24.3%) for females.
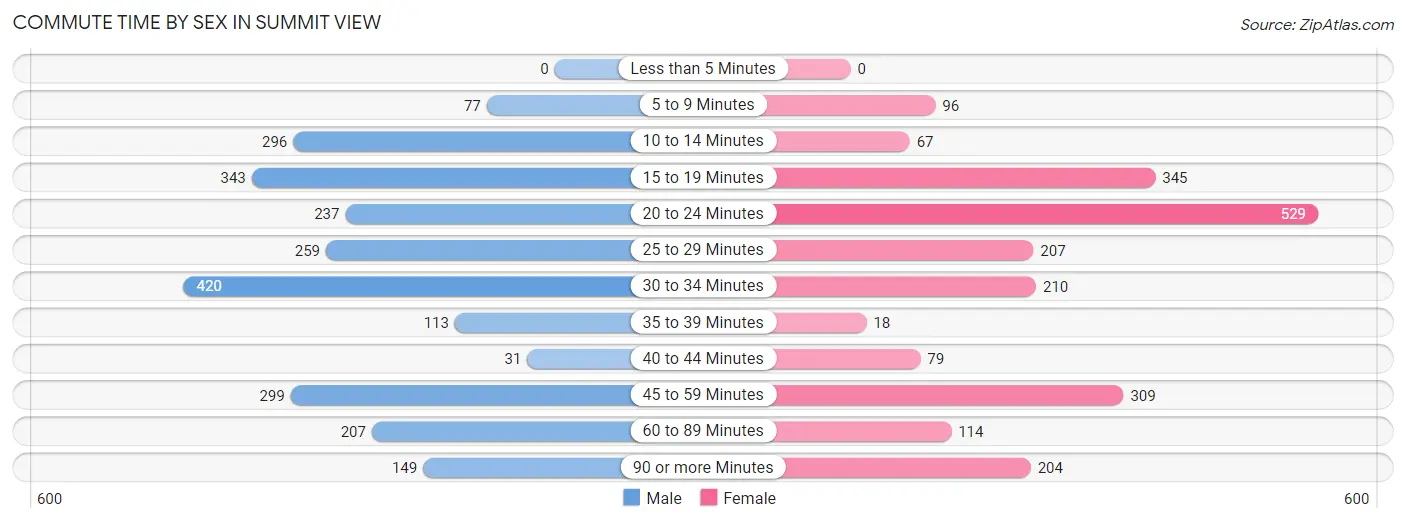
| Commute Time | Male | Female |
| Less than 5 Minutes | 0 (0.0%) | 0 (0.0%) |
| 5 to 9 Minutes | 77 (3.2%) | 96 (4.4%) |
| 10 to 14 Minutes | 296 (12.2%) | 67 (3.1%) |
| 15 to 19 Minutes | 343 (14.1%) | 345 (15.8%) |
| 20 to 24 Minutes | 237 (9.8%) | 529 (24.3%) |
| 25 to 29 Minutes | 259 (10.6%) | 207 (9.5%) |
| 30 to 34 Minutes | 420 (17.3%) | 210 (9.6%) |
| 35 to 39 Minutes | 113 (4.6%) | 18 (0.8%) |
| 40 to 44 Minutes | 31 (1.3%) | 79 (3.6%) |
| 45 to 59 Minutes | 299 (12.3%) | 309 (14.2%) |
| 60 to 89 Minutes | 207 (8.5%) | 114 (5.2%) |
| 90 or more Minutes | 149 (6.1%) | 204 (9.4%) |
Time of Departure to Work by Sex in Summit View
The most frequent times of departure to work in Summit View are 12:00 AM to 4:59 AM (361, 14.8%) for males and 4:00 PM to 11:59 PM (337, 15.5%) for females.
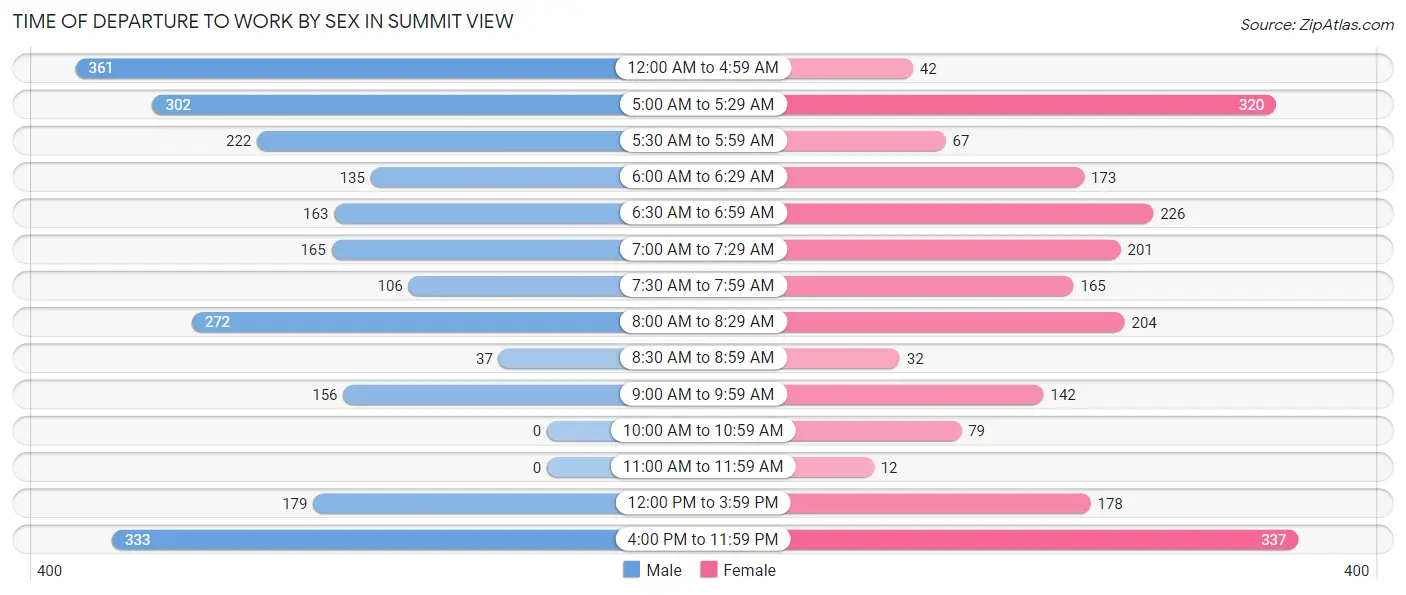
| Time of Departure | Male | Female |
| 12:00 AM to 4:59 AM | 361 (14.8%) | 42 (1.9%) |
| 5:00 AM to 5:29 AM | 302 (12.4%) | 320 (14.7%) |
| 5:30 AM to 5:59 AM | 222 (9.1%) | 67 (3.1%) |
| 6:00 AM to 6:29 AM | 135 (5.6%) | 173 (7.9%) |
| 6:30 AM to 6:59 AM | 163 (6.7%) | 226 (10.4%) |
| 7:00 AM to 7:29 AM | 165 (6.8%) | 201 (9.2%) |
| 7:30 AM to 7:59 AM | 106 (4.4%) | 165 (7.6%) |
| 8:00 AM to 8:29 AM | 272 (11.2%) | 204 (9.4%) |
| 8:30 AM to 8:59 AM | 37 (1.5%) | 32 (1.5%) |
| 9:00 AM to 9:59 AM | 156 (6.4%) | 142 (6.5%) |
| 10:00 AM to 10:59 AM | 0 (0.0%) | 79 (3.6%) |
| 11:00 AM to 11:59 AM | 0 (0.0%) | 12 (0.5%) |
| 12:00 PM to 3:59 PM | 179 (7.4%) | 178 (8.2%) |
| 4:00 PM to 11:59 PM | 333 (13.7%) | 337 (15.5%) |
| Total | 2,431 (100.0%) | 2,178 (100.0%) |
Housing Occupancy in Summit View
Occupancy by Ownership in Summit View
Of the total 3,200 dwellings in Summit View, owner-occupied units account for 1,846 (57.7%), while renter-occupied units make up 1,354 (42.3%).
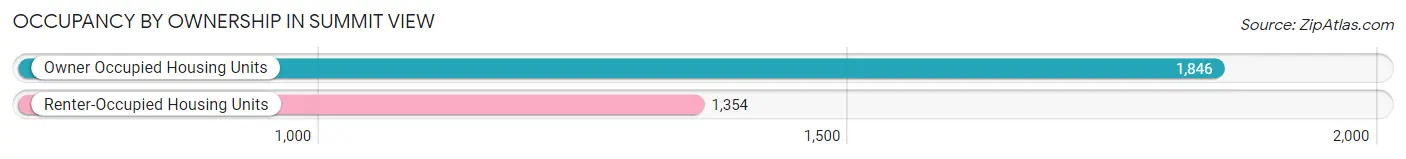
| Occupancy | # Housing Units | % Housing Units |
| Owner Occupied Housing Units | 1,846 | 57.7% |
| Renter-Occupied Housing Units | 1,354 | 42.3% |
| Total Occupied Housing Units | 3,200 | 100.0% |
Occupancy by Household Size in Summit View
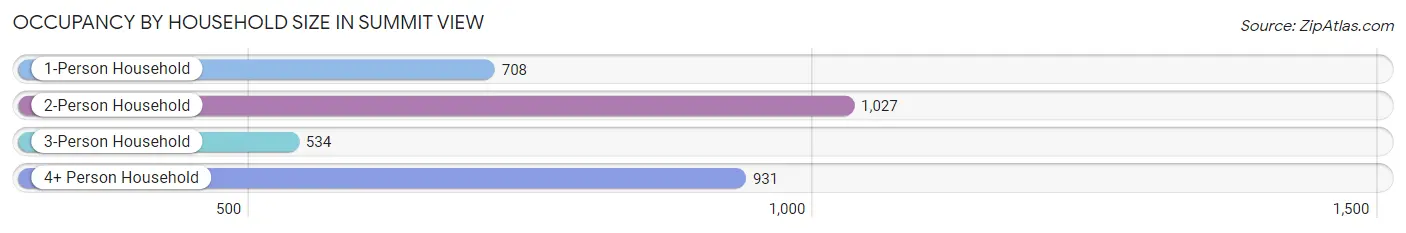
| Household Size | # Housing Units | % Housing Units |
| 1-Person Household | 708 | 22.1% |
| 2-Person Household | 1,027 | 32.1% |
| 3-Person Household | 534 | 16.7% |
| 4+ Person Household | 931 | 29.1% |
| Total Housing Units | 3,200 | 100.0% |
Occupancy by Ownership by Household Size in Summit View
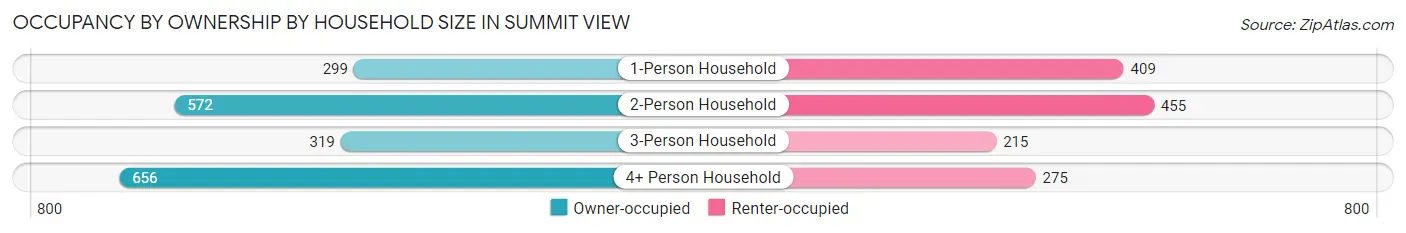
| Household Size | Owner-occupied | Renter-occupied |
| 1-Person Household | 299 (42.2%) | 409 (57.8%) |
| 2-Person Household | 572 (55.7%) | 455 (44.3%) |
| 3-Person Household | 319 (59.7%) | 215 (40.3%) |
| 4+ Person Household | 656 (70.5%) | 275 (29.5%) |
| Total Housing Units | 1,846 (57.7%) | 1,354 (42.3%) |
Occupancy by Educational Attainment in Summit View
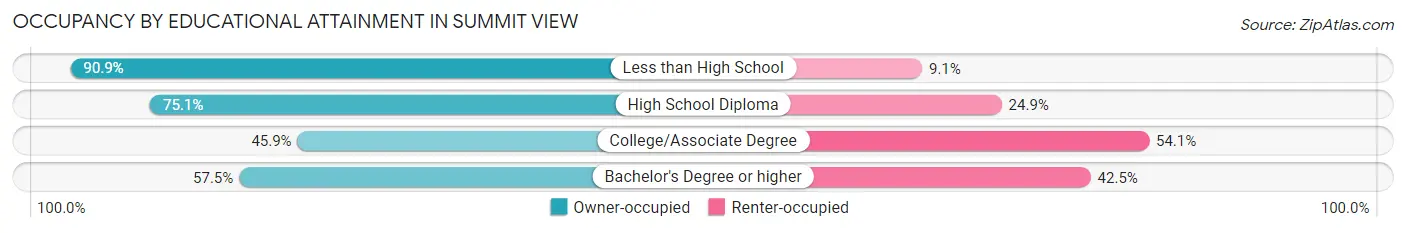
| Household Size | Owner-occupied | Renter-occupied |
| Less than High School | 80 (90.9%) | 8 (9.1%) |
| High School Diploma | 631 (75.1%) | 209 (24.9%) |
| College/Associate Degree | 677 (45.9%) | 798 (54.1%) |
| Bachelor's Degree or higher | 458 (57.5%) | 339 (42.5%) |
Occupancy by Age of Householder in Summit View
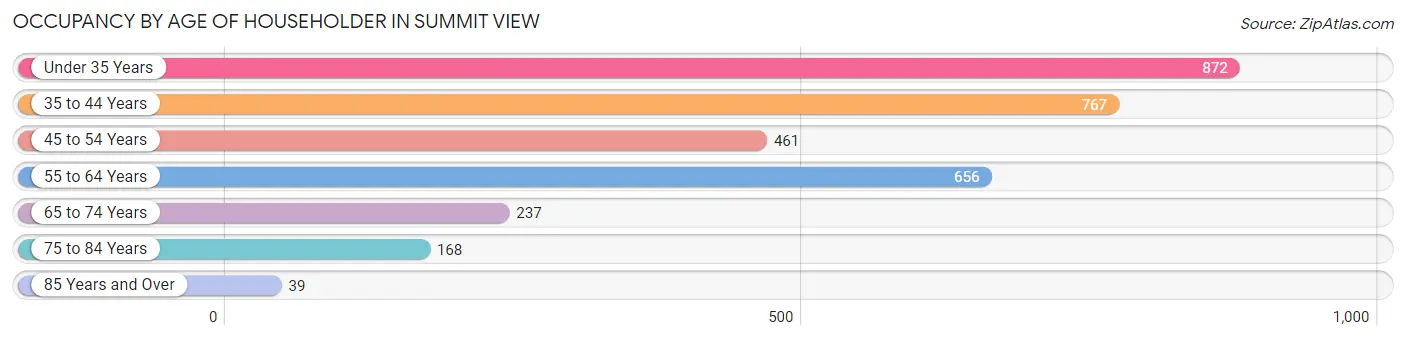
| Age Bracket | # Households | % Households |
| Under 35 Years | 872 | 27.3% |
| 35 to 44 Years | 767 | 24.0% |
| 45 to 54 Years | 461 | 14.4% |
| 55 to 64 Years | 656 | 20.5% |
| 65 to 74 Years | 237 | 7.4% |
| 75 to 84 Years | 168 | 5.2% |
| 85 Years and Over | 39 | 1.2% |
| Total | 3,200 | 100.0% |
Housing Finances in Summit View
Median Income by Occupancy in Summit View
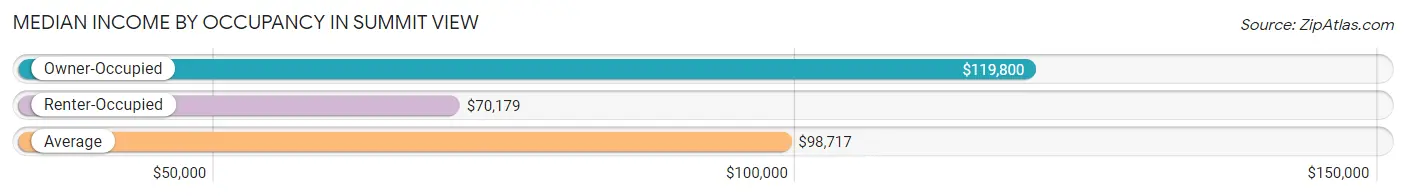
| Occupancy Type | # Households | Median Income |
| Owner-Occupied | 1,846 (57.7%) | $119,800 |
| Renter-Occupied | 1,354 (42.3%) | $70,179 |
| Average | 3,200 (100.0%) | $98,717 |
Occupancy by Householder Income Bracket in Summit View
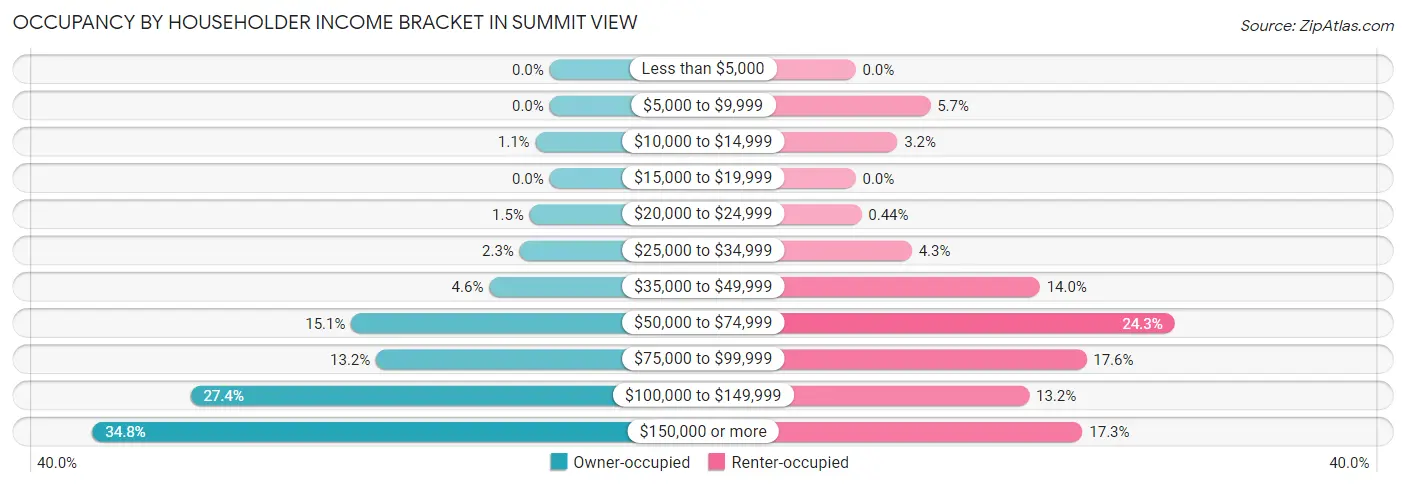
| Income Bracket | Owner-occupied | Renter-occupied |
| Less than $5,000 | 0 (0.0%) | 0 (0.0%) |
| $5,000 to $9,999 | 0 (0.0%) | 77 (5.7%) |
| $10,000 to $14,999 | 20 (1.1%) | 43 (3.2%) |
| $15,000 to $19,999 | 0 (0.0%) | 0 (0.0%) |
| $20,000 to $24,999 | 28 (1.5%) | 6 (0.4%) |
| $25,000 to $34,999 | 42 (2.3%) | 58 (4.3%) |
| $35,000 to $49,999 | 85 (4.6%) | 190 (14.0%) |
| $50,000 to $74,999 | 279 (15.1%) | 329 (24.3%) |
| $75,000 to $99,999 | 244 (13.2%) | 238 (17.6%) |
| $100,000 to $149,999 | 505 (27.4%) | 179 (13.2%) |
| $150,000 or more | 643 (34.8%) | 234 (17.3%) |
| Total | 1,846 (100.0%) | 1,354 (100.0%) |
Monthly Housing Cost Tiers in Summit View
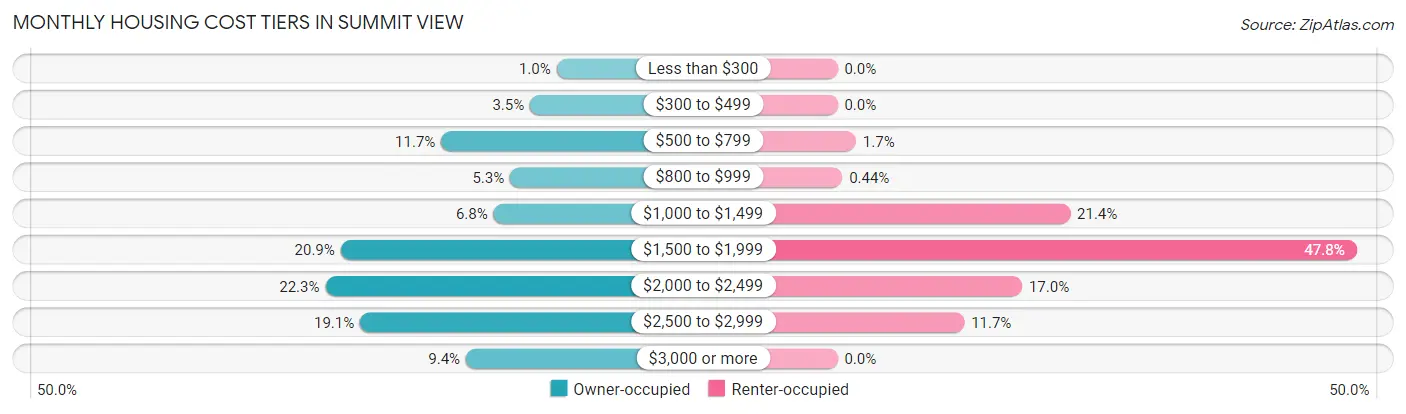
| Monthly Cost | Owner-occupied | Renter-occupied |
| Less than $300 | 19 (1.0%) | 0 (0.0%) |
| $300 to $499 | 64 (3.5%) | 0 (0.0%) |
| $500 to $799 | 215 (11.7%) | 23 (1.7%) |
| $800 to $999 | 98 (5.3%) | 6 (0.4%) |
| $1,000 to $1,499 | 126 (6.8%) | 290 (21.4%) |
| $1,500 to $1,999 | 386 (20.9%) | 647 (47.8%) |
| $2,000 to $2,499 | 412 (22.3%) | 230 (17.0%) |
| $2,500 to $2,999 | 353 (19.1%) | 158 (11.7%) |
| $3,000 or more | 173 (9.4%) | 0 (0.0%) |
| Total | 1,846 (100.0%) | 1,354 (100.0%) |
Physical Housing Characteristics in Summit View
Housing Structures in Summit View
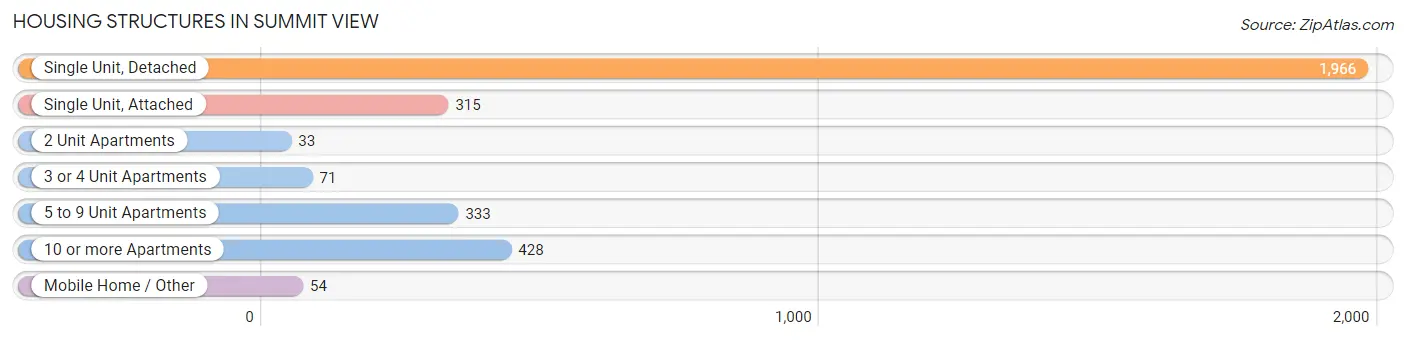
| Structure Type | # Housing Units | % Housing Units |
| Single Unit, Detached | 1,966 | 61.4% |
| Single Unit, Attached | 315 | 9.8% |
| 2 Unit Apartments | 33 | 1.0% |
| 3 or 4 Unit Apartments | 71 | 2.2% |
| 5 to 9 Unit Apartments | 333 | 10.4% |
| 10 or more Apartments | 428 | 13.4% |
| Mobile Home / Other | 54 | 1.7% |
| Total | 3,200 | 100.0% |
Housing Structures by Occupancy in Summit View
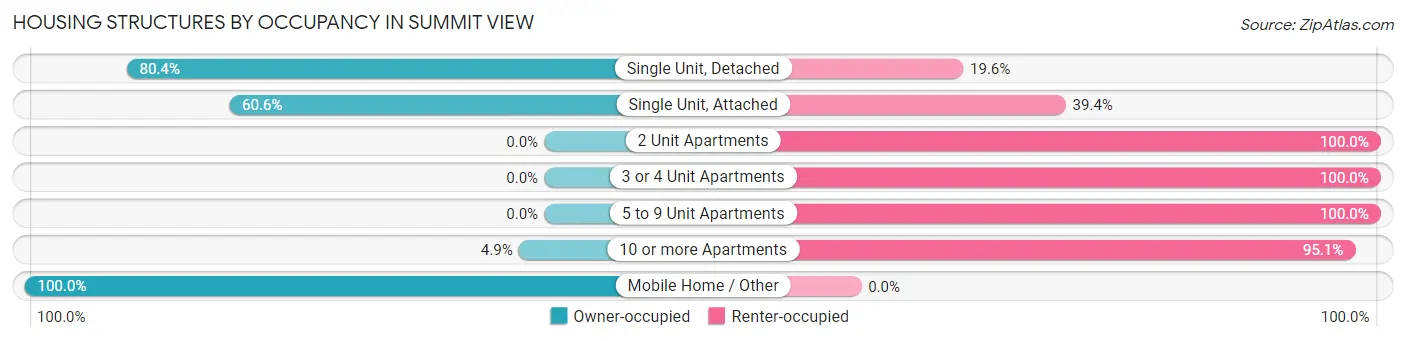
| Structure Type | Owner-occupied | Renter-occupied |
| Single Unit, Detached | 1,580 (80.4%) | 386 (19.6%) |
| Single Unit, Attached | 191 (60.6%) | 124 (39.4%) |
| 2 Unit Apartments | 0 (0.0%) | 33 (100.0%) |
| 3 or 4 Unit Apartments | 0 (0.0%) | 71 (100.0%) |
| 5 to 9 Unit Apartments | 0 (0.0%) | 333 (100.0%) |
| 10 or more Apartments | 21 (4.9%) | 407 (95.1%) |
| Mobile Home / Other | 54 (100.0%) | 0 (0.0%) |
| Total | 1,846 (57.7%) | 1,354 (42.3%) |
Housing Structures by Number of Rooms in Summit View
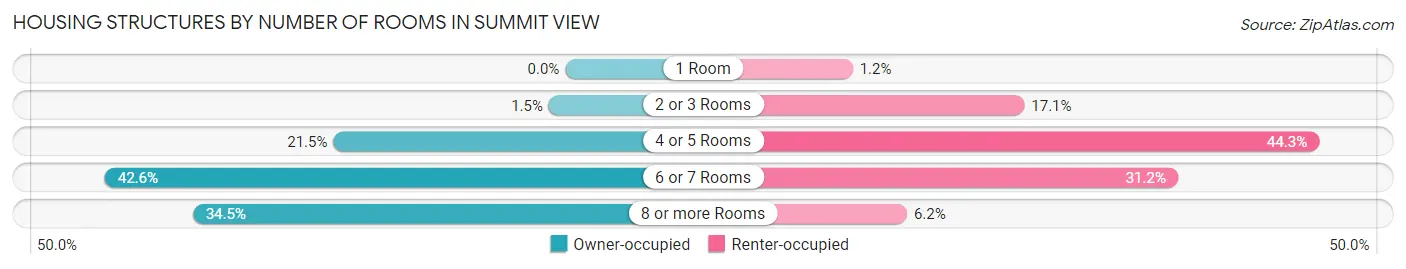
| Number of Rooms | Owner-occupied | Renter-occupied |
| 1 Room | 0 (0.0%) | 16 (1.2%) |
| 2 or 3 Rooms | 28 (1.5%) | 231 (17.1%) |
| 4 or 5 Rooms | 396 (21.4%) | 600 (44.3%) |
| 6 or 7 Rooms | 786 (42.6%) | 423 (31.2%) |
| 8 or more Rooms | 636 (34.4%) | 84 (6.2%) |
| Total | 1,846 (100.0%) | 1,354 (100.0%) |
Housing Structure by Heating Type in Summit View
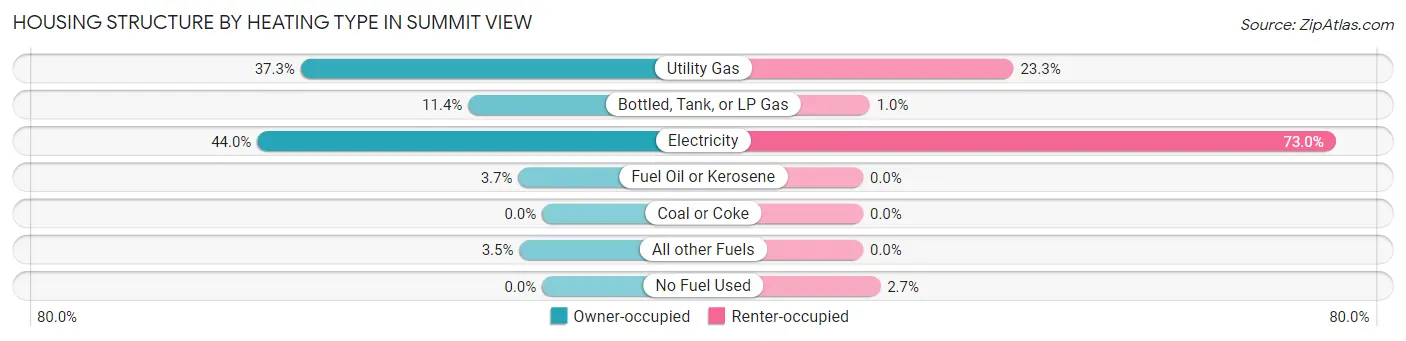
| Heating Type | Owner-occupied | Renter-occupied |
| Utility Gas | 689 (37.3%) | 315 (23.3%) |
| Bottled, Tank, or LP Gas | 211 (11.4%) | 14 (1.0%) |
| Electricity | 813 (44.0%) | 989 (73.0%) |
| Fuel Oil or Kerosene | 68 (3.7%) | 0 (0.0%) |
| Coal or Coke | 0 (0.0%) | 0 (0.0%) |
| All other Fuels | 65 (3.5%) | 0 (0.0%) |
| No Fuel Used | 0 (0.0%) | 36 (2.7%) |
| Total | 1,846 (100.0%) | 1,354 (100.0%) |
Household Vehicle Usage in Summit View
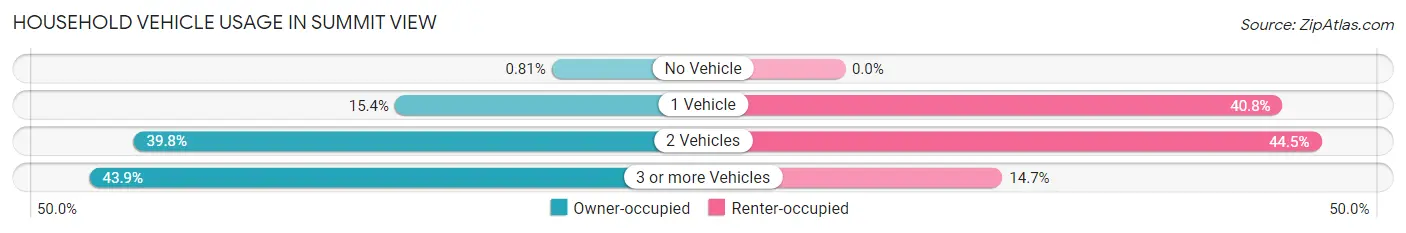
| Vehicles per Household | Owner-occupied | Renter-occupied |
| No Vehicle | 15 (0.8%) | 0 (0.0%) |
| 1 Vehicle | 285 (15.4%) | 553 (40.8%) |
| 2 Vehicles | 735 (39.8%) | 602 (44.5%) |
| 3 or more Vehicles | 811 (43.9%) | 199 (14.7%) |
| Total | 1,846 (100.0%) | 1,354 (100.0%) |
Real Estate & Mortgages in Summit View
Real Estate and Mortgage Overview in Summit View
| Characteristic | Without Mortgage | With Mortgage |
| Housing Units | 430 | 1,416 |
| Median Property Value | $443,400 | $416,300 |
| Median Household Income | $70,556 | $520 |
| Monthly Housing Costs | $676 | $173 |
| Real Estate Taxes | $4,809 | $21 |
Property Value by Mortgage Status in Summit View
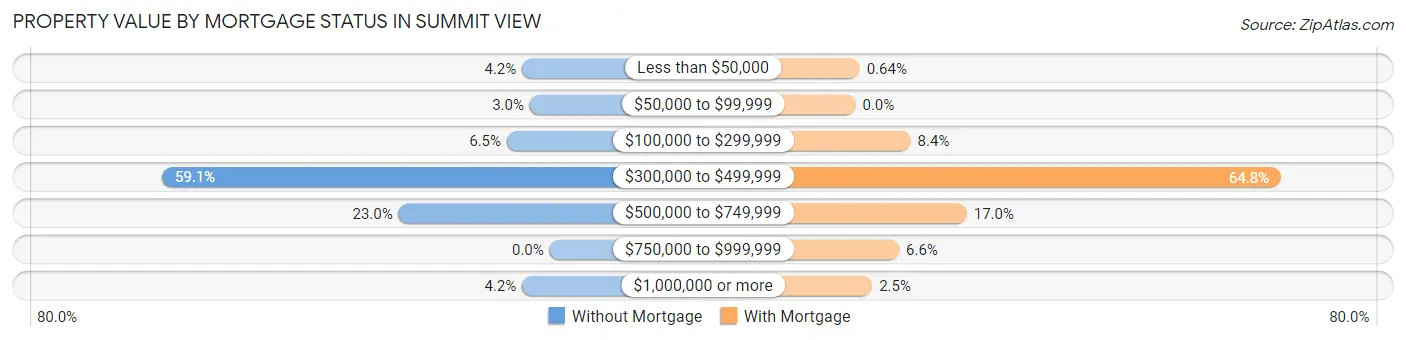
| Property Value | Without Mortgage | With Mortgage |
| Less than $50,000 | 18 (4.2%) | 9 (0.6%) |
| $50,000 to $99,999 | 13 (3.0%) | 0 (0.0%) |
| $100,000 to $299,999 | 28 (6.5%) | 119 (8.4%) |
| $300,000 to $499,999 | 254 (59.1%) | 918 (64.8%) |
| $500,000 to $749,999 | 99 (23.0%) | 240 (17.0%) |
| $750,000 to $999,999 | 0 (0.0%) | 94 (6.6%) |
| $1,000,000 or more | 18 (4.2%) | 36 (2.5%) |
| Total | 430 (100.0%) | 1,416 (100.0%) |
Household Income by Mortgage Status in Summit View
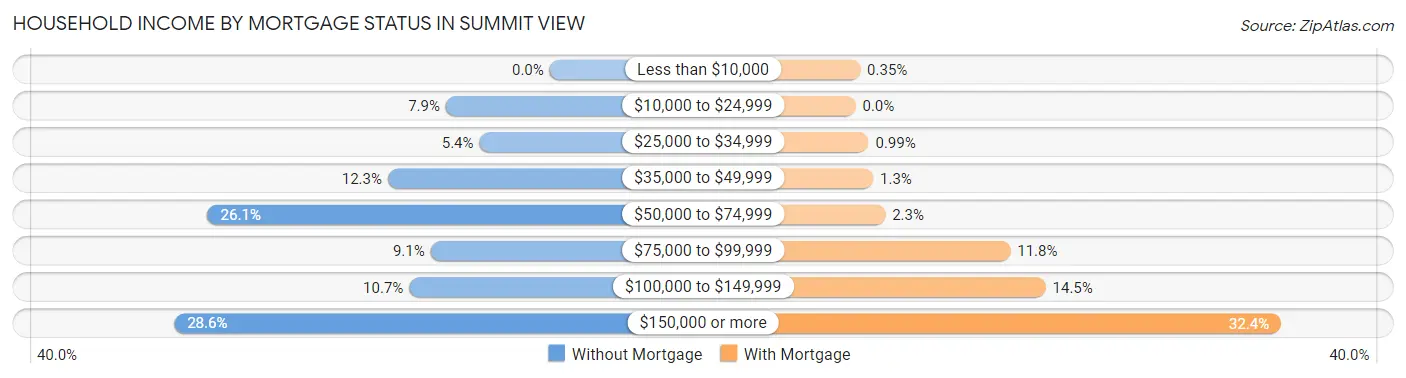
| Household Income | Without Mortgage | With Mortgage |
| Less than $10,000 | 0 (0.0%) | 5 (0.4%) |
| $10,000 to $24,999 | 34 (7.9%) | 0 (0.0%) |
| $25,000 to $34,999 | 23 (5.3%) | 14 (1.0%) |
| $35,000 to $49,999 | 53 (12.3%) | 19 (1.3%) |
| $50,000 to $74,999 | 112 (26.1%) | 32 (2.3%) |
| $75,000 to $99,999 | 39 (9.1%) | 167 (11.8%) |
| $100,000 to $149,999 | 46 (10.7%) | 205 (14.5%) |
| $150,000 or more | 123 (28.6%) | 459 (32.4%) |
| Total | 430 (100.0%) | 1,416 (100.0%) |
Property Value to Household Income Ratio in Summit View
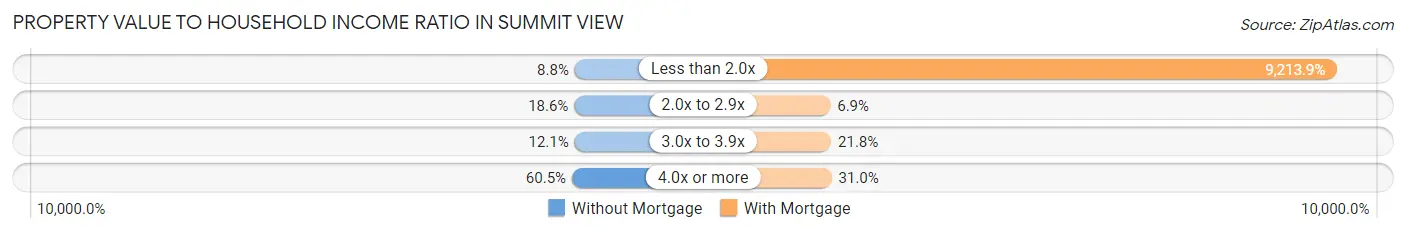
| Value-to-Income Ratio | Without Mortgage | With Mortgage |
| Less than 2.0x | 38 (8.8%) | 130,469 (9,213.9%) |
| 2.0x to 2.9x | 80 (18.6%) | 98 (6.9%) |
| 3.0x to 3.9x | 52 (12.1%) | 309 (21.8%) |
| 4.0x or more | 260 (60.5%) | 439 (31.0%) |
| Total | 430 (100.0%) | 1,416 (100.0%) |
Real Estate Taxes by Mortgage Status in Summit View
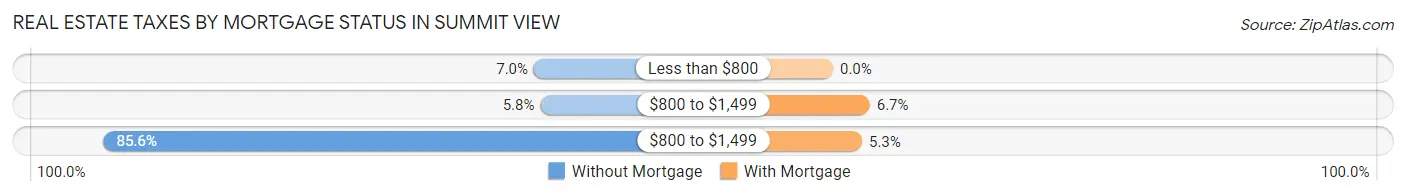
| Property Taxes | Without Mortgage | With Mortgage |
| Less than $800 | 30 (7.0%) | 0 (0.0%) |
| $800 to $1,499 | 25 (5.8%) | 95 (6.7%) |
| $800 to $1,499 | 368 (85.6%) | 75 (5.3%) |
| Total | 430 (100.0%) | 1,416 (100.0%) |
Health & Disability in Summit View
Health Insurance Coverage by Age in Summit View
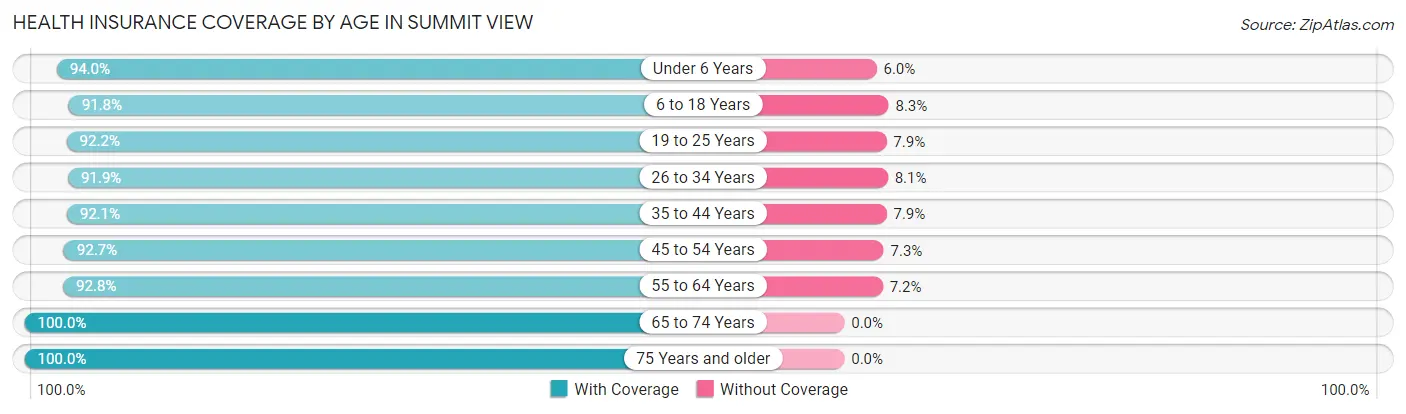
| Age Bracket | With Coverage | Without Coverage |
| Under 6 Years | 610 (94.0%) | 39 (6.0%) |
| 6 to 18 Years | 1,257 (91.7%) | 113 (8.3%) |
| 19 to 25 Years | 1,151 (92.1%) | 98 (7.9%) |
| 26 to 34 Years | 1,114 (91.9%) | 98 (8.1%) |
| 35 to 44 Years | 1,368 (92.1%) | 117 (7.9%) |
| 45 to 54 Years | 860 (92.7%) | 68 (7.3%) |
| 55 to 64 Years | 880 (92.8%) | 68 (7.2%) |
| 65 to 74 Years | 497 (100.0%) | 0 (0.0%) |
| 75 Years and older | 287 (100.0%) | 0 (0.0%) |
| Total | 8,024 (93.0%) | 601 (7.0%) |
Health Insurance Coverage by Citizenship Status in Summit View
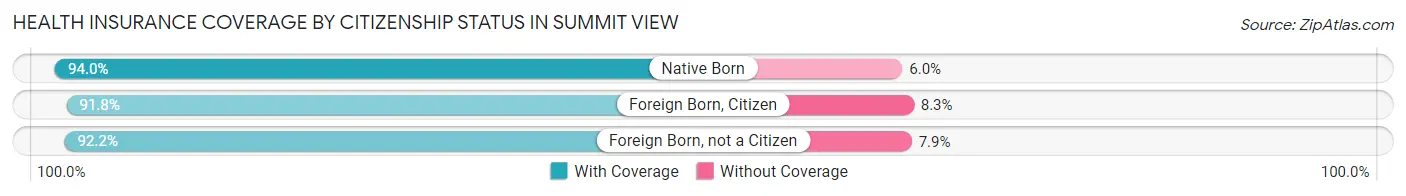
| Citizenship Status | With Coverage | Without Coverage |
| Native Born | 610 (94.0%) | 39 (6.0%) |
| Foreign Born, Citizen | 1,257 (91.7%) | 113 (8.3%) |
| Foreign Born, not a Citizen | 1,151 (92.1%) | 98 (7.9%) |
Health Insurance Coverage by Household Income in Summit View
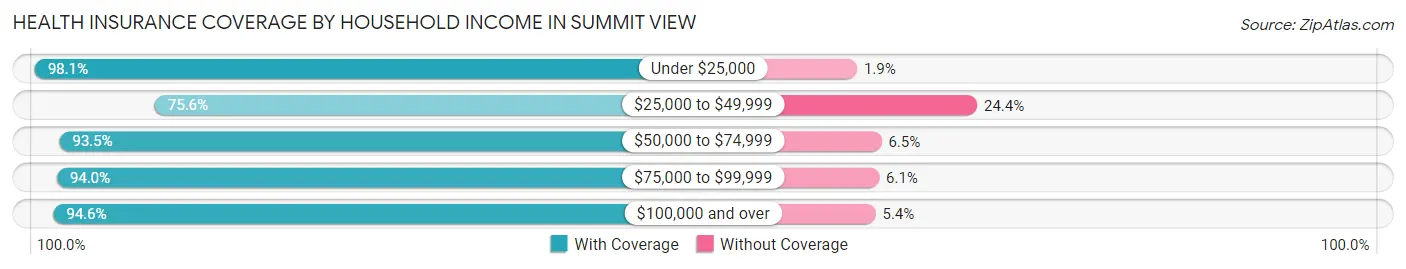
| Household Income | With Coverage | Without Coverage |
| Under $25,000 | 308 (98.1%) | 6 (1.9%) |
| $25,000 to $49,999 | 483 (75.6%) | 156 (24.4%) |
| $50,000 to $74,999 | 1,410 (93.5%) | 98 (6.5%) |
| $75,000 to $99,999 | 1,274 (94.0%) | 82 (6.0%) |
| $100,000 and over | 4,549 (94.6%) | 259 (5.4%) |
Public vs Private Health Insurance Coverage by Age in Summit View
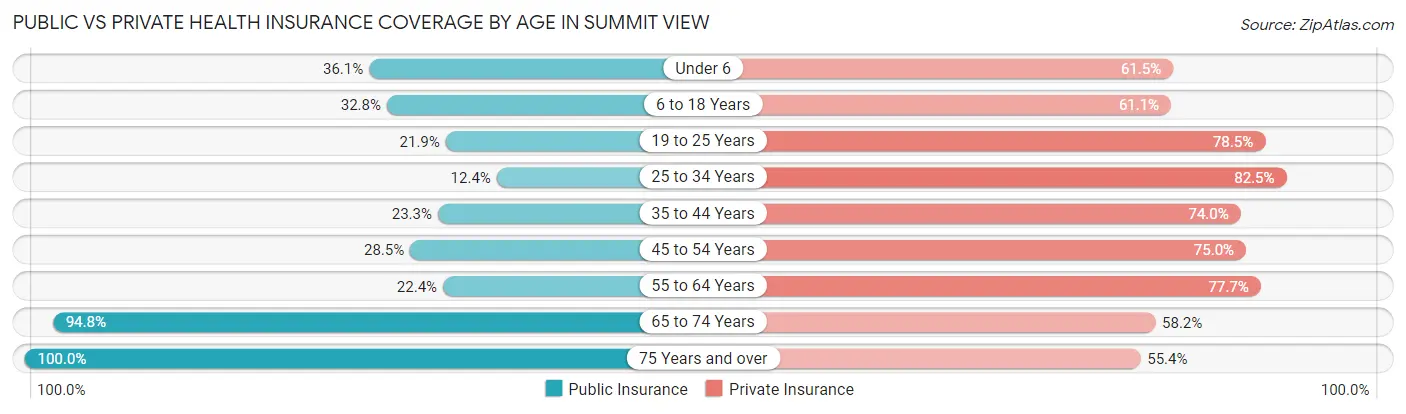
| Age Bracket | Public Insurance | Private Insurance |
| Under 6 | 234 (36.1%) | 399 (61.5%) |
| 6 to 18 Years | 449 (32.8%) | 837 (61.1%) |
| 19 to 25 Years | 273 (21.9%) | 981 (78.5%) |
| 25 to 34 Years | 150 (12.4%) | 1,000 (82.5%) |
| 35 to 44 Years | 346 (23.3%) | 1,099 (74.0%) |
| 45 to 54 Years | 264 (28.4%) | 696 (75.0%) |
| 55 to 64 Years | 212 (22.4%) | 737 (77.7%) |
| 65 to 74 Years | 471 (94.8%) | 289 (58.2%) |
| 75 Years and over | 287 (100.0%) | 159 (55.4%) |
| Total | 2,686 (31.1%) | 6,197 (71.9%) |
Disability Status by Sex by Age in Summit View
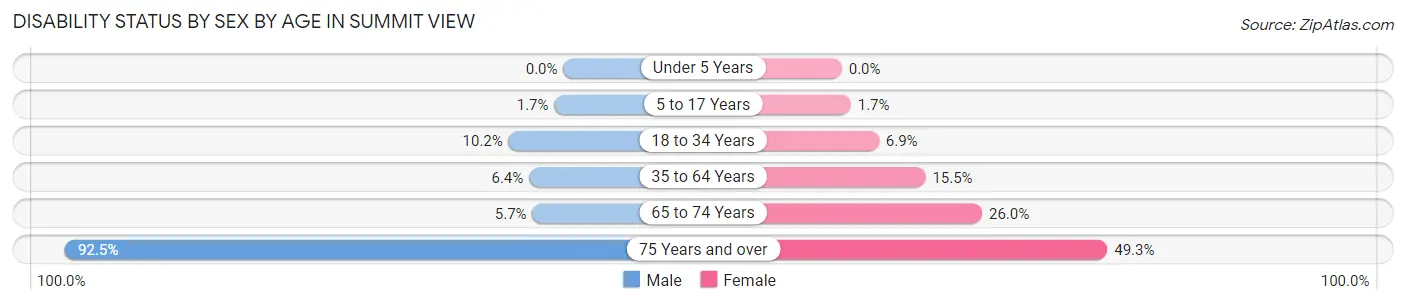
| Age Bracket | Male | Female |
| Under 5 Years | 0 (0.0%) | 0 (0.0%) |
| 5 to 17 Years | 10 (1.7%) | 11 (1.7%) |
| 18 to 34 Years | 130 (10.2%) | 94 (6.9%) |
| 35 to 64 Years | 106 (6.4%) | 263 (15.5%) |
| 65 to 74 Years | 12 (5.7%) | 75 (26.0%) |
| 75 Years and over | 74 (92.5%) | 102 (49.3%) |
Disability Class by Sex by Age in Summit View
Disability Class: Hearing Difficulty
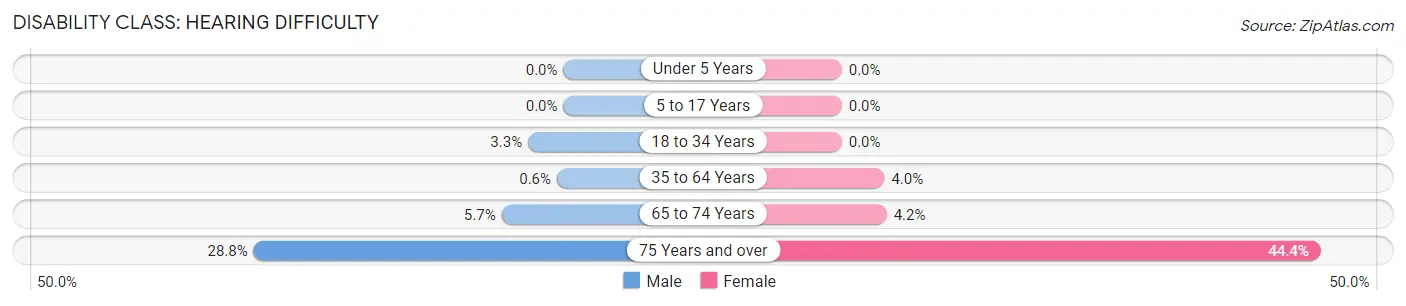
| Age Bracket | Male | Female |
| Under 5 Years | 0 (0.0%) | 0 (0.0%) |
| 5 to 17 Years | 0 (0.0%) | 0 (0.0%) |
| 18 to 34 Years | 42 (3.3%) | 0 (0.0%) |
| 35 to 64 Years | 10 (0.6%) | 67 (4.0%) |
| 65 to 74 Years | 12 (5.7%) | 12 (4.2%) |
| 75 Years and over | 23 (28.7%) | 92 (44.4%) |
Disability Class: Vision Difficulty
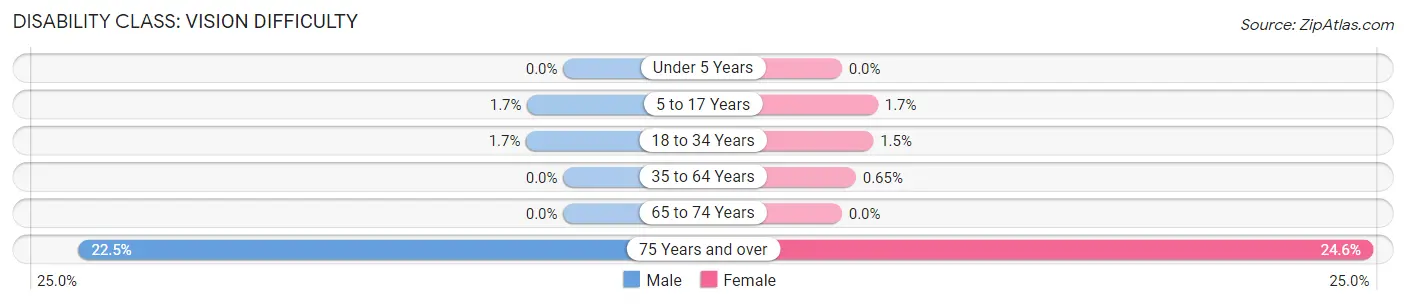
| Age Bracket | Male | Female |
| Under 5 Years | 0 (0.0%) | 0 (0.0%) |
| 5 to 17 Years | 10 (1.7%) | 11 (1.7%) |
| 18 to 34 Years | 22 (1.7%) | 20 (1.5%) |
| 35 to 64 Years | 0 (0.0%) | 11 (0.6%) |
| 65 to 74 Years | 0 (0.0%) | 0 (0.0%) |
| 75 Years and over | 18 (22.5%) | 51 (24.6%) |
Disability Class: Cognitive Difficulty
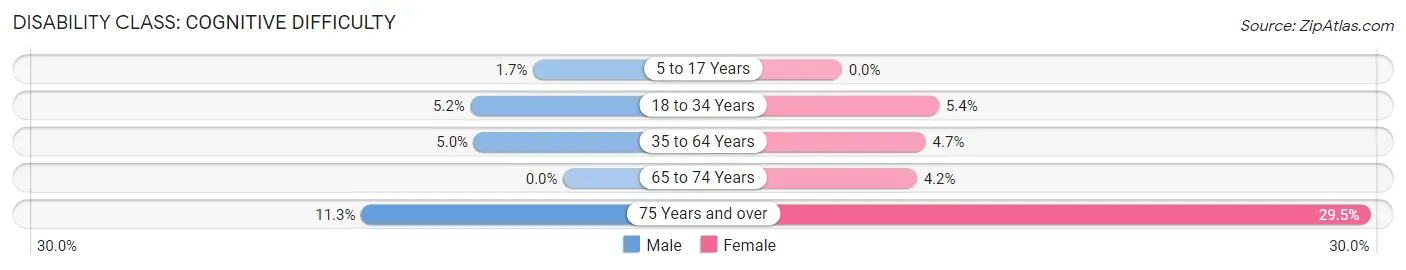
| Age Bracket | Male | Female |
| 5 to 17 Years | 10 (1.7%) | 0 (0.0%) |
| 18 to 34 Years | 66 (5.2%) | 74 (5.4%) |
| 35 to 64 Years | 83 (5.0%) | 79 (4.7%) |
| 65 to 74 Years | 0 (0.0%) | 12 (4.2%) |
| 75 Years and over | 9 (11.3%) | 61 (29.5%) |
Disability Class: Ambulatory Difficulty
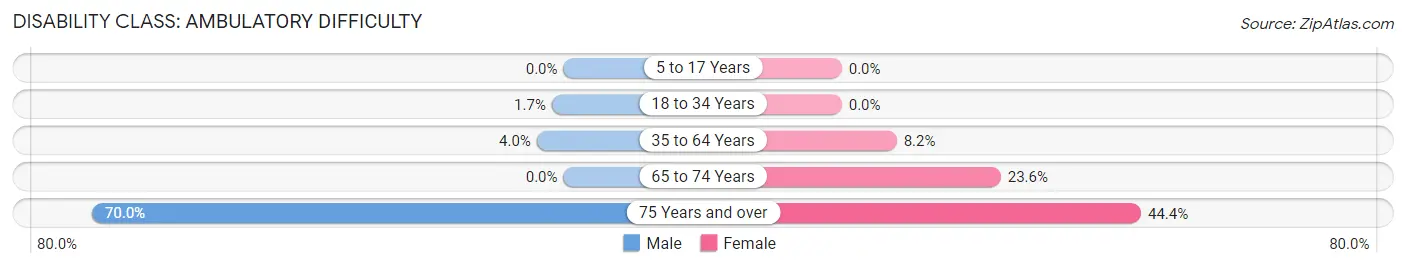
| Age Bracket | Male | Female |
| 5 to 17 Years | 0 (0.0%) | 0 (0.0%) |
| 18 to 34 Years | 22 (1.7%) | 0 (0.0%) |
| 35 to 64 Years | 66 (4.0%) | 138 (8.2%) |
| 65 to 74 Years | 0 (0.0%) | 68 (23.6%) |
| 75 Years and over | 56 (70.0%) | 92 (44.4%) |
Disability Class: Self-Care Difficulty
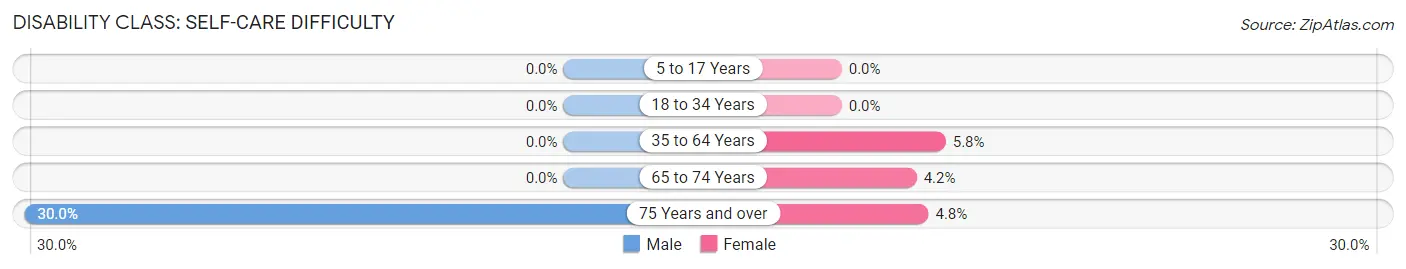
| Age Bracket | Male | Female |
| 5 to 17 Years | 0 (0.0%) | 0 (0.0%) |
| 18 to 34 Years | 0 (0.0%) | 0 (0.0%) |
| 35 to 64 Years | 0 (0.0%) | 98 (5.8%) |
| 65 to 74 Years | 0 (0.0%) | 12 (4.2%) |
| 75 Years and over | 24 (30.0%) | 10 (4.8%) |
Technology Access in Summit View
Computing Device Access in Summit View
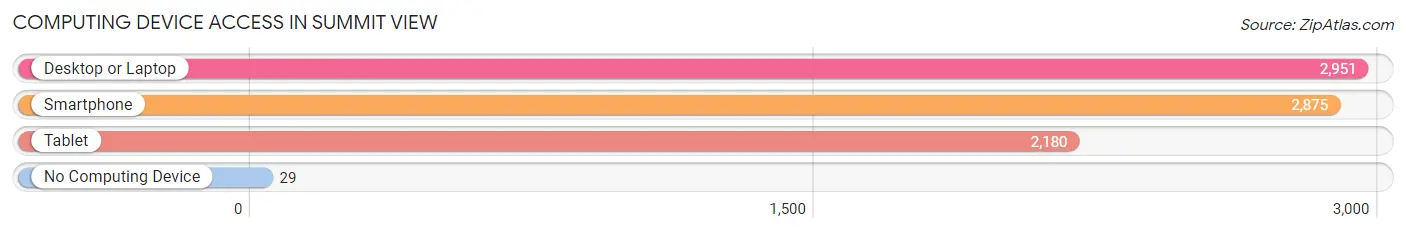
| Device Type | # Households | % Households |
| Desktop or Laptop | 2,951 | 92.2% |
| Smartphone | 2,875 | 89.8% |
| Tablet | 2,180 | 68.1% |
| No Computing Device | 29 | 0.9% |
| Total | 3,200 | 100.0% |
Internet Access in Summit View
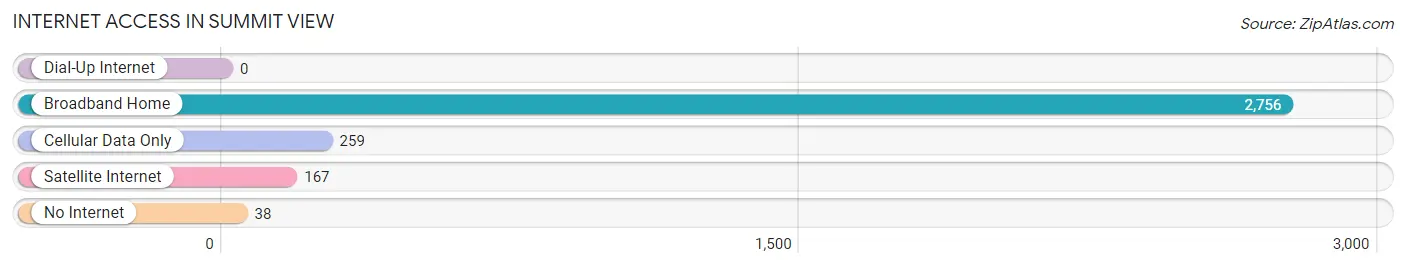
| Internet Type | # Households | % Households |
| Dial-Up Internet | 0 | 0.0% |
| Broadband Home | 2,756 | 86.1% |
| Cellular Data Only | 259 | 8.1% |
| Satellite Internet | 167 | 5.2% |
| No Internet | 38 | 1.2% |
| Total | 3,200 | 100.0% |
Summit View Summary
Summit View is a small city located in the state of Washington, United States. It is situated in the foothills of the Cascade Mountains, about 25 miles east of Seattle. The city has a population of approximately 8,000 people and is part of the greater Seattle metropolitan area.
History
The area that is now Summit View was first settled in the late 1800s by homesteaders and loggers. The first post office was established in 1891 and the city was officially incorporated in 1909. The city was named after the nearby summit of the Cascade Mountains, which can be seen from the city.
In the early 1900s, the city was a popular destination for tourists and outdoor enthusiasts. The city was home to several resorts and lodges, as well as a popular ski area. The city also had a thriving logging industry, which provided jobs for many of the residents.
In the 1950s, the city began to experience a decline in population as people moved away to larger cities. The city was also affected by the decline of the logging industry. In the 1970s, the city began to experience a resurgence as people began to move back to the area. The city has since become a popular destination for outdoor recreation and is home to several parks and trails.
Geography
Summit View is located in the foothills of the Cascade Mountains, about 25 miles east of Seattle. The city is situated at an elevation of 1,000 feet and is surrounded by forests and mountains. The city is located in King County and is part of the greater Seattle metropolitan area.
The city has a total area of 4.2 square miles, of which 4.1 square miles is land and 0.1 square miles is water. The city is located in a temperate climate, with mild winters and warm summers.
Economy
The economy of Summit View is largely based on tourism and outdoor recreation. The city is home to several parks and trails, as well as a popular ski area. The city also has a thriving retail sector, with several shops and restaurants.
The city is also home to several technology companies, including Microsoft and Amazon. These companies provide jobs for many of the city’s residents.
Demographics
As of the 2010 census, the population of Summit View was 8,000. The city has a median age of 38.7 years and a median household income of $63,000. The city is predominantly white, with a population that is 87.3% white, 5.2% Hispanic or Latino, 3.2% Asian, and 2.3% African American.
Conclusion
Summit View is a small city located in the state of Washington, United States. It is situated in the foothills of the Cascade Mountains, about 25 miles east of Seattle. The city has a population of approximately 8,000 people and is part of the greater Seattle metropolitan area. The city is a popular destination for outdoor recreation and is home to several parks and trails. The economy of Summit View is largely based on tourism and outdoor recreation, as well as technology companies such as Microsoft and Amazon. The city has a predominantly white population, with a median age of 38.7 years and a median household income of $63,000.
Common Questions
What is Per Capita Income in Summit View?
Per Capita income in Summit View is $43,501.
What is the Median Family Income in Summit View?
Median Family Income in Summit View is $114,926.
What is the Median Household income in Summit View?
Median Household Income in Summit View is $98,717.
What is Income or Wage Gap in Summit View?
Income or Wage Gap in Summit View is 37.9%.
Women in Summit View earn 62.1 cents for every dollar earned by a man.
What is Inequality or Gini Index in Summit View?
Inequality or Gini Index in Summit View is 0.39.
What is the Total Population of Summit View?
Total Population of Summit View is 8,748.
What is the Total Male Population of Summit View?
Total Male Population of Summit View is 4,250.
What is the Total Female Population of Summit View?
Total Female Population of Summit View is 4,498.
What is the Ratio of Males per 100 Females in Summit View?
There are 94.49 Males per 100 Females in Summit View.
What is the Ratio of Females per 100 Males in Summit View?
There are 105.84 Females per 100 Males in Summit View.
What is the Median Population Age in Summit View?
Median Population Age in Summit View is 33.5 Years.
What is the Average Family Size in Summit View
Average Family Size in Summit View is 3.2 People.
What is the Average Household Size in Summit View
Average Household Size in Summit View is 2.7 People.
How Large is the Labor Force in Summit View?
There are 5,356 People in the Labor Forcein in Summit View.
What is the Percentage of People in the Labor Force in Summit View?
75.6% of People are in the Labor Force in Summit View.
What is the Unemployment Rate in Summit View?
Unemployment Rate in Summit View is 6.8%.