Cities with the Lowest Poverty Level in Washington
RELATED REPORTS & OPTIONS
Lowest Poverty
Washington
Compare Cities
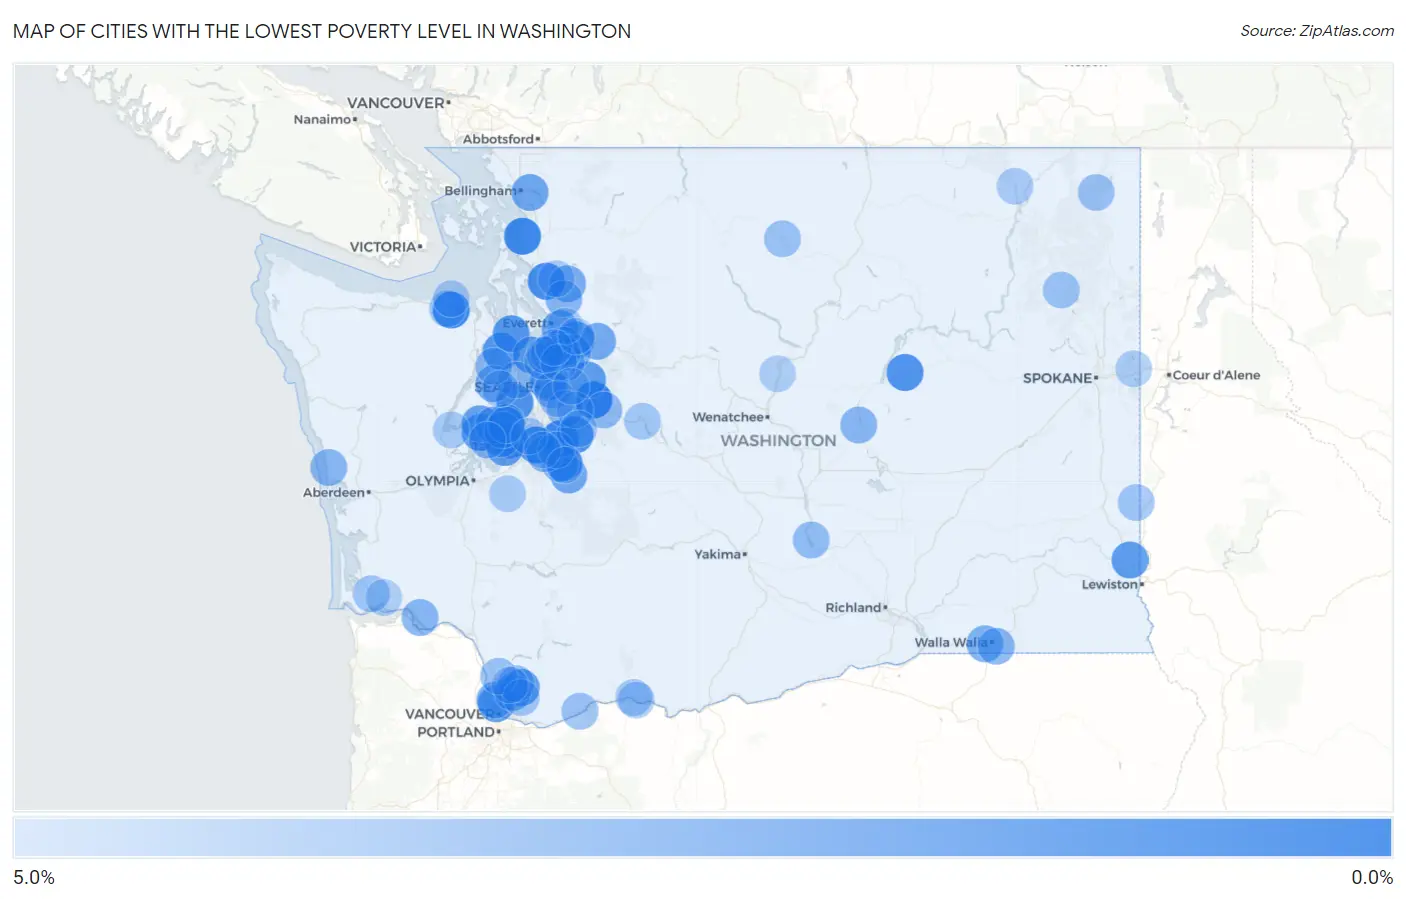
Map of Cities with the Lowest Poverty Level in Washington
5.0%
0.0%
Cities with the Lowest Poverty Level in Washington
| City | Poverty | vs State | vs National | |
| 1. | Snoqualmie | 0.31% | 9.9%(-9.58)#1 | 12.5%(-12.2)#54 |
| 2. | Clear Lake Cdp Pierce County | 0.35% | 9.9%(-9.55)#2 | 12.5%(-12.2)#64 |
| 3. | Lake Holm | 0.47% | 9.9%(-9.43)#3 | 12.5%(-12.1)#108 |
| 4. | Bay View | 0.47% | 9.9%(-9.42)#4 | 12.5%(-12.1)#116 |
| 5. | Bell Hill | 0.56% | 9.9%(-9.34)#5 | 12.5%(-12.0)#137 |
| 6. | Fife Heights | 0.57% | 9.9%(-9.32)#6 | 12.5%(-12.0)#145 |
| 7. | Riverpoint | 0.62% | 9.9%(-9.27)#7 | 12.5%(-11.9)#166 |
| 8. | Sunday Lake | 0.69% | 9.9%(-9.21)#8 | 12.5%(-11.8)#199 |
| 9. | Black Diamond | 0.94% | 9.9%(-8.96)#9 | 12.5%(-11.6)#330 |
| 10. | Hartline | 0.99% | 9.9%(-8.91)#10 | 12.5%(-11.5)#355 |
| 11. | Lofall | 1.0% | 9.9%(-8.85)#11 | 12.5%(-11.5)#378 |
| 12. | Southworth | 1.2% | 9.9%(-8.72)#12 | 12.5%(-11.4)#472 |
| 13. | Prairie Heights | 1.3% | 9.9%(-8.62)#13 | 12.5%(-11.3)#544 |
| 14. | Purdy | 1.3% | 9.9%(-8.56)#14 | 12.5%(-11.2)#579 |
| 15. | Hansville | 1.4% | 9.9%(-8.54)#15 | 12.5%(-11.2)#594 |
| 16. | Wollochet | 1.4% | 9.9%(-8.53)#16 | 12.5%(-11.2)#604 |
| 17. | Carnation | 1.4% | 9.9%(-8.50)#17 | 12.5%(-11.1)#623 |
| 18. | Venersborg | 1.4% | 9.9%(-8.47)#18 | 12.5%(-11.1)#652 |
| 19. | Woodway | 1.4% | 9.9%(-8.45)#19 | 12.5%(-11.1)#675 |
| 20. | Colton | 1.5% | 9.9%(-8.43)#20 | 12.5%(-11.1)#684 |
| 21. | Fox Island | 1.5% | 9.9%(-8.40)#21 | 12.5%(-11.0)#701 |
| 22. | Monroe North | 1.6% | 9.9%(-8.30)#22 | 12.5%(-10.9)#785 |
| 23. | Grapeview | 1.6% | 9.9%(-8.30)#23 | 12.5%(-10.9)#786 |
| 24. | Lake Shore | 1.6% | 9.9%(-8.26)#24 | 12.5%(-10.9)#827 |
| 25. | Allyn | 1.8% | 9.9%(-8.11)#25 | 12.5%(-10.7)#946 |
| 26. | Fobes Hill | 1.8% | 9.9%(-8.10)#26 | 12.5%(-10.7)#948 |
| 27. | Artondale | 1.9% | 9.9%(-7.95)#27 | 12.5%(-10.6)#1,084 |
| 28. | Geneva | 2.0% | 9.9%(-7.93)#28 | 12.5%(-10.6)#1,103 |
| 29. | Cathcart | 2.0% | 9.9%(-7.90)#29 | 12.5%(-10.5)#1,131 |
| 30. | Carbonado | 2.0% | 9.9%(-7.90)#30 | 12.5%(-10.5)#1,134 |
| 31. | Clyde Hill | 2.1% | 9.9%(-7.84)#31 | 12.5%(-10.5)#1,203 |
| 32. | Sultan | 2.1% | 9.9%(-7.82)#32 | 12.5%(-10.5)#1,221 |
| 33. | Stansberry Lake | 2.2% | 9.9%(-7.74)#33 | 12.5%(-10.4)#1,299 |
| 34. | Felida | 2.2% | 9.9%(-7.70)#34 | 12.5%(-10.3)#1,346 |
| 35. | Arlington Heights | 2.2% | 9.9%(-7.67)#35 | 12.5%(-10.3)#1,380 |
| 36. | Chico | 2.2% | 9.9%(-7.65)#36 | 12.5%(-10.3)#1,391 |
| 37. | Rosedale | 2.3% | 9.9%(-7.63)#37 | 12.5%(-10.3)#1,404 |
| 38. | Meadow Glade | 2.3% | 9.9%(-7.60)#38 | 12.5%(-10.2)#1,442 |
| 39. | Canterwood | 2.3% | 9.9%(-7.56)#39 | 12.5%(-10.2)#1,487 |
| 40. | Tehaleh | 2.4% | 9.9%(-7.51)#40 | 12.5%(-10.1)#1,541 |
| 41. | Garrett | 2.4% | 9.9%(-7.49)#41 | 12.5%(-10.1)#1,564 |
| 42. | Clearview | 2.6% | 9.9%(-7.34)#42 | 12.5%(-9.98)#1,733 |
| 43. | Bothell East | 2.6% | 9.9%(-7.34)#43 | 12.5%(-9.98)#1,735 |
| 44. | High Bridge | 2.6% | 9.9%(-7.31)#44 | 12.5%(-9.95)#1,772 |
| 45. | Cottage Lake | 2.6% | 9.9%(-7.26)#45 | 12.5%(-9.90)#1,821 |
| 46. | Prairie Ridge | 2.7% | 9.9%(-7.24)#46 | 12.5%(-9.88)#1,843 |
| 47. | North Puyallup | 2.7% | 9.9%(-7.24)#47 | 12.5%(-9.88)#1,844 |
| 48. | Home | 2.7% | 9.9%(-7.24)#48 | 12.5%(-9.87)#1,855 |
| 49. | Walla Walla East | 2.7% | 9.9%(-7.21)#49 | 12.5%(-9.85)#1,882 |
| 50. | Lower Elochoman | 2.7% | 9.9%(-7.20)#50 | 12.5%(-9.84)#1,890 |
| 51. | Sisco Heights | 2.7% | 9.9%(-7.20)#51 | 12.5%(-9.84)#1,892 |
| 52. | Medina | 2.7% | 9.9%(-7.19)#52 | 12.5%(-9.83)#1,895 |
| 53. | Beaux Arts Village | 2.7% | 9.9%(-7.18)#53 | 12.5%(-9.82)#1,909 |
| 54. | Lakeview | 2.7% | 9.9%(-7.18)#54 | 12.5%(-9.81)#1,918 |
| 55. | Copalis Beach | 2.7% | 9.9%(-7.17)#55 | 12.5%(-9.80)#1,930 |
| 56. | East Renton Highlands | 2.9% | 9.9%(-7.03)#56 | 12.5%(-9.67)#2,088 |
| 57. | Bainbridge Island | 2.9% | 9.9%(-6.95)#57 | 12.5%(-9.59)#2,175 |
| 58. | Riverbend | 3.0% | 9.9%(-6.91)#58 | 12.5%(-9.55)#2,221 |
| 59. | Lewisville | 3.0% | 9.9%(-6.86)#59 | 12.5%(-9.50)#2,269 |
| 60. | Mirrormont | 3.0% | 9.9%(-6.86)#60 | 12.5%(-9.49)#2,278 |
| 61. | Desert Aire | 3.1% | 9.9%(-6.84)#61 | 12.5%(-9.48)#2,295 |
| 62. | Maltby | 3.1% | 9.9%(-6.84)#62 | 12.5%(-9.48)#2,297 |
| 63. | Lake Tapps | 3.1% | 9.9%(-6.83)#63 | 12.5%(-9.47)#2,300 |
| 64. | Bangor Base | 3.1% | 9.9%(-6.75)#64 | 12.5%(-9.39)#2,400 |
| 65. | Ione | 3.2% | 9.9%(-6.68)#65 | 12.5%(-9.32)#2,501 |
| 66. | Winthrop | 3.2% | 9.9%(-6.67)#66 | 12.5%(-9.31)#2,514 |
| 67. | North Bonneville | 3.2% | 9.9%(-6.67)#67 | 12.5%(-9.31)#2,521 |
| 68. | Lake Forest Park | 3.2% | 9.9%(-6.66)#68 | 12.5%(-9.30)#2,530 |
| 69. | Valley | 3.3% | 9.9%(-6.64)#69 | 12.5%(-9.27)#2,554 |
| 70. | La Center | 3.3% | 9.9%(-6.59)#70 | 12.5%(-9.22)#2,627 |
| 71. | Bothell West | 3.3% | 9.9%(-6.58)#71 | 12.5%(-9.21)#2,643 |
| 72. | Naselle | 3.3% | 9.9%(-6.56)#72 | 12.5%(-9.20)#2,671 |
| 73. | Palouse | 3.3% | 9.9%(-6.56)#73 | 12.5%(-9.19)#2,673 |
| 74. | Newcastle | 3.4% | 9.9%(-6.53)#74 | 12.5%(-9.17)#2,707 |
| 75. | Lexington | 3.4% | 9.9%(-6.50)#75 | 12.5%(-9.14)#2,744 |
| 76. | Hockinson | 3.4% | 9.9%(-6.46)#76 | 12.5%(-9.10)#2,791 |
| 77. | White Salmon | 3.5% | 9.9%(-6.42)#77 | 12.5%(-9.06)#2,849 |
| 78. | Rocky Point | 3.5% | 9.9%(-6.40)#78 | 12.5%(-9.04)#2,869 |
| 79. | River Road | 3.5% | 9.9%(-6.40)#79 | 12.5%(-9.03)#2,880 |
| 80. | Ravensdale | 3.6% | 9.9%(-6.33)#80 | 12.5%(-8.97)#2,988 |
| 81. | Snoqualmie Pass | 3.6% | 9.9%(-6.32)#81 | 12.5%(-8.96)#3,001 |
| 82. | Dash Point | 3.6% | 9.9%(-6.32)#82 | 12.5%(-8.96)#3,016 |
| 83. | Brier | 3.6% | 9.9%(-6.32)#83 | 12.5%(-8.96)#3,017 |
| 84. | North Yelm | 3.7% | 9.9%(-6.22)#84 | 12.5%(-8.86)#3,161 |
| 85. | Jamestown | 3.7% | 9.9%(-6.22)#85 | 12.5%(-8.85)#3,169 |
| 86. | Union | 3.7% | 9.9%(-6.20)#86 | 12.5%(-8.84)#3,180 |
| 87. | Barstow | 3.7% | 9.9%(-6.19)#87 | 12.5%(-8.83)#3,198 |
| 88. | Bryant | 3.7% | 9.9%(-6.18)#88 | 12.5%(-8.82)#3,213 |
| 89. | Cherry Grove | 3.7% | 9.9%(-6.17)#89 | 12.5%(-8.81)#3,231 |
| 90. | Bingen | 3.8% | 9.9%(-6.15)#90 | 12.5%(-8.78)#3,254 |
| 91. | Otis Orchards East Farms | 3.8% | 9.9%(-6.13)#91 | 12.5%(-8.77)#3,271 |
| 92. | Edgewood | 3.8% | 9.9%(-6.10)#92 | 12.5%(-8.74)#3,306 |
| 93. | Bunk Foss | 3.8% | 9.9%(-6.09)#93 | 12.5%(-8.73)#3,317 |
| 94. | Woodinville | 3.8% | 9.9%(-6.07)#94 | 12.5%(-8.71)#3,353 |
| 95. | Entiat | 3.9% | 9.9%(-6.04)#95 | 12.5%(-8.68)#3,390 |
| 96. | Deep River | 3.9% | 9.9%(-6.03)#96 | 12.5%(-8.66)#3,407 |
| 97. | Mill Creek East | 3.9% | 9.9%(-5.99)#97 | 12.5%(-8.62)#3,454 |
| 98. | South Prairie | 4.0% | 9.9%(-5.93)#98 | 12.5%(-8.57)#3,538 |
| 99. | Chain Lake | 4.1% | 9.9%(-5.84)#99 | 12.5%(-8.47)#3,663 |
| 100. | Sammamish | 4.1% | 9.9%(-5.78)#100 | 12.5%(-8.42)#3,749 |
Common Questions
What are the Top 10 Cities with the Lowest Poverty Level in Washington?
Top 10 Cities with the Lowest Poverty Level in Washington are:
#1
0.31%
#2
0.47%
#3
0.47%
#4
0.56%
#5
0.57%
#6
0.69%
#7
0.94%
#8
0.99%
#9
1.0%
#10
1.2%
What city has the Lowest Poverty Level in Washington?
Snoqualmie has the Lowest Poverty Level in Washington with 0.31%.
What is the Poverty Level in the State of Washington?
Poverty Level in Washington is 9.9%.
What is the Poverty Level in the United States?
Poverty Level in the United States is 12.5%.