Cities with the Highest Percentage of Asian Population in Washington
RELATED REPORTS & OPTIONS
Asian
Washington
Compare Cities
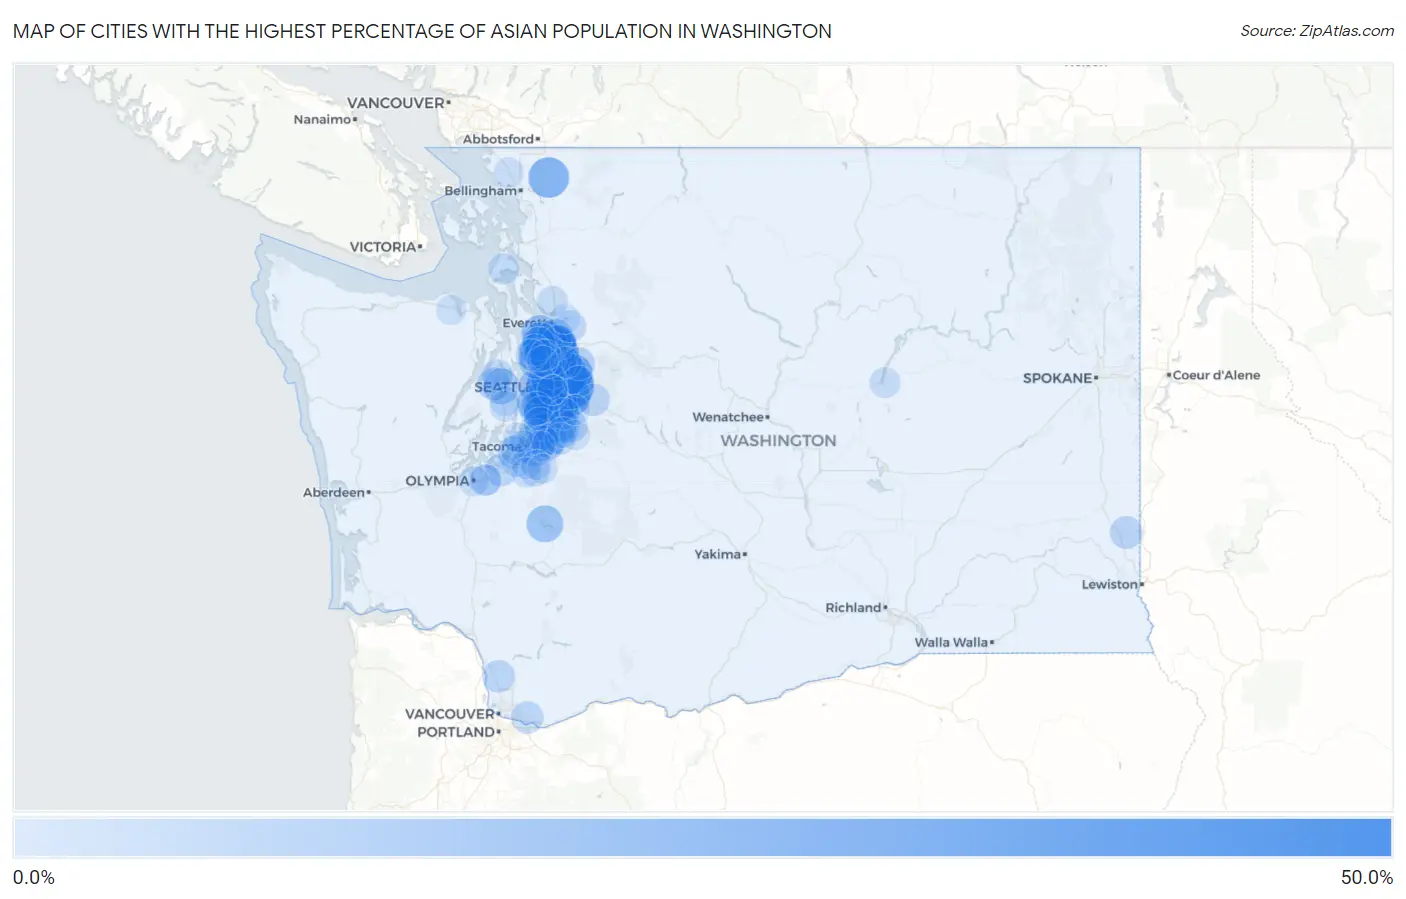
Map of Cities with the Highest Percentage of Asian Population in Washington
0.0%
50.0%
Cities with the Highest Percentage of Asian Population in Washington
| City | Asian | vs State | vs National | |
| 1. | Bothell East | 44.1% | 9.2%(+34.9)#1 | 5.8%(+38.4)#106 |
| 2. | Bellevue | 39.5% | 9.2%(+30.3)#2 | 5.8%(+33.7)#147 |
| 3. | Redmond | 38.3% | 9.2%(+29.1)#3 | 5.8%(+32.5)#163 |
| 4. | Newcastle | 37.0% | 9.2%(+27.8)#4 | 5.8%(+31.2)#179 |
| 5. | Mill Creek East | 36.1% | 9.2%(+26.9)#5 | 5.8%(+30.4)#185 |
| 6. | Sammamish | 35.8% | 9.2%(+26.6)#6 | 5.8%(+30.0)#189 |
| 7. | Clyde Hill | 33.4% | 9.2%(+24.1)#7 | 5.8%(+27.6)#220 |
| 8. | Larch Way | 32.7% | 9.2%(+23.5)#8 | 5.8%(+27.0)#230 |
| 9. | Medina | 27.3% | 9.2%(+18.0)#9 | 5.8%(+21.5)#324 |
| 10. | Yarrow Point | 27.3% | 9.2%(+18.0)#10 | 5.8%(+21.5)#325 |
| 11. | Issaquah | 26.5% | 9.2%(+17.3)#11 | 5.8%(+20.7)#338 |
| 12. | Deming | 26.5% | 9.2%(+17.2)#12 | 5.8%(+20.7)#339 |
| 13. | Renton | 26.2% | 9.2%(+17.0)#13 | 5.8%(+20.5)#348 |
| 14. | Bryn Mawr Skyway | 26.1% | 9.2%(+16.8)#14 | 5.8%(+20.3)#352 |
| 15. | Union Hill Novelty Hill | 25.7% | 9.2%(+16.5)#15 | 5.8%(+20.0)#360 |
| 16. | Tukwila | 24.4% | 9.2%(+15.2)#16 | 5.8%(+18.6)#400 |
| 17. | Lake Stickney | 24.2% | 9.2%(+14.9)#17 | 5.8%(+18.4)#406 |
| 18. | Martha Lake | 22.7% | 9.2%(+13.5)#18 | 5.8%(+17.0)#433 |
| 19. | Kent | 22.4% | 9.2%(+13.2)#19 | 5.8%(+16.6)#448 |
| 20. | Mercer Island | 22.2% | 9.2%(+13.0)#20 | 5.8%(+16.4)#456 |
| 21. | White Center | 21.2% | 9.2%(+12.0)#21 | 5.8%(+15.4)#484 |
| 22. | Mill Creek | 20.4% | 9.2%(+11.2)#22 | 5.8%(+14.6)#513 |
| 23. | Mukilteo | 20.4% | 9.2%(+11.2)#23 | 5.8%(+14.6)#515 |
| 24. | Bothell West | 19.7% | 9.2%(+10.5)#24 | 5.8%(+14.0)#546 |
| 25. | Alder | 19.4% | 9.2%(+10.1)#25 | 5.8%(+13.6)#563 |
| 26. | Bothell | 18.6% | 9.2%(+9.41)#26 | 5.8%(+12.9)#599 |
| 27. | Fairwood Cdp King County | 18.6% | 9.2%(+9.41)#27 | 5.8%(+12.9)#600 |
| 28. | Alderwood Manor | 18.5% | 9.2%(+9.29)#28 | 5.8%(+12.7)#609 |
| 29. | Lynnwood | 18.0% | 9.2%(+8.81)#29 | 5.8%(+12.3)#634 |
| 30. | Lakeland North | 17.7% | 9.2%(+8.44)#30 | 5.8%(+11.9)#656 |
| 31. | Kirkland | 17.2% | 9.2%(+7.96)#31 | 5.8%(+11.4)#691 |
| 32. | Tracyton | 17.2% | 9.2%(+7.95)#32 | 5.8%(+11.4)#692 |
| 33. | Seattle | 16.8% | 9.2%(+7.62)#33 | 5.8%(+11.1)#710 |
| 34. | North Lynnwood | 16.8% | 9.2%(+7.62)#34 | 5.8%(+11.1)#711 |
| 35. | Woodinville | 16.7% | 9.2%(+7.50)#35 | 5.8%(+10.9)#720 |
| 36. | Hunts Point | 16.4% | 9.2%(+7.19)#36 | 5.8%(+10.6)#736 |
| 37. | Esperance | 16.4% | 9.2%(+7.14)#37 | 5.8%(+10.6)#738 |
| 38. | Fife | 16.3% | 9.2%(+7.12)#38 | 5.8%(+10.6)#739 |
| 39. | Seatac | 16.2% | 9.2%(+7.03)#39 | 5.8%(+10.5)#747 |
| 40. | Picnic Point | 16.2% | 9.2%(+6.98)#40 | 5.8%(+10.4)#748 |
| 41. | Shoreline | 15.8% | 9.2%(+6.60)#41 | 5.8%(+10.0)#776 |
| 42. | Algona | 15.5% | 9.2%(+6.29)#42 | 5.8%(+9.73)#799 |
| 43. | Eastmont | 15.4% | 9.2%(+6.16)#43 | 5.8%(+9.61)#809 |
| 44. | Silver Firs | 15.1% | 9.2%(+5.88)#44 | 5.8%(+9.32)#829 |
| 45. | Federal Way | 15.0% | 9.2%(+5.81)#45 | 5.8%(+9.26)#833 |
| 46. | Kenmore | 14.3% | 9.2%(+5.12)#46 | 5.8%(+8.57)#870 |
| 47. | Burien | 14.1% | 9.2%(+4.90)#47 | 5.8%(+8.34)#888 |
| 48. | Meadowdale | 13.3% | 9.2%(+4.04)#48 | 5.8%(+7.48)#986 |
| 49. | Des Moines | 12.1% | 9.2%(+2.85)#49 | 5.8%(+6.29)#1,114 |
| 50. | Chico | 11.7% | 9.2%(+2.52)#50 | 5.8%(+5.96)#1,152 |
| 51. | Covington | 11.6% | 9.2%(+2.40)#51 | 5.8%(+5.84)#1,167 |
| 52. | Duvall | 11.5% | 9.2%(+2.32)#52 | 5.8%(+5.77)#1,183 |
| 53. | Pullman | 11.5% | 9.2%(+2.31)#53 | 5.8%(+5.75)#1,189 |
| 54. | Dupont | 11.2% | 9.2%(+1.99)#54 | 5.8%(+5.44)#1,240 |
| 55. | University Place | 11.2% | 9.2%(+1.96)#55 | 5.8%(+5.40)#1,244 |
| 56. | Maple Valley | 11.2% | 9.2%(+1.95)#56 | 5.8%(+5.40)#1,247 |
| 57. | La Center | 11.1% | 9.2%(+1.88)#57 | 5.8%(+5.33)#1,253 |
| 58. | Auburn | 11.0% | 9.2%(+1.75)#58 | 5.8%(+5.19)#1,274 |
| 59. | Mountlake Terrace | 10.8% | 9.2%(+1.62)#59 | 5.8%(+5.06)#1,287 |
| 60. | Camas | 10.8% | 9.2%(+1.61)#60 | 5.8%(+5.05)#1,290 |
| 61. | Pacific | 10.6% | 9.2%(+1.34)#61 | 5.8%(+4.78)#1,329 |
| 62. | Snoqualmie | 10.4% | 9.2%(+1.20)#62 | 5.8%(+4.64)#1,350 |
| 63. | Everett | 10.0% | 9.2%(+0.773)#63 | 5.8%(+4.22)#1,412 |
| 64. | Lakeland South | 9.9% | 9.2%(+0.675)#64 | 5.8%(+4.12)#1,434 |
| 65. | Lacey | 9.4% | 9.2%(+0.228)#65 | 5.8%(+3.67)#1,514 |
| 66. | Lake Holm | 9.4% | 9.2%(+0.145)#66 | 5.8%(+3.59)#1,528 |
| 67. | Edmonds | 9.3% | 9.2%(+0.126)#67 | 5.8%(+3.57)#1,533 |
| 68. | Maple Heights Lake Desire | 9.2% | 9.2%(-0.020)#68 | 5.8%(+3.42)#1,558 |
| 69. | Cottage Lake | 9.2% | 9.2%(-0.062)#69 | 5.8%(+3.38)#1,567 |
| 70. | Silverdale | 9.0% | 9.2%(-0.192)#70 | 5.8%(+3.25)#1,595 |
| 71. | Woodway | 8.9% | 9.2%(-0.272)#71 | 5.8%(+3.17)#1,618 |
| 72. | Tacoma | 8.7% | 9.2%(-0.536)#72 | 5.8%(+2.91)#1,669 |
| 73. | Lakewood | 8.5% | 9.2%(-0.670)#73 | 5.8%(+2.77)#1,691 |
| 74. | Ames Lake | 8.4% | 9.2%(-0.823)#74 | 5.8%(+2.62)#1,721 |
| 75. | Oak Harbor | 8.4% | 9.2%(-0.847)#75 | 5.8%(+2.60)#1,727 |
| 76. | Brier | 8.3% | 9.2%(-0.913)#76 | 5.8%(+2.53)#1,742 |
| 77. | Lake Forest Park | 8.2% | 9.2%(-1.05)#77 | 5.8%(+2.39)#1,769 |
| 78. | Tanglewilde | 8.0% | 9.2%(-1.23)#78 | 5.8%(+2.22)#1,815 |
| 79. | Fircrest | 8.0% | 9.2%(-1.24)#79 | 5.8%(+2.20)#1,818 |
| 80. | Lake Morton Berrydale | 7.9% | 9.2%(-1.30)#80 | 5.8%(+2.15)#1,832 |
| 81. | Frederickson | 7.8% | 9.2%(-1.45)#81 | 5.8%(+2.00)#1,867 |
| 82. | Bethel | 7.7% | 9.2%(-1.52)#82 | 5.8%(+1.93)#1,883 |
| 83. | Parkland | 7.7% | 9.2%(-1.56)#83 | 5.8%(+1.89)#1,894 |
| 84. | Marysville | 7.6% | 9.2%(-1.58)#84 | 5.8%(+1.86)#1,903 |
| 85. | Banks Lake South | 7.6% | 9.2%(-1.60)#85 | 5.8%(+1.84)#1,910 |
| 86. | Milton | 7.4% | 9.2%(-1.81)#86 | 5.8%(+1.64)#1,967 |
| 87. | Tehaleh | 7.3% | 9.2%(-1.95)#87 | 5.8%(+1.50)#2,000 |
| 88. | Erlands Point | 7.1% | 9.2%(-2.12)#88 | 5.8%(+1.33)#2,054 |
| 89. | Ferndale | 7.1% | 9.2%(-2.15)#89 | 5.8%(+1.29)#2,064 |
| 90. | Olympia | 7.0% | 9.2%(-2.21)#90 | 5.8%(+1.23)#2,085 |
| 91. | Bell Hill | 6.9% | 9.2%(-2.33)#91 | 5.8%(+1.12)#2,131 |
| 92. | Black Diamond | 6.9% | 9.2%(-2.35)#92 | 5.8%(+1.10)#2,143 |
| 93. | Lake Stevens | 6.8% | 9.2%(-2.38)#93 | 5.8%(+1.06)#2,154 |
| 94. | Spanaway | 6.8% | 9.2%(-2.39)#94 | 5.8%(+1.05)#2,156 |
| 95. | Summit View | 6.8% | 9.2%(-2.43)#95 | 5.8%(+1.02)#2,170 |
| 96. | Mirrormont | 6.7% | 9.2%(-2.49)#96 | 5.8%(+0.956)#2,185 |
| 97. | South Hill | 6.6% | 9.2%(-2.57)#97 | 5.8%(+0.871)#2,219 |
| 98. | East Port Orchard | 6.6% | 9.2%(-2.58)#98 | 5.8%(+0.863)#2,222 |
| 99. | Ruston | 6.6% | 9.2%(-2.60)#99 | 5.8%(+0.842)#2,227 |
| 100. | Beaux Arts Village | 6.6% | 9.2%(-2.63)#100 | 5.8%(+0.817)#2,234 |
Common Questions
What are the Top 10 Cities with the Highest Percentage of Asian Population in Washington?
Top 10 Cities with the Highest Percentage of Asian Population in Washington are:
#1
44.1%
#2
39.5%
#3
38.3%
#4
37.0%
#5
36.1%
#6
35.8%
#7
33.4%
#8
32.7%
#9
27.3%
#10
27.3%
What city has the Highest Percentage of Asian Population in Washington?
Bothell East has the Highest Percentage of Asian Population in Washington with 44.1%.
What is the Percentage of Asian Population in the State of Washington?
Percentage of Asian Population in Washington is 9.2%.
What is the Percentage of Asian Population in the United States?
Percentage of Asian Population in the United States is 5.8%.