Zip Codes with the Highest Percentage of Population Employed in Food Preparation & Serving in Washington
RELATED REPORTS & OPTIONS
Food Preparation & Serving
Washington
Compare Zip Codes
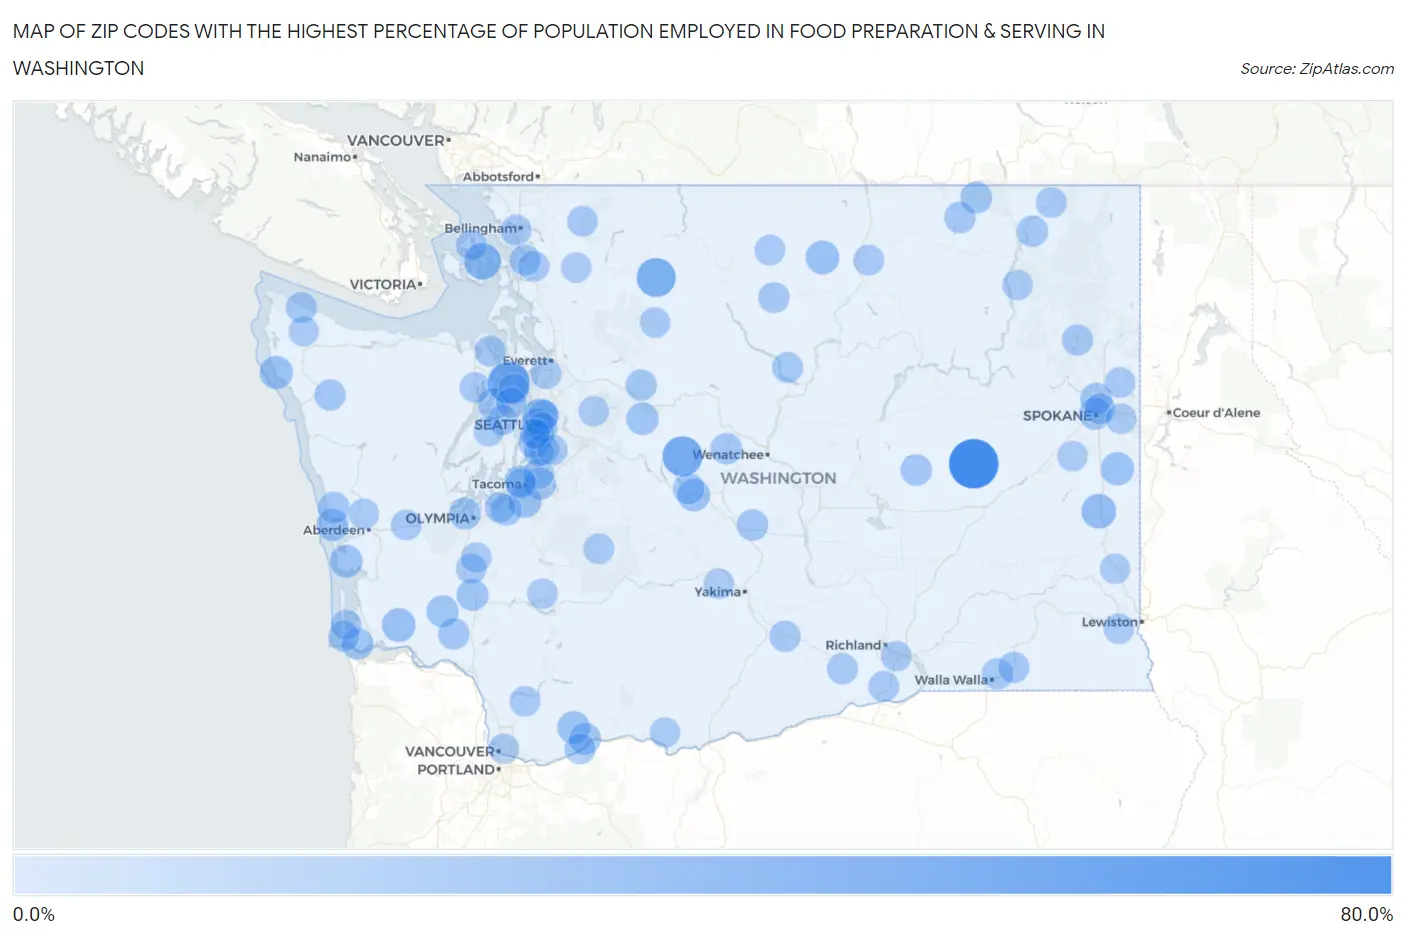
Map of Zip Codes with the Highest Percentage of Population Employed in Food Preparation & Serving in Washington
0.0%
80.0%
Zip Codes with the Highest Percentage of Population Employed in Food Preparation & Serving in Washington
| Zip Code | % Employed | vs State | vs National | |
| 1. | 99144 | 80.0% | 5.1%(+74.9)#1 | 5.3%(+74.7)#19 |
| 2. | 98364 | 50.0% | 5.1%(+44.9)#2 | 5.3%(+44.7)#59 |
| 3. | 98940 | 43.2% | 5.1%(+38.1)#3 | 5.3%(+37.9)#85 |
| 4. | 98267 | 39.4% | 5.1%(+34.2)#4 | 5.3%(+34.1)#108 |
| 5. | 98222 | 30.6% | 5.1%(+25.5)#5 | 5.3%(+25.3)#200 |
| 6. | 98195 | 24.9% | 5.1%(+19.7)#6 | 5.3%(+19.6)#319 |
| 7. | 99176 | 23.2% | 5.1%(+18.0)#7 | 5.3%(+17.9)#380 |
| 8. | 98621 | 19.4% | 5.1%(+14.3)#8 | 5.3%(+14.1)#538 |
| 9. | 98819 | 19.4% | 5.1%(+14.3)#9 | 5.3%(+14.1)#539 |
| 10. | 98350 | 18.2% | 5.1%(+13.0)#10 | 5.3%(+12.9)#639 |
| 11. | 99039 | 18.0% | 5.1%(+12.8)#11 | 5.3%(+12.7)#663 |
| 12. | 98943 | 16.7% | 5.1%(+11.5)#12 | 5.3%(+11.4)#777 |
| 13. | 98547 | 16.5% | 5.1%(+11.4)#13 | 5.3%(+11.3)#793 |
| 14. | 98447 | 16.4% | 5.1%(+11.3)#14 | 5.3%(+11.2)#803 |
| 15. | 98610 | 16.1% | 5.1%(+11.0)#15 | 5.3%(+10.9)#842 |
| 16. | 98288 | 15.2% | 5.1%(+10.0)#16 | 5.3%(+9.90)#957 |
| 17. | 98569 | 14.2% | 5.1%(+9.07)#17 | 5.3%(+8.93)#1,120 |
| 18. | 98354 | 14.2% | 5.1%(+9.07)#18 | 5.3%(+8.93)#1,121 |
| 19. | 99201 | 13.8% | 5.1%(+8.65)#19 | 5.3%(+8.50)#1,211 |
| 20. | 98538 | 13.6% | 5.1%(+8.46)#20 | 5.3%(+8.31)#1,255 |
| 21. | 99121 | 13.2% | 5.1%(+8.08)#21 | 5.3%(+7.94)#1,335 |
| 22. | 98648 | 13.2% | 5.1%(+8.02)#22 | 5.3%(+7.88)#1,351 |
| 23. | 98565 | 13.2% | 5.1%(+8.01)#23 | 5.3%(+7.87)#1,353 |
| 24. | 98505 | 12.7% | 5.1%(+7.57)#24 | 5.3%(+7.43)#1,462 |
| 25. | 99251 | 12.7% | 5.1%(+7.55)#25 | 5.3%(+7.41)#1,468 |
| 26. | 98614 | 12.6% | 5.1%(+7.50)#26 | 5.3%(+7.35)#1,485 |
| 27. | 98315 | 12.2% | 5.1%(+7.04)#27 | 5.3%(+6.90)#1,605 |
| 28. | 98535 | 12.0% | 5.1%(+6.89)#28 | 5.3%(+6.75)#1,650 |
| 29. | 99150 | 12.0% | 5.1%(+6.86)#29 | 5.3%(+6.71)#1,665 |
| 30. | 98926 | 11.9% | 5.1%(+6.79)#30 | 5.3%(+6.64)#1,695 |
| 31. | 98581 | 11.9% | 5.1%(+6.72)#31 | 5.3%(+6.58)#1,713 |
| 32. | 98832 | 11.8% | 5.1%(+6.62)#32 | 5.3%(+6.48)#1,755 |
| 33. | 98847 | 11.5% | 5.1%(+6.39)#33 | 5.3%(+6.25)#1,841 |
| 34. | 98941 | 11.4% | 5.1%(+6.27)#34 | 5.3%(+6.13)#1,871 |
| 35. | 99126 | 11.3% | 5.1%(+6.11)#35 | 5.3%(+5.97)#1,933 |
| 36. | 98164 | 11.2% | 5.1%(+6.02)#36 | 5.3%(+5.88)#1,973 |
| 37. | 98331 | 11.1% | 5.1%(+5.96)#37 | 5.3%(+5.82)#2,012 |
| 38. | 98433 | 11.0% | 5.1%(+5.90)#38 | 5.3%(+5.75)#2,039 |
| 39. | 99362 | 10.9% | 5.1%(+5.74)#39 | 5.3%(+5.59)#2,117 |
| 40. | 98932 | 10.6% | 5.1%(+5.45)#40 | 5.3%(+5.31)#2,266 |
| 41. | 98256 | 10.5% | 5.1%(+5.35)#41 | 5.3%(+5.20)#2,329 |
| 42. | 99329 | 10.4% | 5.1%(+5.30)#42 | 5.3%(+5.16)#2,351 |
| 43. | 99148 | 10.3% | 5.1%(+5.14)#43 | 5.3%(+4.99)#2,434 |
| 44. | 98339 | 10.2% | 5.1%(+5.04)#44 | 5.3%(+4.90)#2,493 |
| 45. | 98644 | 10.2% | 5.1%(+5.04)#45 | 5.3%(+4.89)#2,495 |
| 46. | 98856 | 10.0% | 5.1%(+4.90)#46 | 5.3%(+4.76)#2,595 |
| 47. | 98232 | 10.0% | 5.1%(+4.88)#47 | 5.3%(+4.74)#2,611 |
| 48. | 99350 | 10.0% | 5.1%(+4.86)#48 | 5.3%(+4.71)#2,626 |
| 49. | 98381 | 9.9% | 5.1%(+4.79)#49 | 5.3%(+4.64)#2,686 |
| 50. | 98416 | 9.9% | 5.1%(+4.77)#50 | 5.3%(+4.63)#2,693 |
| 51. | 98639 | 9.9% | 5.1%(+4.72)#51 | 5.3%(+4.58)#2,738 |
| 52. | 98831 | 9.8% | 5.1%(+4.70)#52 | 5.3%(+4.55)#2,761 |
| 53. | 98233 | 9.5% | 5.1%(+4.38)#53 | 5.3%(+4.24)#3,029 |
| 54. | 98146 | 9.5% | 5.1%(+4.35)#54 | 5.3%(+4.20)#3,064 |
| 55. | 99207 | 9.5% | 5.1%(+4.31)#55 | 5.3%(+4.16)#3,096 |
| 56. | 98188 | 9.4% | 5.1%(+4.27)#56 | 5.3%(+4.13)#3,122 |
| 57. | 99157 | 9.4% | 5.1%(+4.21)#57 | 5.3%(+4.07)#3,183 |
| 58. | 98849 | 9.3% | 5.1%(+4.18)#58 | 5.3%(+4.04)#3,217 |
| 59. | 98204 | 9.2% | 5.1%(+4.04)#59 | 5.3%(+3.90)#3,334 |
| 60. | 98245 | 9.2% | 5.1%(+4.04)#60 | 5.3%(+3.89)#3,345 |
| 61. | 98304 | 9.2% | 5.1%(+4.01)#61 | 5.3%(+3.86)#3,369 |
| 62. | 99346 | 8.9% | 5.1%(+3.75)#62 | 5.3%(+3.60)#3,631 |
| 63. | 98631 | 8.8% | 5.1%(+3.68)#63 | 5.3%(+3.54)#3,689 |
| 64. | 98244 | 8.8% | 5.1%(+3.62)#64 | 5.3%(+3.48)#3,764 |
| 65. | 98531 | 8.7% | 5.1%(+3.57)#65 | 5.3%(+3.43)#3,826 |
| 66. | 98376 | 8.7% | 5.1%(+3.57)#66 | 5.3%(+3.43)#3,829 |
| 67. | 98346 | 8.6% | 5.1%(+3.48)#67 | 5.3%(+3.34)#3,935 |
| 68. | 98108 | 8.6% | 5.1%(+3.47)#68 | 5.3%(+3.33)#3,953 |
| 69. | 98862 | 8.5% | 5.1%(+3.39)#69 | 5.3%(+3.25)#4,039 |
| 70. | 98583 | 8.5% | 5.1%(+3.37)#70 | 5.3%(+3.22)#4,064 |
| 71. | 98601 | 8.4% | 5.1%(+3.24)#71 | 5.3%(+3.10)#4,198 |
| 72. | 99336 | 8.4% | 5.1%(+3.24)#72 | 5.3%(+3.10)#4,200 |
| 73. | 98241 | 8.4% | 5.1%(+3.23)#73 | 5.3%(+3.09)#4,209 |
| 74. | 98311 | 8.3% | 5.1%(+3.19)#74 | 5.3%(+3.05)#4,250 |
| 75. | 98530 | 8.3% | 5.1%(+3.11)#75 | 5.3%(+2.97)#4,373 |
| 76. | 98003 | 8.2% | 5.1%(+3.08)#76 | 5.3%(+2.94)#4,405 |
| 77. | 99021 | 8.2% | 5.1%(+3.06)#77 | 5.3%(+2.92)#4,430 |
| 78. | 98520 | 8.2% | 5.1%(+3.03)#78 | 5.3%(+2.89)#4,470 |
| 79. | 98225 | 8.1% | 5.1%(+2.98)#79 | 5.3%(+2.84)#4,541 |
| 80. | 98105 | 8.1% | 5.1%(+2.95)#80 | 5.3%(+2.81)#4,582 |
| 81. | 98405 | 8.1% | 5.1%(+2.94)#81 | 5.3%(+2.80)#4,590 |
| 82. | 98327 | 8.1% | 5.1%(+2.92)#82 | 5.3%(+2.77)#4,644 |
| 83. | 98356 | 8.1% | 5.1%(+2.91)#83 | 5.3%(+2.77)#4,649 |
| 84. | 99167 | 8.0% | 5.1%(+2.84)#84 | 5.3%(+2.70)#4,745 |
| 85. | 99004 | 8.0% | 5.1%(+2.81)#85 | 5.3%(+2.67)#4,800 |
| 86. | 98148 | 7.9% | 5.1%(+2.74)#86 | 5.3%(+2.60)#4,911 |
| 87. | 99037 | 7.9% | 5.1%(+2.71)#87 | 5.3%(+2.57)#4,956 |
| 88. | 98255 | 7.8% | 5.1%(+2.62)#88 | 5.3%(+2.47)#5,125 |
| 89. | 98312 | 7.7% | 5.1%(+2.60)#89 | 5.3%(+2.45)#5,151 |
| 90. | 99403 | 7.7% | 5.1%(+2.58)#90 | 5.3%(+2.43)#5,182 |
| 91. | 98661 | 7.7% | 5.1%(+2.57)#91 | 5.3%(+2.43)#5,191 |
| 92. | 98392 | 7.7% | 5.1%(+2.51)#92 | 5.3%(+2.37)#5,284 |
| 93. | 98014 | 7.6% | 5.1%(+2.48)#93 | 5.3%(+2.34)#5,332 |
| 94. | 98908 | 7.5% | 5.1%(+2.35)#94 | 5.3%(+2.21)#5,569 |
| 95. | 98326 | 7.5% | 5.1%(+2.35)#95 | 5.3%(+2.20)#5,576 |
| 96. | 98635 | 7.5% | 5.1%(+2.34)#96 | 5.3%(+2.19)#5,594 |
| 97. | 98144 | 7.5% | 5.1%(+2.33)#97 | 5.3%(+2.19)#5,605 |
| 98. | 99163 | 7.5% | 5.1%(+2.32)#98 | 5.3%(+2.17)#5,634 |
| 99. | 98055 | 7.4% | 5.1%(+2.23)#99 | 5.3%(+2.09)#5,791 |
| 100. | 98106 | 7.4% | 5.1%(+2.23)#100 | 5.3%(+2.09)#5,794 |
Common Questions
What are the Top 10 Zip Codes with the Highest Percentage of Population Employed in Food Preparation & Serving in Washington?
Top 10 Zip Codes with the Highest Percentage of Population Employed in Food Preparation & Serving in Washington are:
What zip code has the Highest Percentage of Population Employed in Food Preparation & Serving in Washington?
99144 has the Highest Percentage of Population Employed in Food Preparation & Serving in Washington with 80.0%.
What is the Percentage of Population Employed in Food Preparation & Serving in the State of Washington?
Percentage of Population Employed in Food Preparation & Serving in Washington is 5.1%.
What is the Percentage of Population Employed in Food Preparation & Serving in the United States?
Percentage of Population Employed in Food Preparation & Serving in the United States is 5.3%.