Cities with the Highest Percentage of Scottish Population in Washington
RELATED REPORTS & OPTIONS
Scottish
Washington
Compare Cities
Map of Cities with the Highest Percentage of Scottish Population in Washington
0.00%
60.00%
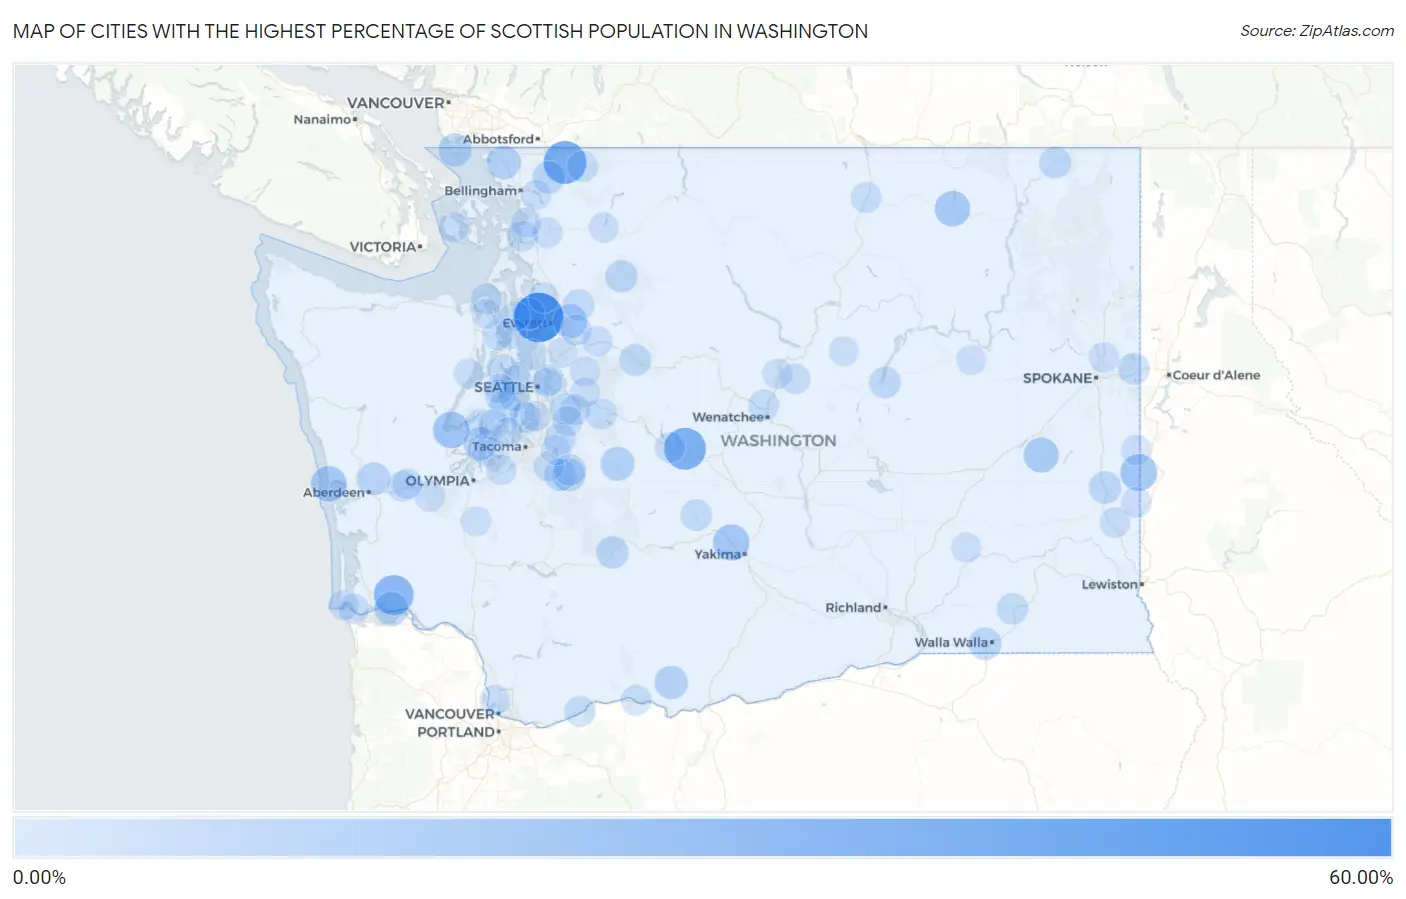
Cities with the Highest Percentage of Scottish Population in Washington
| City | Scottish | vs State | vs National | |
| 1. | Hat Island | 52.38% | 2.53% (+49.8)#1 | 1.58% (+50.8)#16 |
| 2. | Maple Falls | 35.50% | 2.53% (+33.0)#2 | 1.58% (+33.9)#47 |
| 3. | Ronald | 33.07% | 2.53% (+30.5)#3 | 1.58% (+31.5)#55 |
| 4. | Grays River | 27.63% | 2.53% (+25.1)#4 | 1.58% (+26.1)#81 |
| 5. | Farmington | 20.14% | 2.53% (+17.6)#5 | 1.58% (+18.6)#144 |
| 6. | Union | 19.46% | 2.53% (+16.9)#6 | 1.58% (+17.9)#162 |
| 7. | Eschbach | 19.14% | 2.53% (+16.6)#7 | 1.58% (+17.6)#167 |
| 8. | Oyehut | 17.65% | 2.53% (+15.1)#8 | 1.58% (+16.1)#201 |
| 9. | Pine Grove | 16.98% | 2.53% (+14.4)#9 | 1.58% (+15.4)#215 |
| 10. | Lamont | 16.35% | 2.53% (+13.8)#10 | 1.58% (+14.8)#226 |
| 11. | Machias | 13.81% | 2.53% (+11.3)#11 | 1.58% (+12.2)#308 |
| 12. | Sunland Estates | 13.64% | 2.53% (+11.1)#12 | 1.58% (+12.1)#313 |
| 13. | Greenwater | 13.40% | 2.53% (+10.9)#13 | 1.58% (+11.8)#325 |
| 14. | Altoona | 13.21% | 2.53% (+10.7)#14 | 1.58% (+11.6)#338 |
| 15. | Custer | 12.96% | 2.53% (+10.4)#15 | 1.58% (+11.4)#352 |
| 16. | Klickitat | 12.24% | 2.53% (+9.71)#16 | 1.58% (+10.7)#404 |
| 17. | Point Roberts | 12.09% | 2.53% (+9.56)#17 | 1.58% (+10.5)#417 |
| 18. | Herron Island | 11.48% | 2.53% (+8.94)#18 | 1.58% (+9.90)#466 |
| 19. | Aberdeen Gardens | 10.99% | 2.53% (+8.46)#19 | 1.58% (+9.41)#498 |
| 20. | Carbonado | 10.91% | 2.53% (+8.38)#20 | 1.58% (+9.33)#504 |
| 21. | Packwood | 10.34% | 2.53% (+7.81)#21 | 1.58% (+8.77)#564 |
| 22. | Deming | 10.30% | 2.53% (+7.77)#22 | 1.58% (+8.73)#569 |
| 23. | Garrett | 10.25% | 2.53% (+7.72)#23 | 1.58% (+8.68)#577 |
| 24. | Steptoe | 10.00% | 2.53% (+7.47)#24 | 1.58% (+8.42)#606 |
| 25. | Darrington | 9.49% | 2.53% (+6.96)#25 | 1.58% (+7.91)#656 |
| 26. | Crocker | 9.03% | 2.53% (+6.50)#26 | 1.58% (+7.46)#725 |
| 27. | Baring | 8.74% | 2.53% (+6.20)#27 | 1.58% (+7.16)#772 |
| 28. | Langley | 8.74% | 2.53% (+6.20)#28 | 1.58% (+7.16)#773 |
| 29. | Northport | 8.47% | 2.53% (+5.94)#29 | 1.58% (+6.90)#814 |
| 30. | Wilkeson | 8.21% | 2.53% (+5.67)#30 | 1.58% (+6.63)#868 |
| 31. | Banks Lake South | 8.12% | 2.53% (+5.59)#31 | 1.58% (+6.55)#888 |
| 32. | Otis Orchards East Farms | 8.07% | 2.53% (+5.54)#32 | 1.58% (+6.50)#901 |
| 33. | Nile | 7.83% | 2.53% (+5.29)#33 | 1.58% (+6.25)#953 |
| 34. | Granite Falls | 7.82% | 2.53% (+5.28)#34 | 1.58% (+6.24)#956 |
| 35. | Waitsburg | 7.74% | 2.53% (+5.21)#35 | 1.58% (+6.16)#981 |
| 36. | Lake Holm | 7.53% | 2.53% (+4.99)#36 | 1.58% (+5.95)#1,026 |
| 37. | Bethel | 7.35% | 2.53% (+4.81)#37 | 1.58% (+5.77)#1,073 |
| 38. | East Renton Highlands | 7.24% | 2.53% (+4.70)#38 | 1.58% (+5.66)#1,099 |
| 39. | Hunts Point | 7.12% | 2.53% (+4.59)#39 | 1.58% (+5.54)#1,133 |
| 40. | Wilderness Rim | 7.05% | 2.53% (+4.52)#40 | 1.58% (+5.48)#1,149 |
| 41. | Keyport | 7.04% | 2.53% (+4.51)#41 | 1.58% (+5.47)#1,151 |
| 42. | Stansberry Lake | 6.96% | 2.53% (+4.43)#42 | 1.58% (+5.39)#1,176 |
| 43. | Sunnyslope | 6.95% | 2.53% (+4.42)#43 | 1.58% (+5.38)#1,180 |
| 44. | North Bonneville | 6.72% | 2.53% (+4.19)#44 | 1.58% (+5.14)#1,243 |
| 45. | Navy Yard City | 6.70% | 2.53% (+4.16)#45 | 1.58% (+5.12)#1,251 |
| 46. | Vashon | 6.63% | 2.53% (+4.09)#46 | 1.58% (+5.05)#1,277 |
| 47. | Bingen | 6.32% | 2.53% (+3.79)#47 | 1.58% (+4.75)#1,399 |
| 48. | Tonasket | 6.25% | 2.53% (+3.72)#48 | 1.58% (+4.67)#1,427 |
| 49. | Glacier | 6.22% | 2.53% (+3.69)#49 | 1.58% (+4.65)#1,446 |
| 50. | Bay View | 6.14% | 2.53% (+3.61)#50 | 1.58% (+4.57)#1,487 |
| 51. | Easton | 6.10% | 2.53% (+3.56)#51 | 1.58% (+4.52)#1,504 |
| 52. | Port Townsend | 6.06% | 2.53% (+3.53)#52 | 1.58% (+4.49)#1,523 |
| 53. | Mirrormont | 6.05% | 2.53% (+3.51)#53 | 1.58% (+4.47)#1,537 |
| 54. | Lake Goodwin | 5.98% | 2.53% (+3.45)#54 | 1.58% (+4.41)#1,573 |
| 55. | Hansville | 5.98% | 2.53% (+3.44)#55 | 1.58% (+4.40)#1,577 |
| 56. | Three Lakes | 5.85% | 2.53% (+3.32)#56 | 1.58% (+4.28)#1,639 |
| 57. | Brady | 5.82% | 2.53% (+3.29)#57 | 1.58% (+4.25)#1,659 |
| 58. | Woodway | 5.72% | 2.53% (+3.19)#58 | 1.58% (+4.15)#1,704 |
| 59. | Albion | 5.70% | 2.53% (+3.16)#59 | 1.58% (+4.12)#1,719 |
| 60. | Waterville | 5.65% | 2.53% (+3.11)#60 | 1.58% (+4.07)#1,747 |
| 61. | Chinook | 5.59% | 2.53% (+3.06)#61 | 1.58% (+4.02)#1,785 |
| 62. | Mead | 5.58% | 2.53% (+3.04)#62 | 1.58% (+4.00)#1,793 |
| 63. | Port Ludlow | 5.52% | 2.53% (+2.99)#63 | 1.58% (+3.95)#1,833 |
| 64. | Sultan | 5.49% | 2.53% (+2.96)#64 | 1.58% (+3.92)#1,850 |
| 65. | Porter | 5.48% | 2.53% (+2.95)#65 | 1.58% (+3.90)#1,859 |
| 66. | Sedro Woolley | 5.47% | 2.53% (+2.94)#66 | 1.58% (+3.89)#1,864 |
| 67. | Tekoa | 5.45% | 2.53% (+2.91)#67 | 1.58% (+3.87)#1,879 |
| 68. | Palouse | 5.42% | 2.53% (+2.88)#68 | 1.58% (+3.84)#1,894 |
| 69. | Felida | 5.34% | 2.53% (+2.81)#69 | 1.58% (+3.77)#1,948 |
| 70. | Gig Harbor | 5.34% | 2.53% (+2.80)#70 | 1.58% (+3.76)#1,950 |
| 71. | Normandy Park | 5.33% | 2.53% (+2.80)#71 | 1.58% (+3.75)#1,953 |
| 72. | Bow | 5.32% | 2.53% (+2.79)#72 | 1.58% (+3.75)#1,962 |
| 73. | Shadow Lake | 5.25% | 2.53% (+2.71)#73 | 1.58% (+3.67)#2,018 |
| 74. | Satsop | 5.21% | 2.53% (+2.67)#74 | 1.58% (+3.63)#2,042 |
| 75. | Concrete | 5.18% | 2.53% (+2.64)#75 | 1.58% (+3.60)#2,072 |
| 76. | Brinnon | 5.15% | 2.53% (+2.62)#76 | 1.58% (+3.57)#2,089 |
| 77. | Mcmillin | 5.11% | 2.53% (+2.58)#77 | 1.58% (+3.53)#2,123 |
| 78. | Ilwaco | 5.09% | 2.53% (+2.56)#78 | 1.58% (+3.52)#2,134 |
| 79. | Dupont | 5.05% | 2.53% (+2.52)#79 | 1.58% (+3.48)#2,172 |
| 80. | Edison | 5.00% | 2.53% (+2.47)#80 | 1.58% (+3.42)#2,200 |
| 81. | Bainbridge Island | 4.99% | 2.53% (+2.45)#81 | 1.58% (+3.41)#2,217 |
| 82. | Friday Harbor | 4.99% | 2.53% (+2.45)#82 | 1.58% (+3.41)#2,219 |
| 83. | Lake Marcel Stillwater | 4.94% | 2.53% (+2.41)#83 | 1.58% (+3.37)#2,257 |
| 84. | Manchester | 4.94% | 2.53% (+2.41)#84 | 1.58% (+3.36)#2,259 |
| 85. | Entiat | 4.91% | 2.53% (+2.38)#85 | 1.58% (+3.34)#2,280 |
| 86. | Longbranch | 4.83% | 2.53% (+2.29)#86 | 1.58% (+3.25)#2,361 |
| 87. | Lake Tapps | 4.80% | 2.53% (+2.26)#87 | 1.58% (+3.22)#2,389 |
| 88. | Medina | 4.79% | 2.53% (+2.26)#88 | 1.58% (+3.21)#2,397 |
| 89. | Maltby | 4.72% | 2.53% (+2.19)#89 | 1.58% (+3.15)#2,460 |
| 90. | Rocky Point | 4.72% | 2.53% (+2.19)#90 | 1.58% (+3.15)#2,461 |
| 91. | Creston | 4.69% | 2.53% (+2.16)#91 | 1.58% (+3.12)#2,486 |
| 92. | Sudden Valley | 4.67% | 2.53% (+2.14)#92 | 1.58% (+3.10)#2,504 |
| 93. | Allyn | 4.67% | 2.53% (+2.14)#93 | 1.58% (+3.09)#2,512 |
| 94. | Mansfield | 4.63% | 2.53% (+2.10)#94 | 1.58% (+3.05)#2,561 |
| 95. | Lexington | 4.59% | 2.53% (+2.06)#95 | 1.58% (+3.02)#2,596 |
| 96. | Fall City | 4.51% | 2.53% (+1.98)#96 | 1.58% (+2.93)#2,700 |
| 97. | Kahlotus | 4.48% | 2.53% (+1.94)#97 | 1.58% (+2.90)#2,738 |
| 98. | Port Hadlock Irondale | 4.45% | 2.53% (+1.92)#98 | 1.58% (+2.87)#2,773 |
| 99. | Freeland | 4.44% | 2.53% (+1.90)#99 | 1.58% (+2.86)#2,787 |
| 100. | Bucoda | 4.43% | 2.53% (+1.90)#100 | 1.58% (+2.86)#2,789 |
Common Questions
What are the Top 10 Cities with the Highest Percentage of Scottish Population in Washington?
Top 10 Cities with the Highest Percentage of Scottish Population in Washington are:
#1
52.38%
#2
35.50%
#3
33.07%
#4
27.63%
#5
20.14%
#6
19.46%
#7
19.14%
#8
17.65%
#9
16.98%
#10
16.35%
What city has the Highest Percentage of Scottish Population in Washington?
Hat Island has the Highest Percentage of Scottish Population in Washington with 52.38%.
What is the Percentage of Scottish Population in the State of Washington?
Percentage of Scottish Population in Washington is 2.53%.
What is the Percentage of Scottish Population in the United States?
Percentage of Scottish Population in the United States is 1.58%.