Cities with the Highest Percentage of Population Employed in Construction in Washington
RELATED REPORTS & OPTIONS
Construction
Washington
Compare Cities
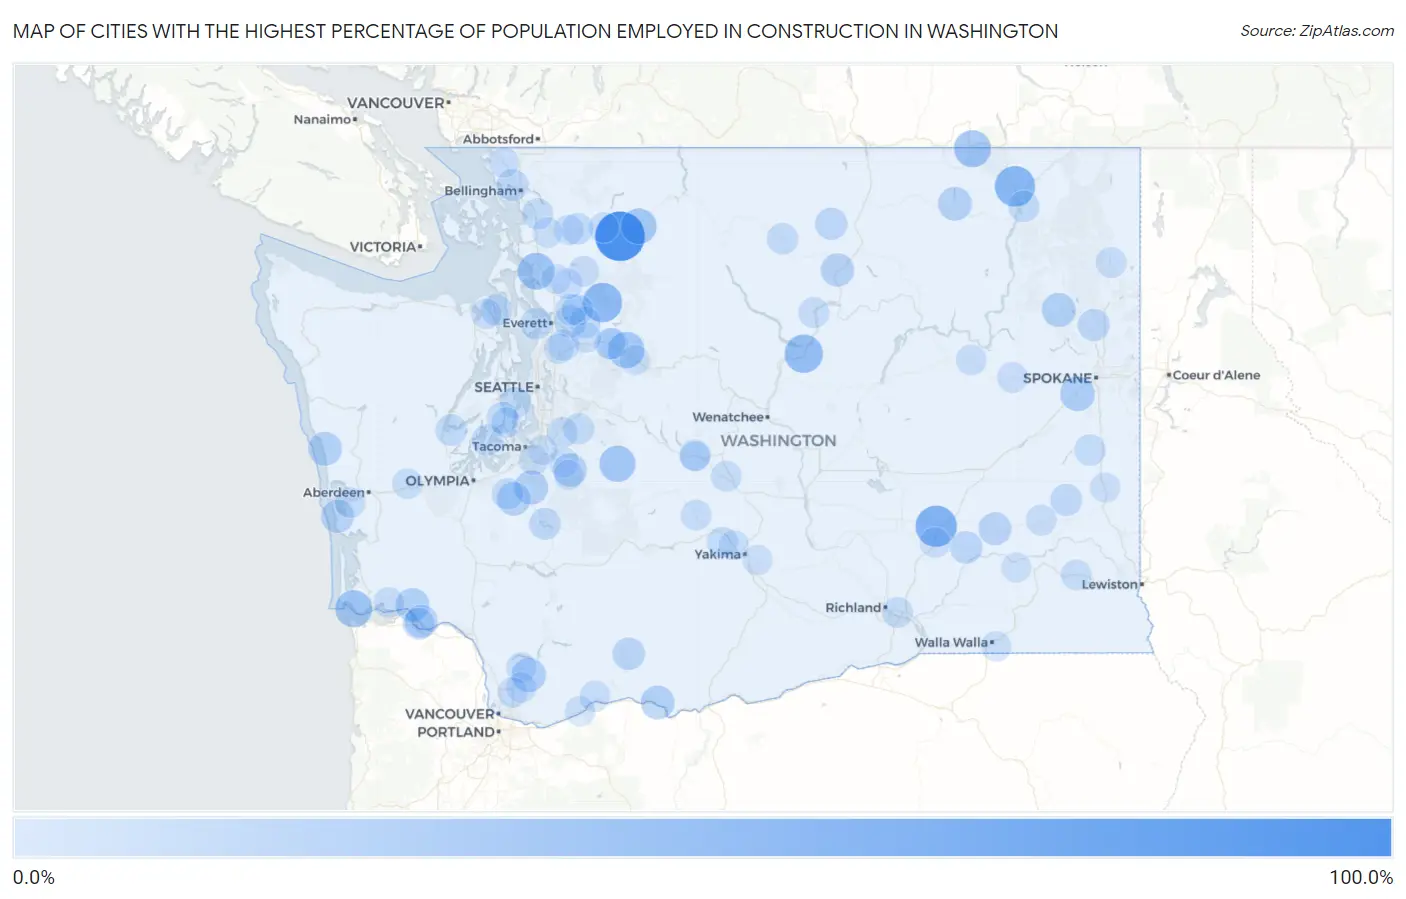
Map of Cities with the Highest Percentage of Population Employed in Construction in Washington
0.0%
100.0%
Cities with the Highest Percentage of Population Employed in Construction in Washington
| City | % Employed | vs State | vs National | |
| 1. | Rockport | 100.0% | 7.2%(+92.8)#1 | 6.9%(+93.1)#20 |
| 2. | Cougar | 100.0% | 7.2%(+92.8)#2 | 6.9%(+93.1)#27 |
| 3. | Hatton | 62.5% | 7.2%(+55.3)#3 | 6.9%(+55.6)#117 |
| 4. | Barstow | 58.3% | 7.2%(+51.1)#4 | 6.9%(+51.5)#141 |
| 5. | Verlot | 53.7% | 7.2%(+46.5)#5 | 6.9%(+46.8)#184 |
| 6. | Chelan Falls | 49.2% | 7.2%(+42.0)#6 | 6.9%(+42.3)#232 |
| 7. | Danville | 43.5% | 7.2%(+36.3)#7 | 6.9%(+36.6)#294 |
| 8. | Lake Ketchum | 43.0% | 7.2%(+35.8)#8 | 6.9%(+36.1)#302 |
| 9. | Chinook | 43.0% | 7.2%(+35.8)#9 | 6.9%(+36.1)#303 |
| 10. | Index | 40.4% | 7.2%(+33.2)#10 | 6.9%(+33.5)#348 |
| 11. | Greenwater | 40.0% | 7.2%(+32.8)#11 | 6.9%(+33.1)#358 |
| 12. | Marine View | 39.5% | 7.2%(+32.3)#12 | 6.9%(+32.7)#372 |
| 13. | Marblemount | 37.8% | 7.2%(+30.6)#13 | 6.9%(+31.0)#415 |
| 14. | Four Lakes | 33.2% | 7.2%(+26.0)#14 | 6.9%(+26.3)#595 |
| 15. | Yacolt | 30.9% | 7.2%(+23.7)#15 | 6.9%(+24.1)#694 |
| 16. | South Creek | 30.1% | 7.2%(+22.9)#16 | 6.9%(+23.2)#740 |
| 17. | Springdale | 29.8% | 7.2%(+22.6)#17 | 6.9%(+23.0)#756 |
| 18. | Moclips | 29.5% | 7.2%(+22.3)#18 | 6.9%(+22.6)#775 |
| 19. | Skamokawa Valley | 29.4% | 7.2%(+22.2)#19 | 6.9%(+22.5)#778 |
| 20. | Lyle | 29.2% | 7.2%(+22.0)#20 | 6.9%(+22.3)#791 |
| 21. | Torboy | 29.0% | 7.2%(+21.8)#21 | 6.9%(+22.1)#805 |
| 22. | Mckenna | 28.4% | 7.2%(+21.2)#22 | 6.9%(+21.5)#850 |
| 23. | Wilkeson | 27.7% | 7.2%(+20.5)#23 | 6.9%(+20.8)#905 |
| 24. | Malott | 27.5% | 7.2%(+20.3)#24 | 6.9%(+20.6)#919 |
| 25. | Grayland | 26.2% | 7.2%(+19.0)#25 | 6.9%(+19.3)#1,033 |
| 26. | Washtucna | 25.6% | 7.2%(+18.4)#26 | 6.9%(+18.7)#1,078 |
| 27. | East Cathlamet | 25.5% | 7.2%(+18.3)#27 | 6.9%(+18.6)#1,083 |
| 28. | Kahlotus | 23.7% | 7.2%(+16.5)#28 | 6.9%(+16.9)#1,280 |
| 29. | Trout Lake | 23.6% | 7.2%(+16.4)#29 | 6.9%(+16.8)#1,294 |
| 30. | Machias | 22.7% | 7.2%(+15.5)#30 | 6.9%(+15.9)#1,427 |
| 31. | Conconully | 22.4% | 7.2%(+15.2)#31 | 6.9%(+15.5)#1,483 |
| 32. | Deer Park | 22.2% | 7.2%(+15.0)#32 | 6.9%(+15.3)#1,526 |
| 33. | Endicott | 21.8% | 7.2%(+14.6)#33 | 6.9%(+14.9)#1,577 |
| 34. | Marietta Alderwood | 21.2% | 7.2%(+14.0)#34 | 6.9%(+14.4)#1,661 |
| 35. | Puget Island | 20.5% | 7.2%(+13.3)#35 | 6.9%(+13.6)#1,797 |
| 36. | Alder | 20.5% | 7.2%(+13.3)#36 | 6.9%(+13.6)#1,798 |
| 37. | Lake Roesiger | 20.3% | 7.2%(+13.1)#37 | 6.9%(+13.5)#1,823 |
| 38. | Union | 20.2% | 7.2%(+13.0)#38 | 6.9%(+13.3)#1,858 |
| 39. | Clinton | 20.0% | 7.2%(+12.8)#39 | 6.9%(+13.1)#1,918 |
| 40. | Lochsloy | 19.8% | 7.2%(+12.6)#40 | 6.9%(+12.9)#1,949 |
| 41. | North Yelm | 19.7% | 7.2%(+12.5)#41 | 6.9%(+12.8)#1,972 |
| 42. | Marrowstone | 19.6% | 7.2%(+12.4)#42 | 6.9%(+12.7)#1,995 |
| 43. | Lake Bosworth | 19.6% | 7.2%(+12.4)#43 | 6.9%(+12.7)#1,999 |
| 44. | Southworth | 19.5% | 7.2%(+12.3)#44 | 6.9%(+12.6)#2,010 |
| 45. | Cathcart | 19.5% | 7.2%(+12.3)#45 | 6.9%(+12.6)#2,015 |
| 46. | Burley | 19.4% | 7.2%(+12.2)#46 | 6.9%(+12.5)#2,033 |
| 47. | Winthrop | 19.4% | 7.2%(+12.2)#47 | 6.9%(+12.5)#2,041 |
| 48. | Cle Elum | 19.2% | 7.2%(+12.0)#48 | 6.9%(+12.3)#2,091 |
| 49. | Marcus | 19.1% | 7.2%(+12.0)#49 | 6.9%(+12.3)#2,102 |
| 50. | Hamilton | 19.0% | 7.2%(+11.8)#50 | 6.9%(+12.1)#2,138 |
| 51. | May Creek | 18.7% | 7.2%(+11.5)#51 | 6.9%(+11.8)#2,235 |
| 52. | Home | 18.6% | 7.2%(+11.4)#52 | 6.9%(+11.7)#2,245 |
| 53. | Riverpoint | 18.6% | 7.2%(+11.4)#53 | 6.9%(+11.7)#2,250 |
| 54. | Malden | 18.6% | 7.2%(+11.4)#54 | 6.9%(+11.7)#2,252 |
| 55. | Alger | 18.3% | 7.2%(+11.1)#55 | 6.9%(+11.4)#2,330 |
| 56. | Cowiche | 17.8% | 7.2%(+10.6)#56 | 6.9%(+10.9)#2,478 |
| 57. | Ravensdale | 17.8% | 7.2%(+10.6)#57 | 6.9%(+10.9)#2,492 |
| 58. | Gold Bar | 17.5% | 7.2%(+10.3)#58 | 6.9%(+10.6)#2,595 |
| 59. | Rosburg | 17.1% | 7.2%(+9.95)#59 | 6.9%(+10.3)#2,685 |
| 60. | Pateros | 17.1% | 7.2%(+9.90)#60 | 6.9%(+10.2)#2,702 |
| 61. | Markham | 17.1% | 7.2%(+9.88)#61 | 6.9%(+10.2)#2,721 |
| 62. | Thorp | 17.1% | 7.2%(+9.88)#62 | 6.9%(+10.2)#2,724 |
| 63. | Lacrosse | 17.0% | 7.2%(+9.85)#63 | 6.9%(+10.2)#2,731 |
| 64. | Carson | 16.8% | 7.2%(+9.64)#64 | 6.9%(+9.96)#2,797 |
| 65. | West Pasco | 16.8% | 7.2%(+9.63)#65 | 6.9%(+9.95)#2,803 |
| 66. | Pomeroy | 16.8% | 7.2%(+9.62)#66 | 6.9%(+9.94)#2,808 |
| 67. | Clear Lake Cdp Pierce County | 16.7% | 7.2%(+9.53)#67 | 6.9%(+9.85)#2,844 |
| 68. | Oso | 16.7% | 7.2%(+9.47)#68 | 6.9%(+9.79)#2,873 |
| 69. | Nile | 16.7% | 7.2%(+9.47)#69 | 6.9%(+9.79)#2,890 |
| 70. | Lake Morton Berrydale | 16.5% | 7.2%(+9.27)#70 | 6.9%(+9.59)#2,972 |
| 71. | Cusick | 16.4% | 7.2%(+9.17)#71 | 6.9%(+9.49)#3,006 |
| 72. | Creston | 16.2% | 7.2%(+9.02)#72 | 6.9%(+9.34)#3,053 |
| 73. | Davenport | 15.9% | 7.2%(+8.72)#73 | 6.9%(+9.04)#3,173 |
| 74. | Amboy | 15.9% | 7.2%(+8.70)#74 | 6.9%(+9.02)#3,184 |
| 75. | Arlington Heights | 15.8% | 7.2%(+8.62)#75 | 6.9%(+8.94)#3,209 |
| 76. | Connell | 15.4% | 7.2%(+8.16)#76 | 6.9%(+8.48)#3,417 |
| 77. | Custer | 15.3% | 7.2%(+8.10)#77 | 6.9%(+8.42)#3,446 |
| 78. | Port Hadlock Irondale | 15.1% | 7.2%(+7.92)#78 | 6.9%(+8.24)#3,538 |
| 79. | Lyman | 15.1% | 7.2%(+7.90)#79 | 6.9%(+8.22)#3,543 |
| 80. | Venersborg | 15.1% | 7.2%(+7.86)#80 | 6.9%(+8.18)#3,567 |
| 81. | Satsop | 15.0% | 7.2%(+7.77)#81 | 6.9%(+8.09)#3,624 |
| 82. | Meadow Glade | 14.9% | 7.2%(+7.70)#82 | 6.9%(+8.02)#3,669 |
| 83. | Walla Walla East | 14.9% | 7.2%(+7.67)#83 | 6.9%(+7.99)#3,691 |
| 84. | Purdy | 14.8% | 7.2%(+7.61)#84 | 6.9%(+7.93)#3,722 |
| 85. | Summit | 14.7% | 7.2%(+7.52)#85 | 6.9%(+7.84)#3,789 |
| 86. | Concrete | 14.7% | 7.2%(+7.51)#86 | 6.9%(+7.83)#3,791 |
| 87. | Steptoe | 14.6% | 7.2%(+7.39)#87 | 6.9%(+7.71)#3,859 |
| 88. | Woods Creek | 14.6% | 7.2%(+7.36)#88 | 6.9%(+7.68)#3,877 |
| 89. | North Bonneville | 14.5% | 7.2%(+7.35)#89 | 6.9%(+7.67)#3,886 |
| 90. | Baring | 14.5% | 7.2%(+7.35)#90 | 6.9%(+7.67)#3,889 |
| 91. | Sedro Woolley | 14.4% | 7.2%(+7.19)#91 | 6.9%(+7.51)#3,978 |
| 92. | Prairie Heights | 14.3% | 7.2%(+7.05)#92 | 6.9%(+7.37)#4,081 |
| 93. | Clearview | 14.2% | 7.2%(+6.98)#93 | 6.9%(+7.30)#4,107 |
| 94. | South Cle Elum | 14.2% | 7.2%(+6.97)#94 | 6.9%(+7.29)#4,116 |
| 95. | Gleed | 14.1% | 7.2%(+6.94)#95 | 6.9%(+7.26)#4,127 |
| 96. | Edgewood | 14.1% | 7.2%(+6.88)#96 | 6.9%(+7.20)#4,164 |
| 97. | Starbuck | 14.0% | 7.2%(+6.84)#97 | 6.9%(+7.16)#4,191 |
| 98. | Carbonado | 14.0% | 7.2%(+6.83)#98 | 6.9%(+7.15)#4,194 |
| 99. | Bryant | 14.0% | 7.2%(+6.80)#99 | 6.9%(+7.12)#4,215 |
| 100. | Moxee | 14.0% | 7.2%(+6.76)#100 | 6.9%(+7.08)#4,239 |
Common Questions
What are the Top 10 Cities with the Highest Percentage of Population Employed in Construction in Washington?
Top 10 Cities with the Highest Percentage of Population Employed in Construction in Washington are:
#1
100.0%
#2
62.5%
#3
58.3%
#4
53.7%
#5
49.2%
#6
43.5%
#7
43.0%
#8
43.0%
#9
40.4%
#10
40.0%
What city has the Highest Percentage of Population Employed in Construction in Washington?
Rockport has the Highest Percentage of Population Employed in Construction in Washington with 100.0%.
What is the Percentage of Population Employed in Construction in the State of Washington?
Percentage of Population Employed in Construction in Washington is 7.2%.
What is the Percentage of Population Employed in Construction in the United States?
Percentage of Population Employed in Construction in the United States is 6.9%.