Cities with the Highest Percentage of Population Employed in Education Instruction & Library in Washington
RELATED REPORTS & OPTIONS
Education Instruction & Library
Washington
Compare Cities
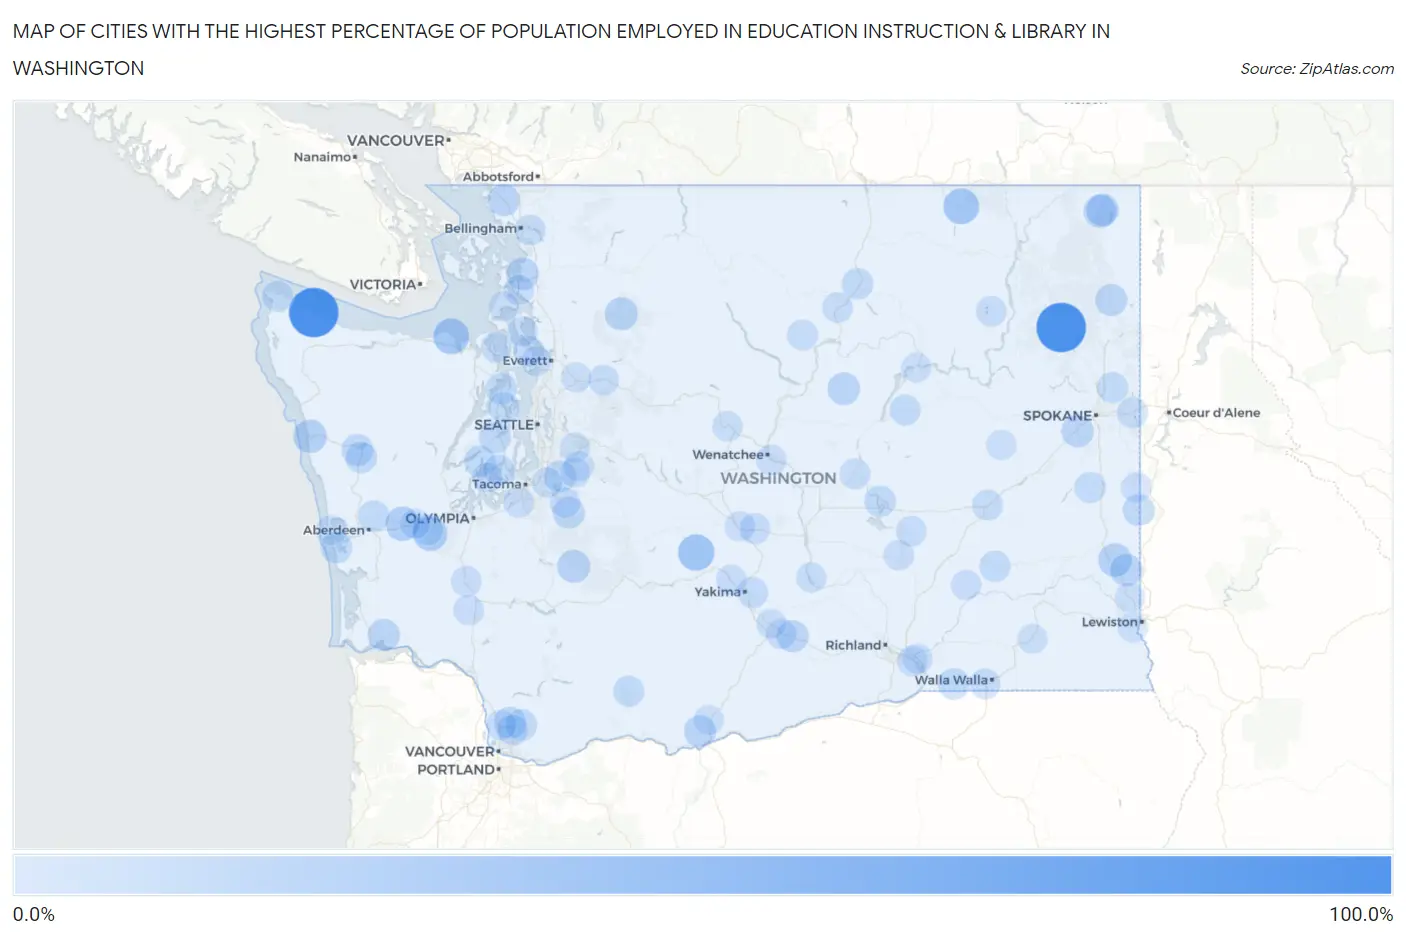
Map of Cities with the Highest Percentage of Population Employed in Education Instruction & Library in Washington
0.0%
100.0%
Cities with the Highest Percentage of Population Employed in Education Instruction & Library in Washington
| City | % Employed | vs State | vs National | |
| 1. | Valley | 100.0% | 5.7%(+94.3)#1 | 6.2%(+93.8)#3 |
| 2. | Sekiu | 100.0% | 5.7%(+94.3)#2 | 6.2%(+93.8)#8 |
| 3. | Sunland Estates | 50.0% | 5.7%(+44.3)#3 | 6.2%(+43.8)#91 |
| 4. | Nile | 37.5% | 5.7%(+31.8)#4 | 6.2%(+31.3)#200 |
| 5. | Curlew | 34.7% | 5.7%(+29.0)#5 | 6.2%(+28.5)#251 |
| 6. | Jamestown | 34.3% | 5.7%(+28.6)#6 | 6.2%(+28.1)#255 |
| 7. | Porter | 28.0% | 5.7%(+22.3)#7 | 6.2%(+21.8)#390 |
| 8. | Brady | 27.4% | 5.7%(+21.7)#8 | 6.2%(+21.3)#404 |
| 9. | Queets | 24.1% | 5.7%(+18.4)#9 | 6.2%(+18.0)#538 |
| 10. | Albion | 23.7% | 5.7%(+18.0)#10 | 6.2%(+17.5)#567 |
| 11. | Metaline | 22.0% | 5.7%(+16.3)#11 | 6.2%(+15.8)#687 |
| 12. | Ashford | 22.0% | 5.7%(+16.3)#12 | 6.2%(+15.8)#688 |
| 13. | Darrington | 21.8% | 5.7%(+16.1)#13 | 6.2%(+15.6)#705 |
| 14. | Bay View | 20.3% | 5.7%(+14.6)#14 | 6.2%(+14.1)#822 |
| 15. | Mansfield | 20.0% | 5.7%(+14.3)#15 | 6.2%(+13.8)#847 |
| 16. | Pullman | 19.7% | 5.7%(+14.0)#16 | 6.2%(+13.5)#882 |
| 17. | Metaline Falls | 19.6% | 5.7%(+13.8)#17 | 6.2%(+13.4)#902 |
| 18. | Four Lakes | 18.6% | 5.7%(+12.9)#18 | 6.2%(+12.4)#1,011 |
| 19. | Deep River | 18.4% | 5.7%(+12.7)#19 | 6.2%(+12.2)#1,027 |
| 20. | Cusick | 18.2% | 5.7%(+12.4)#20 | 6.2%(+12.0)#1,062 |
| 21. | Custer | 18.0% | 5.7%(+12.3)#21 | 6.2%(+11.8)#1,080 |
| 22. | Centerville | 17.9% | 5.7%(+12.2)#22 | 6.2%(+11.7)#1,102 |
| 23. | Outlook | 17.9% | 5.7%(+12.1)#23 | 6.2%(+11.7)#1,106 |
| 24. | Carbonado | 17.3% | 5.7%(+11.5)#24 | 6.2%(+11.1)#1,197 |
| 25. | Amanda Park | 16.7% | 5.7%(+10.9)#25 | 6.2%(+10.5)#1,327 |
| 26. | Gorst | 16.6% | 5.7%(+10.9)#26 | 6.2%(+10.4)#1,346 |
| 27. | Lake Holm | 16.5% | 5.7%(+10.8)#27 | 6.2%(+10.3)#1,364 |
| 28. | Cherry Grove | 16.3% | 5.7%(+10.5)#28 | 6.2%(+10.1)#1,407 |
| 29. | Riverpoint | 16.1% | 5.7%(+10.4)#29 | 6.2%(+9.91)#1,446 |
| 30. | Farmington | 16.1% | 5.7%(+10.3)#30 | 6.2%(+9.89)#1,451 |
| 31. | Allyn | 15.9% | 5.7%(+10.2)#31 | 6.2%(+9.71)#1,494 |
| 32. | Venersborg | 15.6% | 5.7%(+9.86)#32 | 6.2%(+9.42)#1,560 |
| 33. | Neilton | 15.5% | 5.7%(+9.80)#33 | 6.2%(+9.35)#1,574 |
| 34. | Cohassett Beach | 15.5% | 5.7%(+9.78)#34 | 6.2%(+9.33)#1,582 |
| 35. | Omak | 15.5% | 5.7%(+9.75)#35 | 6.2%(+9.31)#1,590 |
| 36. | Cascade Valley | 15.4% | 5.7%(+9.71)#36 | 6.2%(+9.26)#1,600 |
| 37. | Touchet | 15.4% | 5.7%(+9.62)#37 | 6.2%(+9.17)#1,631 |
| 38. | Lofall | 15.3% | 5.7%(+9.55)#38 | 6.2%(+9.10)#1,646 |
| 39. | Aberdeen Gardens | 14.7% | 5.7%(+8.97)#39 | 6.2%(+8.52)#1,786 |
| 40. | Malden | 14.3% | 5.7%(+8.55)#40 | 6.2%(+8.10)#1,914 |
| 41. | Raft Island | 14.2% | 5.7%(+8.49)#41 | 6.2%(+8.05)#1,956 |
| 42. | Green Bluff | 14.2% | 5.7%(+8.42)#42 | 6.2%(+7.97)#1,982 |
| 43. | Washtucna | 14.0% | 5.7%(+8.22)#43 | 6.2%(+7.77)#2,050 |
| 44. | Keyport | 13.9% | 5.7%(+8.13)#44 | 6.2%(+7.69)#2,070 |
| 45. | Trout Lake | 13.7% | 5.7%(+7.94)#45 | 6.2%(+7.49)#2,149 |
| 46. | Terrace Heights | 13.6% | 5.7%(+7.90)#46 | 6.2%(+7.45)#2,155 |
| 47. | Neah Bay | 13.6% | 5.7%(+7.90)#47 | 6.2%(+7.45)#2,156 |
| 48. | Hartline | 13.3% | 5.7%(+7.60)#48 | 6.2%(+7.15)#2,294 |
| 49. | Malone | 12.8% | 5.7%(+7.10)#49 | 6.2%(+6.65)#2,513 |
| 50. | Meadow Glade | 12.6% | 5.7%(+6.91)#50 | 6.2%(+6.46)#2,595 |
| 51. | Methow | 12.5% | 5.7%(+6.76)#51 | 6.2%(+6.32)#2,678 |
| 52. | Ritzville | 12.5% | 5.7%(+6.75)#52 | 6.2%(+6.30)#2,694 |
| 53. | Kittitas | 12.5% | 5.7%(+6.72)#53 | 6.2%(+6.27)#2,704 |
| 54. | Ephrata | 12.4% | 5.7%(+6.64)#54 | 6.2%(+6.19)#2,733 |
| 55. | Langley | 12.1% | 5.7%(+6.41)#55 | 6.2%(+5.96)#2,842 |
| 56. | Twin Lakes | 11.8% | 5.7%(+6.03)#56 | 6.2%(+5.58)#3,040 |
| 57. | Liberty Lake | 11.8% | 5.7%(+6.02)#57 | 6.2%(+5.57)#3,049 |
| 58. | College Place | 11.7% | 5.7%(+5.97)#58 | 6.2%(+5.52)#3,076 |
| 59. | Warden | 11.7% | 5.7%(+5.92)#59 | 6.2%(+5.47)#3,114 |
| 60. | Geneva | 11.6% | 5.7%(+5.85)#60 | 6.2%(+5.41)#3,166 |
| 61. | Startup | 11.6% | 5.7%(+5.83)#61 | 6.2%(+5.38)#3,172 |
| 62. | South Prairie | 11.6% | 5.7%(+5.82)#62 | 6.2%(+5.38)#3,177 |
| 63. | Malott | 11.4% | 5.7%(+5.69)#63 | 6.2%(+5.25)#3,265 |
| 64. | Marrowstone | 11.4% | 5.7%(+5.67)#64 | 6.2%(+5.22)#3,282 |
| 65. | Tekoa | 11.4% | 5.7%(+5.65)#65 | 6.2%(+5.20)#3,297 |
| 66. | Chehalis | 11.4% | 5.7%(+5.64)#66 | 6.2%(+5.19)#3,307 |
| 67. | Winlock | 11.3% | 5.7%(+5.59)#67 | 6.2%(+5.15)#3,342 |
| 68. | Finley | 11.3% | 5.7%(+5.59)#68 | 6.2%(+5.14)#3,344 |
| 69. | Suncrest | 11.0% | 5.7%(+5.30)#69 | 6.2%(+4.85)#3,589 |
| 70. | South Wenatchee | 10.9% | 5.7%(+5.18)#70 | 6.2%(+4.73)#3,687 |
| 71. | Mcchord Afb | 10.8% | 5.7%(+5.11)#71 | 6.2%(+4.66)#3,734 |
| 72. | Othello | 10.8% | 5.7%(+5.04)#72 | 6.2%(+4.59)#3,789 |
| 73. | Eschbach | 10.8% | 5.7%(+5.03)#73 | 6.2%(+4.59)#3,793 |
| 74. | Pacific | 10.7% | 5.7%(+4.96)#74 | 6.2%(+4.51)#3,847 |
| 75. | Ravensdale | 10.7% | 5.7%(+4.94)#75 | 6.2%(+4.49)#3,866 |
| 76. | Granger | 10.5% | 5.7%(+4.77)#76 | 6.2%(+4.32)#4,016 |
| 77. | Ellensburg | 10.5% | 5.7%(+4.75)#77 | 6.2%(+4.30)#4,030 |
| 78. | Fairwood Cdp Spokane County | 10.4% | 5.7%(+4.68)#78 | 6.2%(+4.23)#4,092 |
| 79. | Camano | 10.3% | 5.7%(+4.57)#79 | 6.2%(+4.12)#4,184 |
| 80. | La Conner | 10.2% | 5.7%(+4.44)#80 | 6.2%(+3.99)#4,312 |
| 81. | Desert Aire | 10.2% | 5.7%(+4.44)#81 | 6.2%(+3.99)#4,318 |
| 82. | Kahlotus | 10.2% | 5.7%(+4.43)#82 | 6.2%(+3.99)#4,327 |
| 83. | Leavenworth | 10.2% | 5.7%(+4.42)#83 | 6.2%(+3.97)#4,344 |
| 84. | Home | 10.0% | 5.7%(+4.28)#84 | 6.2%(+3.83)#4,489 |
| 85. | Duluth | 9.9% | 5.7%(+4.18)#85 | 6.2%(+3.73)#4,604 |
| 86. | Grand Coulee | 9.9% | 5.7%(+4.15)#86 | 6.2%(+3.71)#4,625 |
| 87. | Monroe North | 9.8% | 5.7%(+4.11)#87 | 6.2%(+3.67)#4,683 |
| 88. | Burbank | 9.8% | 5.7%(+4.09)#88 | 6.2%(+3.65)#4,712 |
| 89. | Zillah | 9.8% | 5.7%(+4.02)#89 | 6.2%(+3.58)#4,801 |
| 90. | Mirrormont | 9.6% | 5.7%(+3.88)#90 | 6.2%(+3.43)#4,957 |
| 91. | Clarkston Heights Vineland | 9.6% | 5.7%(+3.85)#91 | 6.2%(+3.40)#4,999 |
| 92. | Goldendale | 9.6% | 5.7%(+3.84)#92 | 6.2%(+3.40)#5,001 |
| 93. | Clinton | 9.5% | 5.7%(+3.79)#93 | 6.2%(+3.34)#5,054 |
| 94. | Colton | 9.4% | 5.7%(+3.70)#94 | 6.2%(+3.25)#5,173 |
| 95. | Ocean Shores | 9.3% | 5.7%(+3.53)#95 | 6.2%(+3.09)#5,362 |
| 96. | Dayton | 9.2% | 5.7%(+3.50)#96 | 6.2%(+3.06)#5,412 |
| 97. | Harrington | 9.2% | 5.7%(+3.47)#97 | 6.2%(+3.03)#5,443 |
| 98. | Black Diamond | 9.2% | 5.7%(+3.42)#98 | 6.2%(+2.97)#5,511 |
| 99. | Elma | 9.1% | 5.7%(+3.41)#99 | 6.2%(+2.97)#5,524 |
| 100. | Oak Harbor | 9.1% | 5.7%(+3.41)#100 | 6.2%(+2.97)#5,525 |
Common Questions
What are the Top 10 Cities with the Highest Percentage of Population Employed in Education Instruction & Library in Washington?
Top 10 Cities with the Highest Percentage of Population Employed in Education Instruction & Library in Washington are:
What city has the Highest Percentage of Population Employed in Education Instruction & Library in Washington?
Valley has the Highest Percentage of Population Employed in Education Instruction & Library in Washington with 100.0%.
What is the Percentage of Population Employed in Education Instruction & Library in the State of Washington?
Percentage of Population Employed in Education Instruction & Library in Washington is 5.7%.
What is the Percentage of Population Employed in Education Instruction & Library in the United States?
Percentage of Population Employed in Education Instruction & Library in the United States is 6.2%.