Cities with the Highest Percentage of Chippewa Population in Washington
RELATED REPORTS & OPTIONS
Chippewa
Washington
Compare Cities
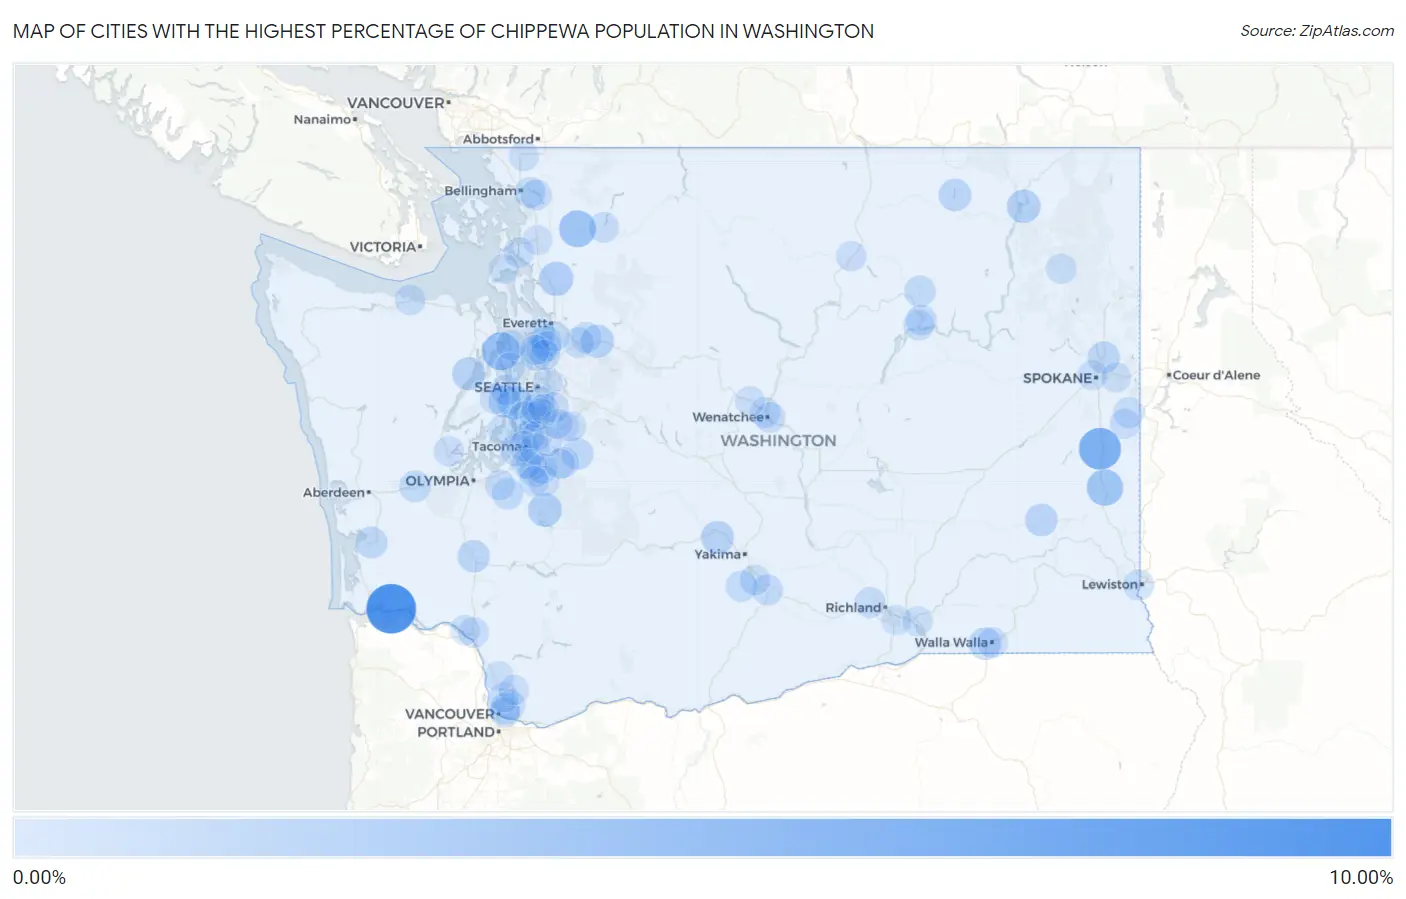
Map of Cities with the Highest Percentage of Chippewa Population in Washington
0.00%
10.00%
Cities with the Highest Percentage of Chippewa Population in Washington
| City | Chippewa | vs State | vs National | |
| 1. | Altoona | 9.43% | 0.10%(+9.33)#1 | 0.058%(+9.38)#98 |
| 2. | Rosalia | 5.68% | 0.10%(+5.58)#2 | 0.058%(+5.62)#152 |
| 3. | Lofall | 3.73% | 0.10%(+3.63)#3 | 0.058%(+3.67)#214 |
| 4. | Hamilton | 3.19% | 0.10%(+3.09)#4 | 0.058%(+3.13)#249 |
| 5. | Steptoe | 3.00% | 0.10%(+2.90)#5 | 0.058%(+2.94)#267 |
| 6. | Bryant | 1.97% | 0.10%(+1.87)#6 | 0.058%(+1.91)#382 |
| 7. | Southworth | 1.84% | 0.10%(+1.74)#7 | 0.058%(+1.79)#399 |
| 8. | Eatonville | 1.72% | 0.10%(+1.62)#8 | 0.058%(+1.66)#418 |
| 9. | Marcus | 1.65% | 0.10%(+1.55)#9 | 0.058%(+1.59)#436 |
| 10. | Tieton | 1.49% | 0.10%(+1.39)#10 | 0.058%(+1.43)#474 |
| 11. | Brinnon | 1.49% | 0.10%(+1.39)#11 | 0.058%(+1.43)#475 |
| 12. | Sultan | 1.43% | 0.10%(+1.33)#12 | 0.058%(+1.37)#489 |
| 13. | East Port Orchard | 1.25% | 0.10%(+1.15)#13 | 0.058%(+1.20)#549 |
| 14. | Vashon | 1.22% | 0.10%(+1.12)#14 | 0.058%(+1.17)#564 |
| 15. | Lacrosse | 1.20% | 0.10%(+1.10)#15 | 0.058%(+1.14)#572 |
| 16. | Curlew Lake | 1.20% | 0.10%(+1.10)#16 | 0.058%(+1.14)#573 |
| 17. | Napavine | 1.12% | 0.10%(+1.02)#17 | 0.058%(+1.06)#594 |
| 18. | Garrett | 1.07% | 0.10%(+0.967)#18 | 0.058%(+1.01)#620 |
| 19. | Mead | 1.03% | 0.10%(+0.931)#19 | 0.058%(+0.974)#629 |
| 20. | Enumclaw | 0.93% | 0.10%(+0.826)#20 | 0.058%(+0.869)#683 |
| 21. | South Bend | 0.86% | 0.10%(+0.760)#21 | 0.058%(+0.803)#713 |
| 22. | Fircrest | 0.75% | 0.10%(+0.646)#22 | 0.058%(+0.689)#781 |
| 23. | Elma | 0.73% | 0.10%(+0.629)#23 | 0.058%(+0.672)#795 |
| 24. | Esperance | 0.70% | 0.10%(+0.602)#24 | 0.058%(+0.645)#824 |
| 25. | North Yelm | 0.68% | 0.10%(+0.581)#25 | 0.058%(+0.624)#840 |
| 26. | Lake Stickney | 0.68% | 0.10%(+0.581)#26 | 0.058%(+0.624)#841 |
| 27. | Dash Point | 0.65% | 0.10%(+0.549)#27 | 0.058%(+0.592)#878 |
| 28. | Nespelem | 0.65% | 0.10%(+0.544)#28 | 0.058%(+0.587)#883 |
| 29. | Harrah | 0.63% | 0.10%(+0.524)#29 | 0.058%(+0.567)#900 |
| 30. | Frederickson | 0.59% | 0.10%(+0.489)#30 | 0.058%(+0.532)#936 |
| 31. | Clover Creek | 0.58% | 0.10%(+0.484)#31 | 0.058%(+0.527)#943 |
| 32. | Toppenish | 0.50% | 0.10%(+0.398)#32 | 0.058%(+0.441)#1,021 |
| 33. | Geneva | 0.48% | 0.10%(+0.376)#33 | 0.058%(+0.419)#1,047 |
| 34. | Minnehaha | 0.47% | 0.10%(+0.374)#34 | 0.058%(+0.417)#1,052 |
| 35. | Rockford | 0.47% | 0.10%(+0.364)#35 | 0.058%(+0.407)#1,063 |
| 36. | Prairie Heights | 0.45% | 0.10%(+0.353)#36 | 0.058%(+0.396)#1,078 |
| 37. | Sudden Valley | 0.45% | 0.10%(+0.350)#37 | 0.058%(+0.393)#1,084 |
| 38. | Graham | 0.45% | 0.10%(+0.345)#38 | 0.058%(+0.388)#1,090 |
| 39. | Clarkston | 0.42% | 0.10%(+0.315)#39 | 0.058%(+0.358)#1,136 |
| 40. | Woods Creek | 0.40% | 0.10%(+0.296)#40 | 0.058%(+0.340)#1,166 |
| 41. | Monroe | 0.39% | 0.10%(+0.291)#41 | 0.058%(+0.334)#1,173 |
| 42. | Wapato | 0.39% | 0.10%(+0.291)#42 | 0.058%(+0.334)#1,179 |
| 43. | Lynnwood | 0.39% | 0.10%(+0.291)#43 | 0.058%(+0.334)#1,180 |
| 44. | Concrete | 0.38% | 0.10%(+0.278)#44 | 0.058%(+0.321)#1,201 |
| 45. | Fife | 0.38% | 0.10%(+0.276)#45 | 0.058%(+0.319)#1,203 |
| 46. | Coulee Dam | 0.37% | 0.10%(+0.274)#46 | 0.058%(+0.317)#1,206 |
| 47. | Enetai | 0.37% | 0.10%(+0.274)#47 | 0.058%(+0.317)#1,208 |
| 48. | Wenatchee | 0.36% | 0.10%(+0.264)#48 | 0.058%(+0.307)#1,221 |
| 49. | Elmer City | 0.36% | 0.10%(+0.262)#49 | 0.058%(+0.305)#1,226 |
| 50. | East Wenatchee | 0.34% | 0.10%(+0.240)#50 | 0.058%(+0.283)#1,267 |
| 51. | Nisqually Indian Community | 0.34% | 0.10%(+0.236)#51 | 0.058%(+0.279)#1,275 |
| 52. | West Richland | 0.33% | 0.10%(+0.232)#52 | 0.058%(+0.275)#1,288 |
| 53. | Port Angeles | 0.32% | 0.10%(+0.224)#53 | 0.058%(+0.267)#1,307 |
| 54. | Five Corners | 0.31% | 0.10%(+0.210)#54 | 0.058%(+0.253)#1,336 |
| 55. | Walla Walla | 0.31% | 0.10%(+0.207)#55 | 0.058%(+0.250)#1,344 |
| 56. | Rosedale | 0.30% | 0.10%(+0.203)#56 | 0.058%(+0.246)#1,348 |
| 57. | La Conner | 0.30% | 0.10%(+0.199)#57 | 0.058%(+0.242)#1,358 |
| 58. | Medina | 0.27% | 0.10%(+0.173)#58 | 0.058%(+0.216)#1,406 |
| 59. | Okanogan | 0.27% | 0.10%(+0.164)#59 | 0.058%(+0.207)#1,420 |
| 60. | Mukilteo | 0.26% | 0.10%(+0.157)#60 | 0.058%(+0.200)#1,440 |
| 61. | Shelton | 0.25% | 0.10%(+0.147)#61 | 0.058%(+0.190)#1,468 |
| 62. | Tacoma | 0.24% | 0.10%(+0.138)#62 | 0.058%(+0.181)#1,501 |
| 63. | Port Gamble Tribal Community | 0.24% | 0.10%(+0.134)#63 | 0.058%(+0.178)#1,509 |
| 64. | Boulevard Park | 0.23% | 0.10%(+0.126)#64 | 0.058%(+0.169)#1,536 |
| 65. | Covington | 0.23% | 0.10%(+0.125)#65 | 0.058%(+0.168)#1,539 |
| 66. | Bremerton | 0.22% | 0.10%(+0.122)#66 | 0.058%(+0.165)#1,546 |
| 67. | Kelso | 0.22% | 0.10%(+0.120)#67 | 0.058%(+0.163)#1,550 |
| 68. | Prairie Ridge | 0.21% | 0.10%(+0.108)#68 | 0.058%(+0.151)#1,584 |
| 69. | Chewelah | 0.20% | 0.10%(+0.099)#69 | 0.058%(+0.142)#1,601 |
| 70. | Renton | 0.19% | 0.10%(+0.084)#70 | 0.058%(+0.127)#1,645 |
| 71. | Seatac | 0.18% | 0.10%(+0.084)#71 | 0.058%(+0.127)#1,647 |
| 72. | Vancouver | 0.18% | 0.10%(+0.079)#72 | 0.058%(+0.122)#1,668 |
| 73. | Normandy Park | 0.18% | 0.10%(+0.078)#73 | 0.058%(+0.121)#1,669 |
| 74. | Burien | 0.16% | 0.10%(+0.062)#74 | 0.058%(+0.105)#1,748 |
| 75. | Fairfield | 0.16% | 0.10%(+0.062)#75 | 0.058%(+0.105)#1,749 |
| 76. | Larch Way | 0.16% | 0.10%(+0.058)#76 | 0.058%(+0.101)#1,762 |
| 77. | Spokane | 0.16% | 0.10%(+0.058)#77 | 0.058%(+0.101)#1,764 |
| 78. | Federal Way | 0.16% | 0.10%(+0.055)#78 | 0.058%(+0.098)#1,773 |
| 79. | Cashmere | 0.15% | 0.10%(+0.053)#79 | 0.058%(+0.096)#1,781 |
| 80. | South Hill | 0.15% | 0.10%(+0.050)#80 | 0.058%(+0.093)#1,799 |
| 81. | Kennewick | 0.15% | 0.10%(+0.047)#81 | 0.058%(+0.090)#1,808 |
| 82. | Burbank | 0.15% | 0.10%(+0.047)#82 | 0.058%(+0.090)#1,809 |
| 83. | Lynden | 0.15% | 0.10%(+0.045)#83 | 0.058%(+0.089)#1,817 |
| 84. | Mount Vista | 0.14% | 0.10%(+0.043)#84 | 0.058%(+0.086)#1,828 |
| 85. | La Center | 0.14% | 0.10%(+0.035)#85 | 0.058%(+0.078)#1,863 |
| 86. | Spokane Valley | 0.13% | 0.10%(+0.031)#86 | 0.058%(+0.074)#1,878 |
| 87. | Battle Ground | 0.13% | 0.10%(+0.028)#87 | 0.058%(+0.071)#1,884 |
| 88. | Longview | 0.13% | 0.10%(+0.026)#88 | 0.058%(+0.069)#1,889 |
| 89. | Parkland | 0.12% | 0.10%(+0.024)#89 | 0.058%(+0.067)#1,900 |
| 90. | Maple Valley | 0.11% | 0.10%(+0.014)#90 | 0.058%(+0.057)#1,953 |
| 91. | Eastmont | 0.11% | 0.10%(+0.011)#91 | 0.058%(+0.054)#1,963 |
| 92. | Brier | 0.11% | 0.10%(+0.006)#92 | 0.058%(+0.049)#1,982 |
| 93. | Tukwila | 0.097% | 0.10%(-0.003)#93 | 0.058%(+0.040)#2,024 |
| 94. | Edmonds | 0.094% | 0.10%(-0.007)#94 | 0.058%(+0.036)#2,034 |
| 95. | Suquamish | 0.092% | 0.10%(-0.008)#95 | 0.058%(+0.035)#2,041 |
| 96. | Algona | 0.092% | 0.10%(-0.009)#96 | 0.058%(+0.034)#2,044 |
| 97. | Burlington | 0.085% | 0.10%(-0.015)#97 | 0.058%(+0.028)#2,081 |
| 98. | Elk Plain | 0.084% | 0.10%(-0.016)#98 | 0.058%(+0.027)#2,086 |
| 99. | Kent | 0.083% | 0.10%(-0.018)#99 | 0.058%(+0.025)#2,095 |
| 100. | Oak Harbor | 0.082% | 0.10%(-0.019)#100 | 0.058%(+0.024)#2,104 |
Common Questions
What are the Top 10 Cities with the Highest Percentage of Chippewa Population in Washington?
Top 10 Cities with the Highest Percentage of Chippewa Population in Washington are:
#1
9.43%
#2
5.68%
#3
3.73%
#4
3.19%
#5
3.00%
#6
1.97%
#7
1.84%
#8
1.72%
#9
1.65%
#10
1.49%
What city has the Highest Percentage of Chippewa Population in Washington?
Altoona has the Highest Percentage of Chippewa Population in Washington with 9.43%.
What is the Percentage of Chippewa Population in the State of Washington?
Percentage of Chippewa Population in Washington is 0.10%.
What is the Percentage of Chippewa Population in the United States?
Percentage of Chippewa Population in the United States is 0.058%.