Cities with the Highest Percentage of Guatemalan Population in Washington
RELATED REPORTS & OPTIONS
Guatemalan
Washington
Compare Cities
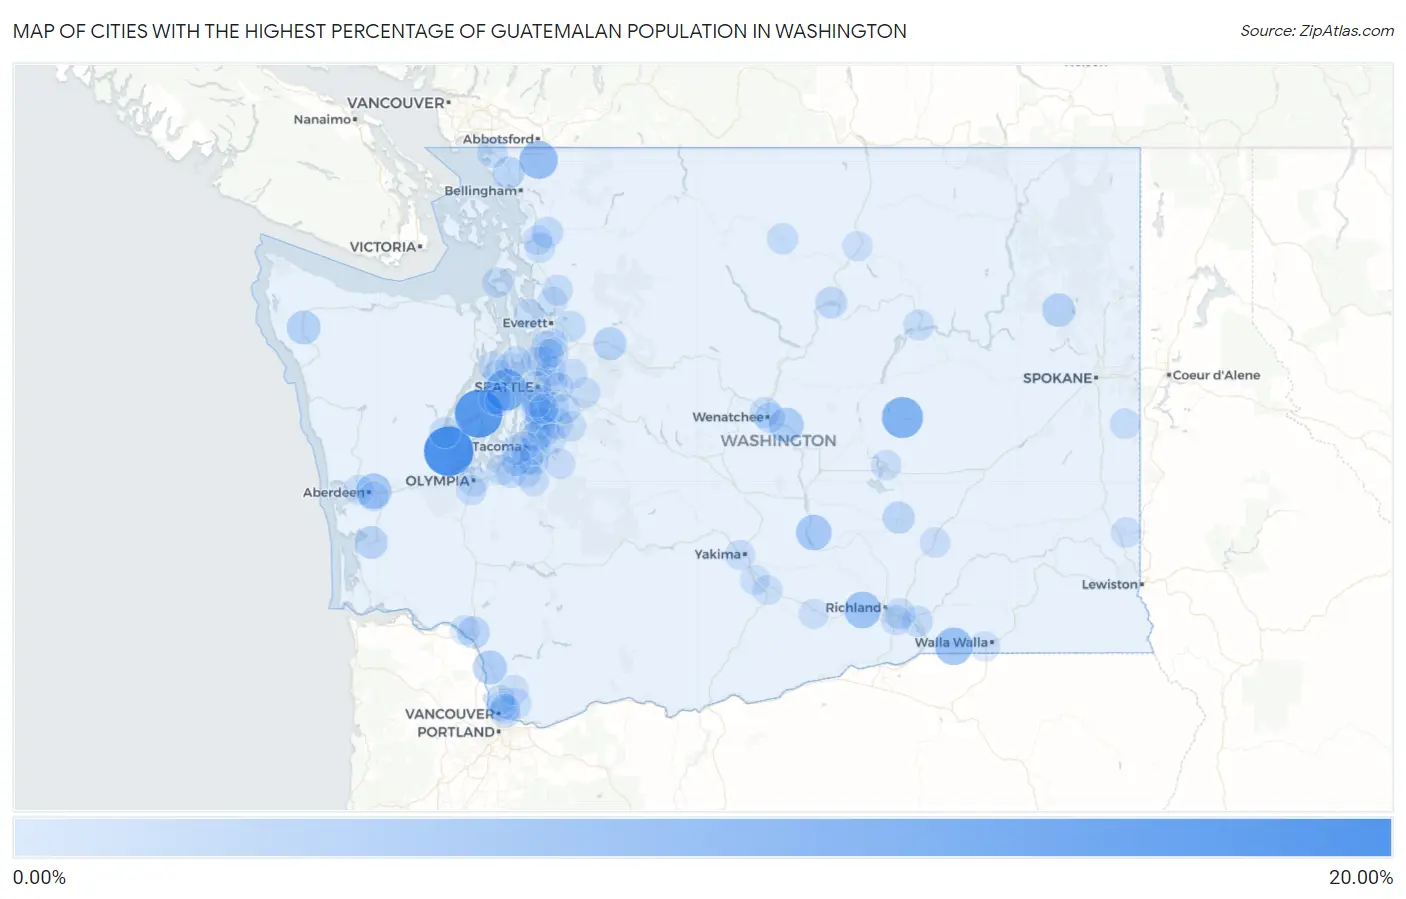
Map of Cities with the Highest Percentage of Guatemalan Population in Washington
0.00%
20.00%
Cities with the Highest Percentage of Guatemalan Population in Washington
| City | Guatemalan | vs State | vs National | |
| 1. | Shelton | 15.39% | 0.30%(+15.1)#1 | 0.50%(+14.9)#65 |
| 2. | Belfair | 13.99% | 0.30%(+13.7)#2 | 0.50%(+13.5)#73 |
| 3. | Enetai | 8.77% | 0.30%(+8.47)#3 | 0.50%(+8.27)#157 |
| 4. | Wilson Creek | 8.62% | 0.30%(+8.32)#4 | 0.50%(+8.12)#158 |
| 5. | Nooksack | 6.14% | 0.30%(+5.84)#5 | 0.50%(+5.63)#255 |
| 6. | Touchet | 5.77% | 0.30%(+5.47)#6 | 0.50%(+5.27)#280 |
| 7. | Benton City | 5.17% | 0.30%(+4.87)#7 | 0.50%(+4.67)#312 |
| 8. | Mattawa | 4.28% | 0.30%(+3.98)#8 | 0.50%(+3.77)#392 |
| 9. | Aberdeen | 4.27% | 0.30%(+3.97)#9 | 0.50%(+3.76)#393 |
| 10. | Rock Island | 3.65% | 0.30%(+3.35)#10 | 0.50%(+3.15)#464 |
| 11. | Woodland | 3.08% | 0.30%(+2.78)#11 | 0.50%(+2.57)#552 |
| 12. | Forks | 2.96% | 0.30%(+2.66)#12 | 0.50%(+2.45)#578 |
| 13. | Springdale | 2.53% | 0.30%(+2.23)#13 | 0.50%(+2.03)#691 |
| 14. | Gold Bar | 2.40% | 0.30%(+2.10)#14 | 0.50%(+1.89)#732 |
| 15. | South Bend | 2.10% | 0.30%(+1.80)#15 | 0.50%(+1.59)#815 |
| 16. | Ferndale | 1.76% | 0.30%(+1.46)#16 | 0.50%(+1.25)#940 |
| 17. | Othello | 1.67% | 0.30%(+1.37)#17 | 0.50%(+1.16)#980 |
| 18. | Kelso | 1.65% | 0.30%(+1.35)#18 | 0.50%(+1.15)#996 |
| 19. | Brewster | 1.47% | 0.30%(+1.17)#19 | 0.50%(+0.968)#1,094 |
| 20. | Bremerton | 1.44% | 0.30%(+1.14)#20 | 0.50%(+0.937)#1,123 |
| 21. | Seatac | 1.35% | 0.30%(+1.05)#21 | 0.50%(+0.844)#1,186 |
| 22. | Lakeland North | 1.32% | 0.30%(+1.02)#22 | 0.50%(+0.813)#1,205 |
| 23. | Boulevard Park | 1.31% | 0.30%(+1.02)#23 | 0.50%(+0.811)#1,210 |
| 24. | Fife | 1.27% | 0.30%(+0.968)#24 | 0.50%(+0.763)#1,241 |
| 25. | Midland | 1.16% | 0.30%(+0.856)#25 | 0.50%(+0.652)#1,340 |
| 26. | Des Moines | 1.14% | 0.30%(+0.836)#26 | 0.50%(+0.632)#1,367 |
| 27. | Burien | 1.07% | 0.30%(+0.770)#27 | 0.50%(+0.566)#1,431 |
| 28. | Sedro Woolley | 1.07% | 0.30%(+0.767)#28 | 0.50%(+0.562)#1,436 |
| 29. | Winthrop | 0.98% | 0.30%(+0.681)#29 | 0.50%(+0.476)#1,525 |
| 30. | Everett | 0.95% | 0.30%(+0.648)#30 | 0.50%(+0.444)#1,563 |
| 31. | Skokomish | 0.93% | 0.30%(+0.632)#31 | 0.50%(+0.428)#1,580 |
| 32. | Vancouver | 0.88% | 0.30%(+0.585)#32 | 0.50%(+0.381)#1,633 |
| 33. | Burbank | 0.83% | 0.30%(+0.528)#33 | 0.50%(+0.324)#1,727 |
| 34. | Wenatchee | 0.83% | 0.30%(+0.526)#34 | 0.50%(+0.322)#1,730 |
| 35. | Summit | 0.76% | 0.30%(+0.460)#35 | 0.50%(+0.256)#1,817 |
| 36. | Federal Way | 0.75% | 0.30%(+0.455)#36 | 0.50%(+0.251)#1,823 |
| 37. | Coulee Dam | 0.75% | 0.30%(+0.450)#37 | 0.50%(+0.246)#1,828 |
| 38. | Pasco | 0.74% | 0.30%(+0.442)#38 | 0.50%(+0.237)#1,853 |
| 39. | East Wenatchee | 0.73% | 0.30%(+0.432)#39 | 0.50%(+0.228)#1,879 |
| 40. | Kent | 0.70% | 0.30%(+0.396)#40 | 0.50%(+0.192)#1,941 |
| 41. | Fairfield | 0.65% | 0.30%(+0.352)#41 | 0.50%(+0.147)#2,018 |
| 42. | Arlington | 0.64% | 0.30%(+0.337)#42 | 0.50%(+0.133)#2,049 |
| 43. | Larch Way | 0.64% | 0.30%(+0.337)#43 | 0.50%(+0.132)#2,050 |
| 44. | Blaine | 0.63% | 0.30%(+0.331)#44 | 0.50%(+0.127)#2,060 |
| 45. | Hunts Point | 0.62% | 0.30%(+0.319)#45 | 0.50%(+0.115)#2,088 |
| 46. | Renton | 0.58% | 0.30%(+0.285)#46 | 0.50%(+0.081)#2,168 |
| 47. | Fort Lewis | 0.54% | 0.30%(+0.243)#47 | 0.50%(+0.039)#2,267 |
| 48. | Coupeville | 0.54% | 0.30%(+0.239)#48 | 0.50%(+0.035)#2,277 |
| 49. | Dupont | 0.53% | 0.30%(+0.233)#49 | 0.50%(+0.028)#2,295 |
| 50. | Lake Forest Park | 0.51% | 0.30%(+0.213)#50 | 0.50%(+0.008)#2,345 |
| 51. | Connell | 0.50% | 0.30%(+0.203)#51 | 0.50%(-0.002)#2,377 |
| 52. | Kennewick | 0.50% | 0.30%(+0.198)#52 | 0.50%(-0.007)#2,390 |
| 53. | Fall City | 0.50% | 0.30%(+0.196)#53 | 0.50%(-0.009)#2,395 |
| 54. | Orchards | 0.49% | 0.30%(+0.186)#54 | 0.50%(-0.018)#2,417 |
| 55. | White Center | 0.48% | 0.30%(+0.185)#55 | 0.50%(-0.020)#2,426 |
| 56. | Mount Vernon | 0.47% | 0.30%(+0.170)#56 | 0.50%(-0.034)#2,462 |
| 57. | Olympia | 0.47% | 0.30%(+0.168)#57 | 0.50%(-0.036)#2,470 |
| 58. | Auburn | 0.47% | 0.30%(+0.167)#58 | 0.50%(-0.037)#2,472 |
| 59. | Mill Creek | 0.47% | 0.30%(+0.167)#59 | 0.50%(-0.038)#2,475 |
| 60. | Prairie Ridge | 0.47% | 0.30%(+0.166)#60 | 0.50%(-0.038)#2,479 |
| 61. | Kirkland | 0.41% | 0.30%(+0.112)#61 | 0.50%(-0.092)#2,646 |
| 62. | Spanaway | 0.40% | 0.30%(+0.103)#62 | 0.50%(-0.101)#2,676 |
| 63. | Fairwood Cdp King County | 0.39% | 0.30%(+0.092)#63 | 0.50%(-0.112)#2,717 |
| 64. | Silverdale | 0.39% | 0.30%(+0.086)#64 | 0.50%(-0.118)#2,741 |
| 65. | Moses Lake | 0.37% | 0.30%(+0.066)#65 | 0.50%(-0.138)#2,819 |
| 66. | Pullman | 0.36% | 0.30%(+0.057)#66 | 0.50%(-0.148)#2,856 |
| 67. | Yakima | 0.34% | 0.30%(+0.042)#67 | 0.50%(-0.162)#2,934 |
| 68. | Maple Valley | 0.33% | 0.30%(+0.030)#68 | 0.50%(-0.174)#2,974 |
| 69. | Hoquiam | 0.32% | 0.30%(+0.020)#69 | 0.50%(-0.184)#3,009 |
| 70. | Tumwater | 0.30% | 0.30%(+0.001)#70 | 0.50%(-0.204)#3,112 |
| 71. | Union Hill Novelty Hill | 0.28% | 0.30%(-0.015)#71 | 0.50%(-0.219)#3,183 |
| 72. | Fircrest | 0.28% | 0.30%(-0.018)#72 | 0.50%(-0.222)#3,200 |
| 73. | Hazel Dell | 0.26% | 0.30%(-0.044)#73 | 0.50%(-0.249)#3,333 |
| 74. | Shoreline | 0.25% | 0.30%(-0.048)#74 | 0.50%(-0.252)#3,354 |
| 75. | Toppenish | 0.25% | 0.30%(-0.050)#75 | 0.50%(-0.255)#3,369 |
| 76. | Bangor Base | 0.25% | 0.30%(-0.052)#76 | 0.50%(-0.256)#3,383 |
| 77. | Omak | 0.25% | 0.30%(-0.054)#77 | 0.50%(-0.258)#3,398 |
| 78. | Elk Plain | 0.24% | 0.30%(-0.061)#78 | 0.50%(-0.265)#3,438 |
| 79. | Marysville | 0.24% | 0.30%(-0.061)#79 | 0.50%(-0.266)#3,442 |
| 80. | College Place | 0.23% | 0.30%(-0.065)#80 | 0.50%(-0.269)#3,463 |
| 81. | Suquamish | 0.23% | 0.30%(-0.069)#81 | 0.50%(-0.273)#3,493 |
| 82. | Bellevue | 0.23% | 0.30%(-0.069)#82 | 0.50%(-0.274)#3,497 |
| 83. | Cosmopolis | 0.22% | 0.30%(-0.078)#83 | 0.50%(-0.282)#3,543 |
| 84. | Port Orchard | 0.21% | 0.30%(-0.085)#84 | 0.50%(-0.289)#3,577 |
| 85. | Salmon Creek | 0.21% | 0.30%(-0.088)#85 | 0.50%(-0.292)#3,595 |
| 86. | Longview | 0.20% | 0.30%(-0.096)#86 | 0.50%(-0.300)#3,639 |
| 87. | Seattle | 0.20% | 0.30%(-0.104)#87 | 0.50%(-0.308)#3,689 |
| 88. | Wapato | 0.20% | 0.30%(-0.104)#88 | 0.50%(-0.308)#3,692 |
| 89. | Langley | 0.19% | 0.30%(-0.114)#89 | 0.50%(-0.318)#3,756 |
| 90. | Battle Ground | 0.18% | 0.30%(-0.118)#90 | 0.50%(-0.322)#3,775 |
| 91. | Burlington | 0.18% | 0.30%(-0.118)#91 | 0.50%(-0.323)#3,777 |
| 92. | Grandview | 0.17% | 0.30%(-0.126)#92 | 0.50%(-0.330)#3,828 |
| 93. | East Renton Highlands | 0.17% | 0.30%(-0.126)#93 | 0.50%(-0.330)#3,829 |
| 94. | Tacoma | 0.17% | 0.30%(-0.130)#94 | 0.50%(-0.334)#3,853 |
| 95. | Indianola | 0.17% | 0.30%(-0.131)#95 | 0.50%(-0.335)#3,863 |
| 96. | Tukwila | 0.17% | 0.30%(-0.133)#96 | 0.50%(-0.337)#3,875 |
| 97. | Bothell East | 0.16% | 0.30%(-0.135)#97 | 0.50%(-0.339)#3,891 |
| 98. | Minnehaha | 0.16% | 0.30%(-0.144)#98 | 0.50%(-0.349)#3,947 |
| 99. | Bothell West | 0.15% | 0.30%(-0.149)#99 | 0.50%(-0.353)#3,971 |
| 100. | Lakewood | 0.15% | 0.30%(-0.151)#100 | 0.50%(-0.355)#3,987 |
Common Questions
What are the Top 10 Cities with the Highest Percentage of Guatemalan Population in Washington?
Top 10 Cities with the Highest Percentage of Guatemalan Population in Washington are:
#1
15.39%
#2
13.99%
#3
8.77%
#4
8.62%
#5
6.14%
#6
5.77%
#7
5.17%
#8
4.28%
#9
4.27%
#10
3.65%
What city has the Highest Percentage of Guatemalan Population in Washington?
Shelton has the Highest Percentage of Guatemalan Population in Washington with 15.39%.
What is the Percentage of Guatemalan Population in the State of Washington?
Percentage of Guatemalan Population in Washington is 0.30%.
What is the Percentage of Guatemalan Population in the United States?
Percentage of Guatemalan Population in the United States is 0.50%.