Long Beach, WA Map & Demographics
Long Beach Map
Long Beach Overview
$28,188
PER CAPITA INCOME
$70,096
AVG FAMILY INCOME
$47,188
AVG HOUSEHOLD INCOME
0.42
INEQUALITY / GINI INDEX
1,831
TOTAL POPULATION
809
MALE POPULATION
1,022
FEMALE POPULATION
79.16
MALES / 100 FEMALES
126.33
FEMALES / 100 MALES
51.3
MEDIAN AGE
2.9
AVG FAMILY SIZE
2.2
AVG HOUSEHOLD SIZE
618
LABOR FORCE [ PEOPLE ]
38.2%
PERCENT IN LABOR FORCE
Long Beach Zip Codes
Long Beach Area Codes
Income in Long Beach
Income Overview in Long Beach
Per Capita Income in Long Beach is $28,188, while median incomes of families and households are $70,096 and $47,188 respectively.
| Characteristic | Number | Measure |
| Per Capita Income | 1,831 | $28,188 |
| Median Family Income | 415 | $70,096 |
| Mean Family Income | 415 | $79,367 |
| Median Household Income | 841 | $47,188 |
| Mean Household Income | 841 | $59,533 |
| Income Deficit | 415 | $0 |
| Wage / Income Gap (%) | 1,831 | 0.00% |
| Wage / Income Gap ($) | 1,831 | 100.00¢ per $1 |
| Gini / Inequality Index | 1,831 | 0.42 |
Earnings by Sex in Long Beach
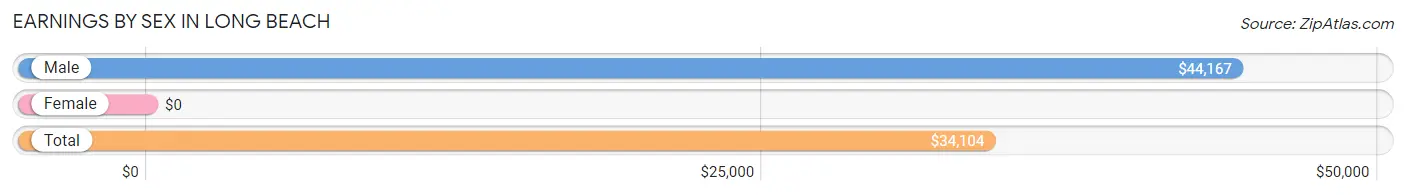
| Sex | Number | Average Earnings |
| Male | 316 (46.3%) | $44,167 |
| Female | 366 (53.7%) | $0 |
| Total | 682 (100.0%) | $34,104 |
Earnings by Sex by Income Bracket in Long Beach
The most common earnings brackets in Long Beach are $100,000+ for men (38 | 12.0%) and $30,000 to $34,999 for women (46 | 12.6%).
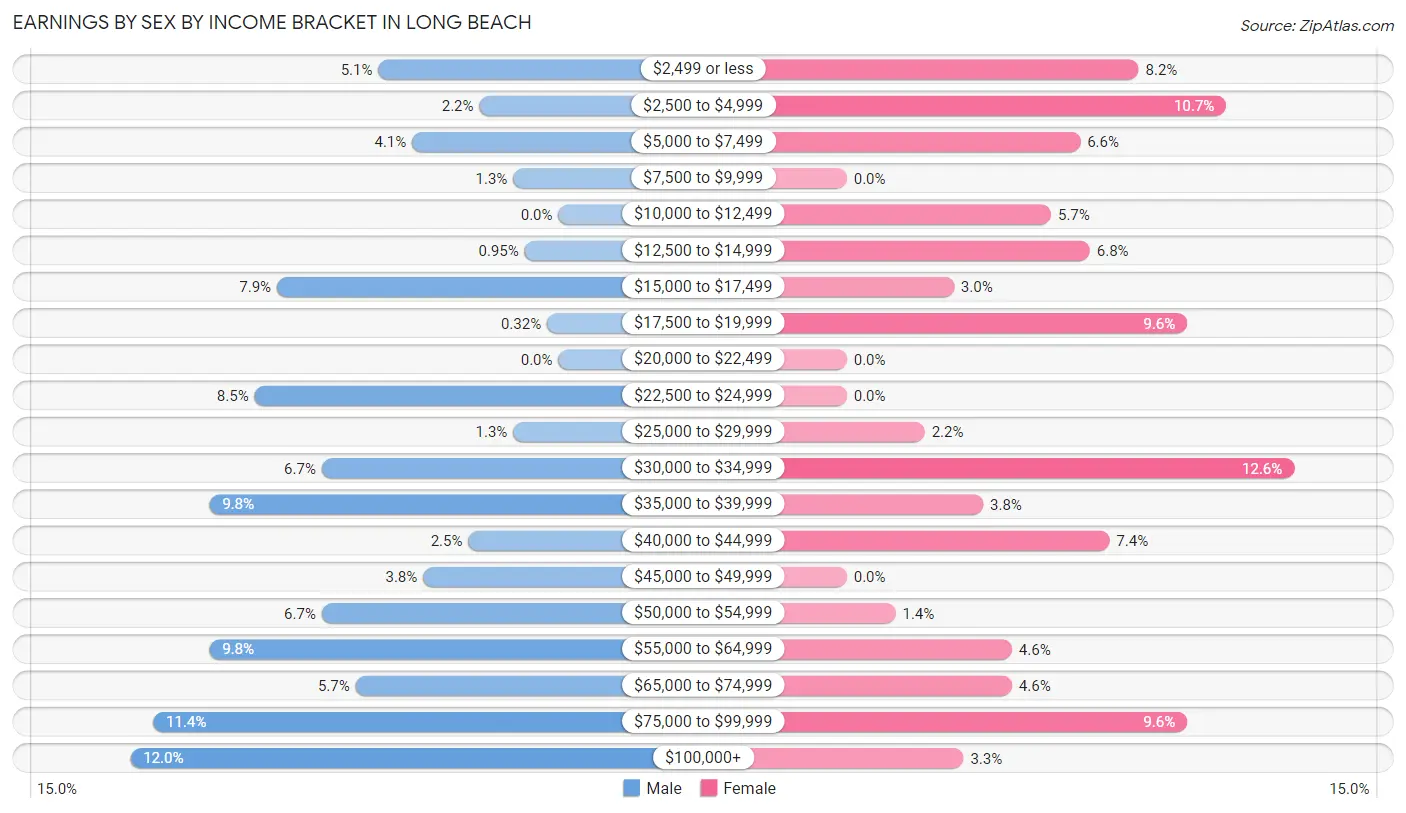
| Income | Male | Female |
| $2,499 or less | 16 (5.1%) | 30 (8.2%) |
| $2,500 to $4,999 | 7 (2.2%) | 39 (10.7%) |
| $5,000 to $7,499 | 13 (4.1%) | 24 (6.6%) |
| $7,500 to $9,999 | 4 (1.3%) | 0 (0.0%) |
| $10,000 to $12,499 | 0 (0.0%) | 21 (5.7%) |
| $12,500 to $14,999 | 3 (0.9%) | 25 (6.8%) |
| $15,000 to $17,499 | 25 (7.9%) | 11 (3.0%) |
| $17,500 to $19,999 | 1 (0.3%) | 35 (9.6%) |
| $20,000 to $22,499 | 0 (0.0%) | 0 (0.0%) |
| $22,500 to $24,999 | 27 (8.5%) | 0 (0.0%) |
| $25,000 to $29,999 | 4 (1.3%) | 8 (2.2%) |
| $30,000 to $34,999 | 21 (6.7%) | 46 (12.6%) |
| $35,000 to $39,999 | 31 (9.8%) | 14 (3.8%) |
| $40,000 to $44,999 | 8 (2.5%) | 27 (7.4%) |
| $45,000 to $49,999 | 12 (3.8%) | 0 (0.0%) |
| $50,000 to $54,999 | 21 (6.7%) | 5 (1.4%) |
| $55,000 to $64,999 | 31 (9.8%) | 17 (4.6%) |
| $65,000 to $74,999 | 18 (5.7%) | 17 (4.6%) |
| $75,000 to $99,999 | 36 (11.4%) | 35 (9.6%) |
| $100,000+ | 38 (12.0%) | 12 (3.3%) |
| Total | 316 (100.0%) | 366 (100.0%) |
Earnings by Sex by Educational Attainment in Long Beach
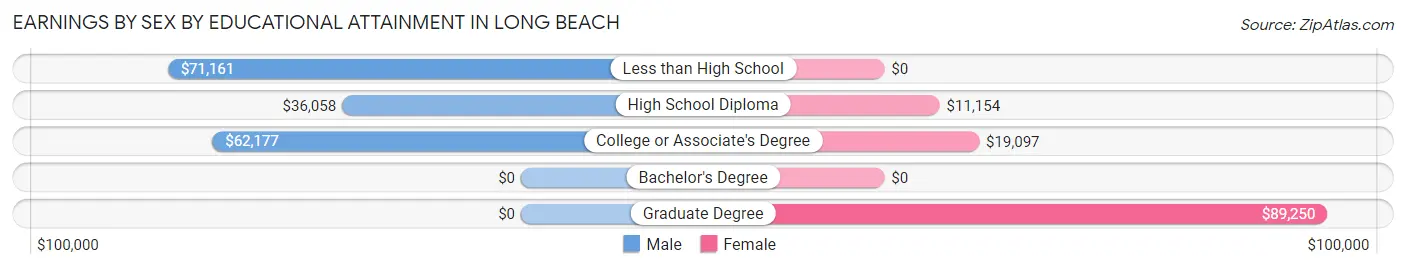
| Educational Attainment | Male Income | Female Income |
| Less than High School | $71,161 | $0 |
| High School Diploma | $36,058 | $11,154 |
| College or Associate's Degree | $62,177 | $19,097 |
| Bachelor's Degree | - | - |
| Graduate Degree | - | - |
| Total | $53,333 | $0 |
Family Income in Long Beach
Family Income Brackets in Long Beach
According to the Long Beach family income data, there are 87 families falling into the $50,000 to $74,999 income range, which is the most common income bracket and makes up 21.0% of all families.
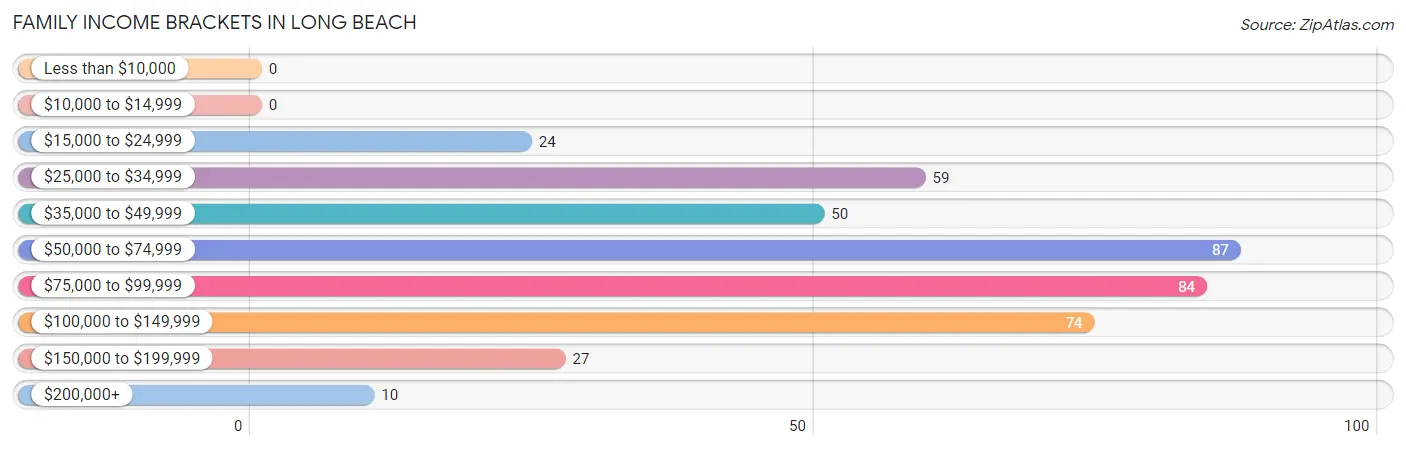
| Income Bracket | # Families | % Families |
| Less than $10,000 | 0 | 0.0% |
| $10,000 to $14,999 | 0 | 0.0% |
| $15,000 to $24,999 | 24 | 5.8% |
| $25,000 to $34,999 | 59 | 14.2% |
| $35,000 to $49,999 | 50 | 12.0% |
| $50,000 to $74,999 | 87 | 21.0% |
| $75,000 to $99,999 | 84 | 20.2% |
| $100,000 to $149,999 | 74 | 17.8% |
| $150,000 to $199,999 | 27 | 6.5% |
| $200,000+ | 10 | 2.4% |
Family Income by Famaliy Size in Long Beach
2-person families (242 | 58.3%) account for the highest median family income in Long Beach with $71,731 per family, while 2-person families (242 | 58.3%) have the highest median income of $35,866 per family member.
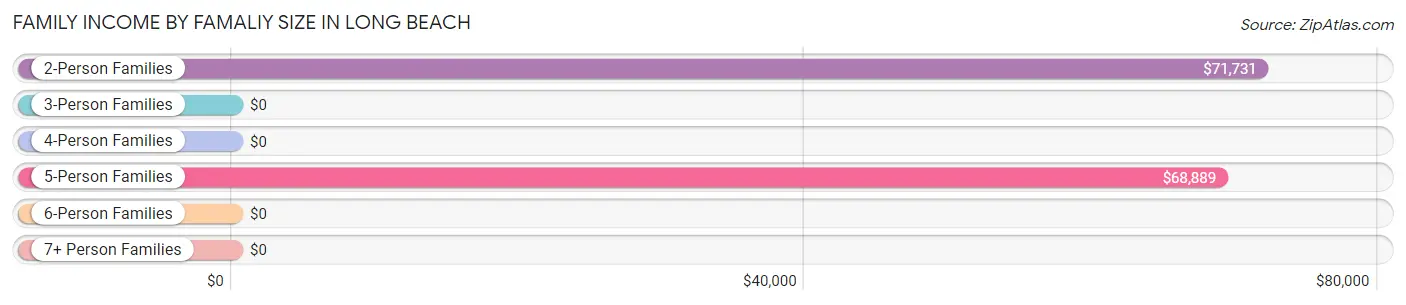
| Income Bracket | # Families | Median Income |
| 2-Person Families | 242 (58.3%) | $71,731 |
| 3-Person Families | 70 (16.9%) | $0 |
| 4-Person Families | 61 (14.7%) | $0 |
| 5-Person Families | 42 (10.1%) | $68,889 |
| 6-Person Families | 0 (0.0%) | $0 |
| 7+ Person Families | 0 (0.0%) | $0 |
| Total | 415 (100.0%) | $70,096 |
Family Income by Number of Earners in Long Beach
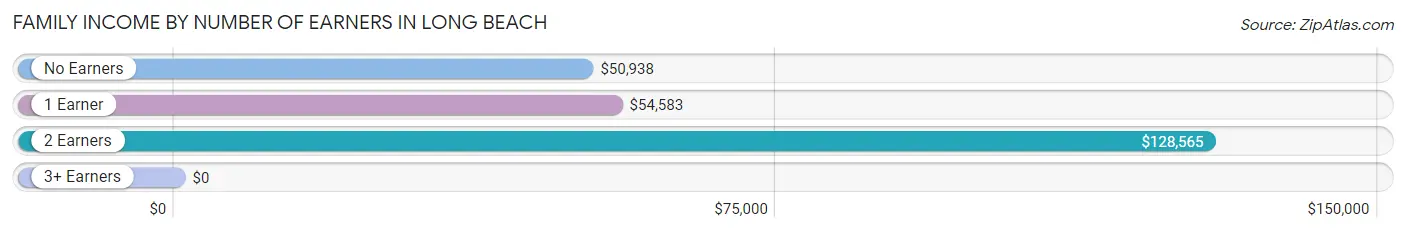
| Number of Earners | # Families | Median Income |
| No Earners | 132 (31.8%) | $50,938 |
| 1 Earner | 156 (37.6%) | $54,583 |
| 2 Earners | 97 (23.4%) | $128,565 |
| 3+ Earners | 30 (7.2%) | $0 |
| Total | 415 (100.0%) | $70,096 |
Household Income in Long Beach
Household Income Brackets in Long Beach
With 168 households falling in the category, the $25,000 to $34,999 income range is the most frequent in Long Beach, accounting for 20.0% of all households. In contrast, only 10 households (1.2%) fall into the $200,000+ income bracket, making it the least populous group.
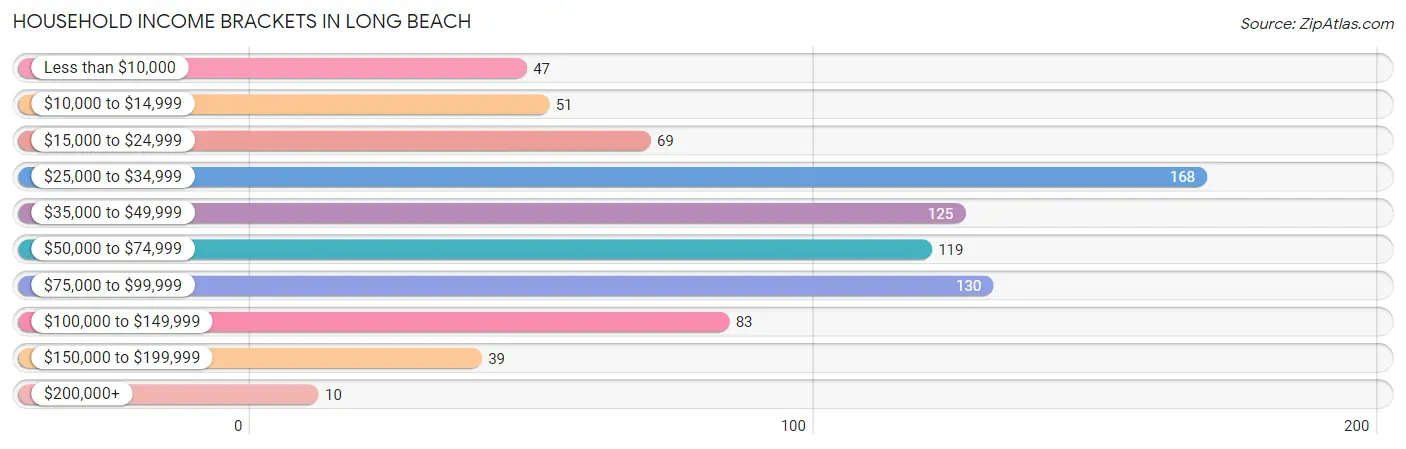
| Income Bracket | # Households | % Households |
| Less than $10,000 | 47 | 5.6% |
| $10,000 to $14,999 | 51 | 6.1% |
| $15,000 to $24,999 | 69 | 8.2% |
| $25,000 to $34,999 | 168 | 20.0% |
| $35,000 to $49,999 | 125 | 14.9% |
| $50,000 to $74,999 | 119 | 14.1% |
| $75,000 to $99,999 | 130 | 15.5% |
| $100,000 to $149,999 | 83 | 9.9% |
| $150,000 to $199,999 | 39 | 4.6% |
| $200,000+ | 10 | 1.2% |
Household Income by Householder Age in Long Beach
The median household income in Long Beach is $47,188, with the highest median household income of $86,176 found in the 25 to 44 years age bracket for the primary householder. A total of 160 households (19.0%) fall into this category. Meanwhile, the 15 to 24 years age bracket for the primary householder has the lowest median household income of $35,089, with 55 households (6.5%) in this group.
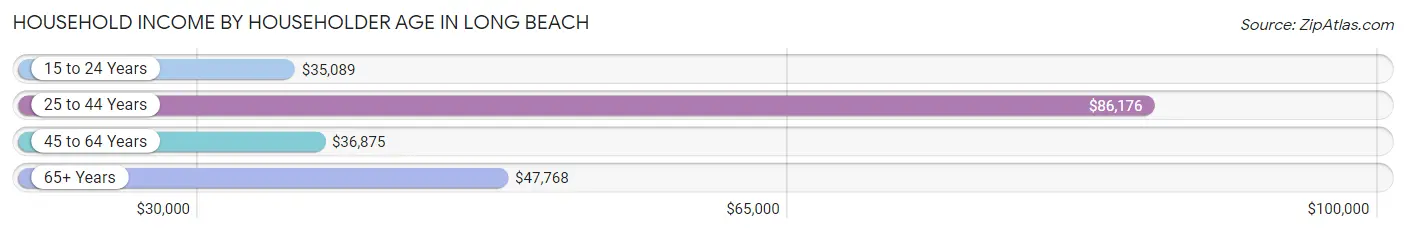
| Income Bracket | # Households | Median Income |
| 15 to 24 Years | 55 (6.5%) | $35,089 |
| 25 to 44 Years | 160 (19.0%) | $86,176 |
| 45 to 64 Years | 244 (29.0%) | $36,875 |
| 65+ Years | 382 (45.4%) | $47,768 |
| Total | 841 (100.0%) | $47,188 |
Poverty in Long Beach
Income Below Poverty by Sex and Age in Long Beach
With 24.2% poverty level for males and 21.1% for females among the residents of Long Beach, 15 year old males and 6 to 11 year old females are the most vulnerable to poverty, with 13 males (100.0%) and 21 females (75.0%) in their respective age groups living below the poverty level.
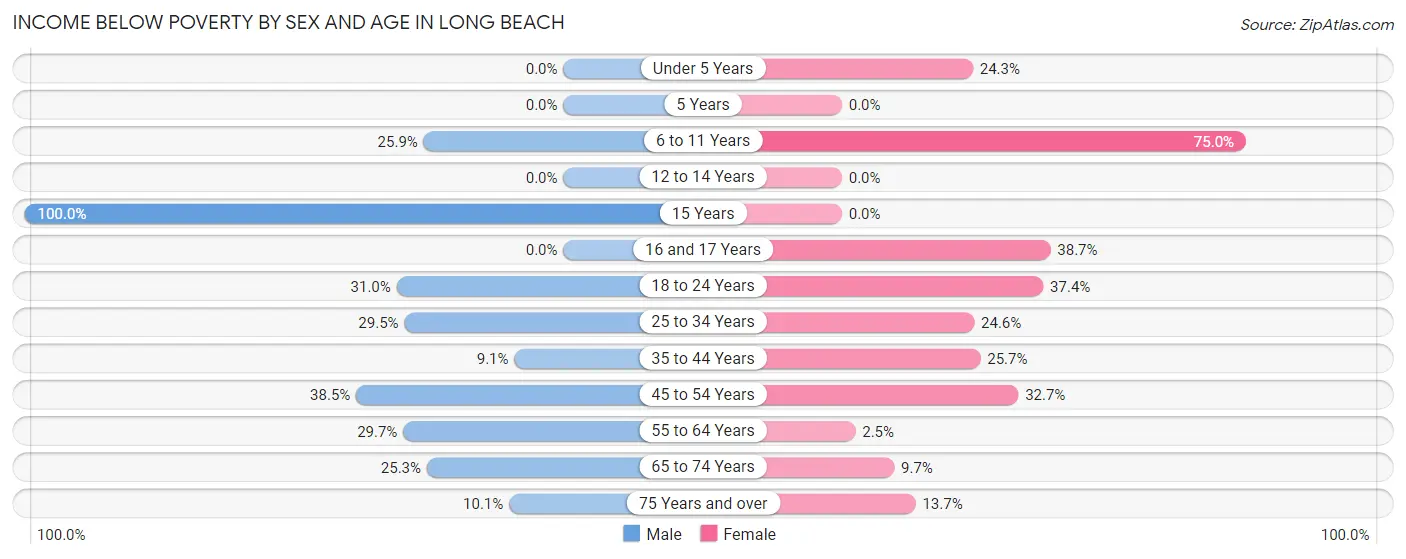
| Age Bracket | Male | Female |
| Under 5 Years | 0 (0.0%) | 9 (24.3%) |
| 5 Years | 0 (0.0%) | 0 (0.0%) |
| 6 to 11 Years | 14 (25.9%) | 21 (75.0%) |
| 12 to 14 Years | 0 (0.0%) | 0 (0.0%) |
| 15 Years | 13 (100.0%) | 0 (0.0%) |
| 16 and 17 Years | 0 (0.0%) | 24 (38.7%) |
| 18 to 24 Years | 13 (30.9%) | 40 (37.4%) |
| 25 to 34 Years | 41 (29.5%) | 28 (24.6%) |
| 35 to 44 Years | 7 (9.1%) | 18 (25.7%) |
| 45 to 54 Years | 30 (38.5%) | 37 (32.7%) |
| 55 to 64 Years | 44 (29.7%) | 3 (2.5%) |
| 65 to 74 Years | 19 (25.3%) | 20 (9.7%) |
| 75 Years and over | 15 (10.1%) | 16 (13.7%) |
| Total | 196 (24.2%) | 216 (21.1%) |
Income Above Poverty by Sex and Age in Long Beach
According to the poverty statistics in Long Beach, males aged under 5 years and females aged 5 years are the age groups that are most secure financially, with 100.0% of males and 100.0% of females in these age groups living above the poverty line.
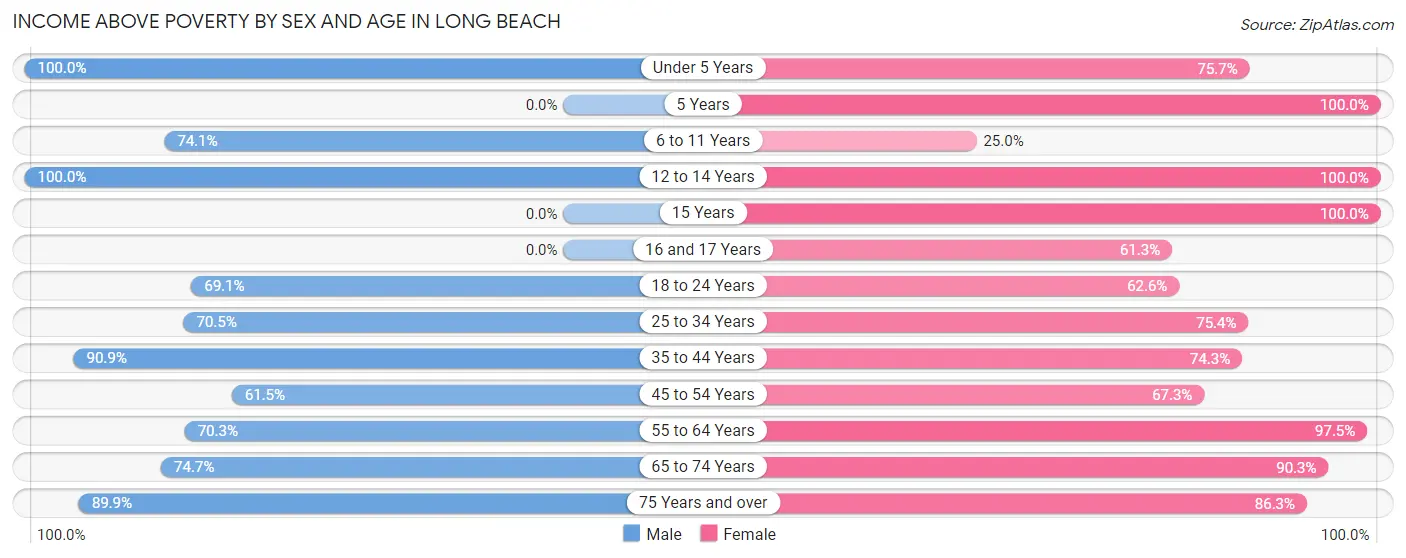
| Age Bracket | Male | Female |
| Under 5 Years | 17 (100.0%) | 28 (75.7%) |
| 5 Years | 0 (0.0%) | 28 (100.0%) |
| 6 to 11 Years | 40 (74.1%) | 7 (25.0%) |
| 12 to 14 Years | 17 (100.0%) | 19 (100.0%) |
| 15 Years | 0 (0.0%) | 1 (100.0%) |
| 16 and 17 Years | 0 (0.0%) | 38 (61.3%) |
| 18 to 24 Years | 29 (69.1%) | 67 (62.6%) |
| 25 to 34 Years | 98 (70.5%) | 86 (75.4%) |
| 35 to 44 Years | 70 (90.9%) | 52 (74.3%) |
| 45 to 54 Years | 48 (61.5%) | 76 (67.3%) |
| 55 to 64 Years | 104 (70.3%) | 117 (97.5%) |
| 65 to 74 Years | 56 (74.7%) | 186 (90.3%) |
| 75 Years and over | 134 (89.9%) | 101 (86.3%) |
| Total | 613 (75.8%) | 806 (78.9%) |
Income Below Poverty Among Married-Couple Families in Long Beach
The poverty statistics for married-couple families in Long Beach show that 4.0% or 12 of the total 300 families live below the poverty line. Families with 1 or 2 children have the highest poverty rate of 17.1%, comprising of 12 families. On the other hand, families with no children have the lowest poverty rate of 0.0%, which includes 0 families.
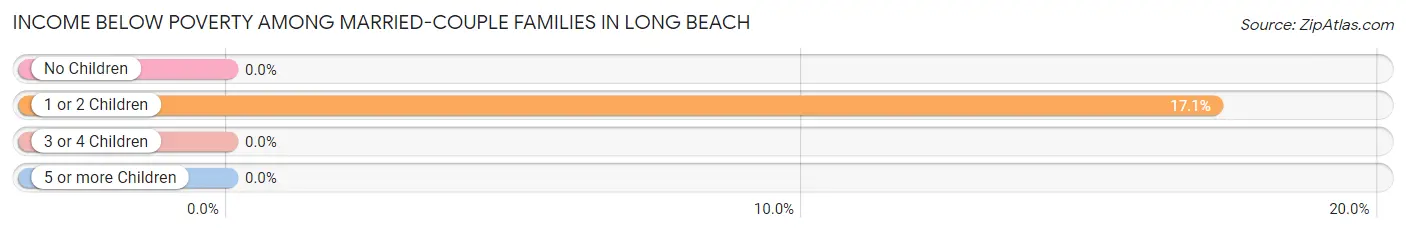
| Children | Above Poverty | Below Poverty |
| No Children | 213 (100.0%) | 0 (0.0%) |
| 1 or 2 Children | 58 (82.9%) | 12 (17.1%) |
| 3 or 4 Children | 17 (100.0%) | 0 (0.0%) |
| 5 or more Children | 0 (0.0%) | 0 (0.0%) |
| Total | 288 (96.0%) | 12 (4.0%) |
Income Below Poverty Among Single-Parent Households in Long Beach
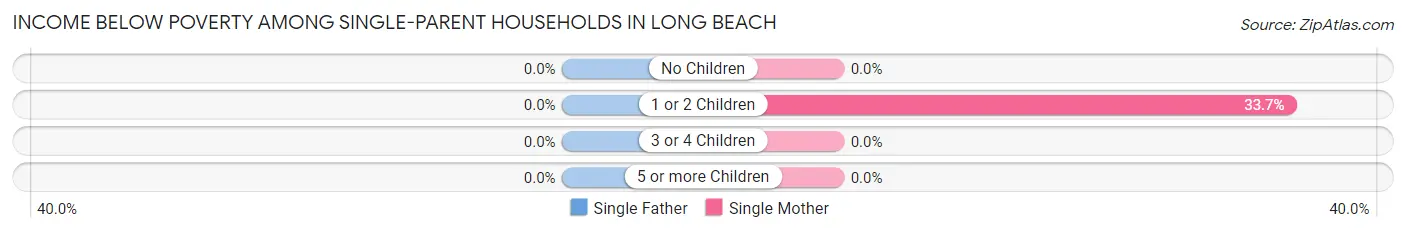
| Children | Single Father | Single Mother |
| No Children | 0 (0.0%) | 0 (0.0%) |
| 1 or 2 Children | 0 (0.0%) | 29 (33.7%) |
| 3 or 4 Children | 0 (0.0%) | 0 (0.0%) |
| 5 or more Children | 0 (0.0%) | 0 (0.0%) |
| Total | 0 (0.0%) | 29 (27.4%) |
Income Below Poverty Among Married-Couple vs Single-Parent Households in Long Beach
The poverty data for Long Beach shows that 12 of the married-couple family households (4.0%) and 29 of the single-parent households (25.2%) are living below the poverty level. Within the married-couple family households, those with 1 or 2 children have the highest poverty rate, with 12 households (17.1%) falling below the poverty line. Among the single-parent households, those with 1 or 2 children have the highest poverty rate, with 29 household (33.7%) living below poverty.
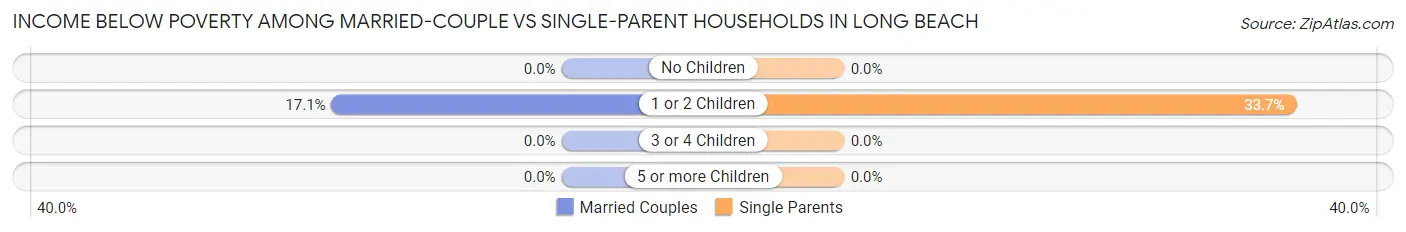
| Children | Married-Couple Families | Single-Parent Households |
| No Children | 0 (0.0%) | 0 (0.0%) |
| 1 or 2 Children | 12 (17.1%) | 29 (33.7%) |
| 3 or 4 Children | 0 (0.0%) | 0 (0.0%) |
| 5 or more Children | 0 (0.0%) | 0 (0.0%) |
| Total | 12 (4.0%) | 29 (25.2%) |
Race in Long Beach
The most populous races in Long Beach are White / Caucasian (1,701 | 92.9%), Hispanic or Latino (123 | 6.7%), and Two or more Races (82 | 4.5%).
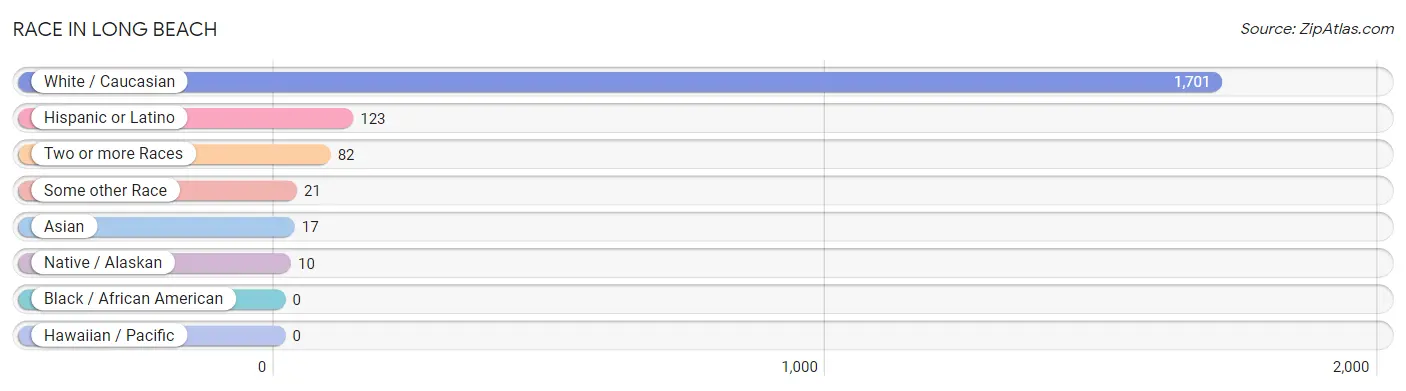
| Race | # Population | % Population |
| Asian | 17 | 0.9% |
| Black / African American | 0 | 0.0% |
| Hawaiian / Pacific | 0 | 0.0% |
| Hispanic or Latino | 123 | 6.7% |
| Native / Alaskan | 10 | 0.5% |
| White / Caucasian | 1,701 | 92.9% |
| Two or more Races | 82 | 4.5% |
| Some other Race | 21 | 1.1% |
| Total | 1,831 | 100.0% |
Ancestry in Long Beach
The most populous ancestries reported in Long Beach are German (337 | 18.4%), English (225 | 12.3%), Irish (183 | 10.0%), Italian (138 | 7.5%), and Welsh (96 | 5.2%), together accounting for 53.5% of all Long Beach residents.
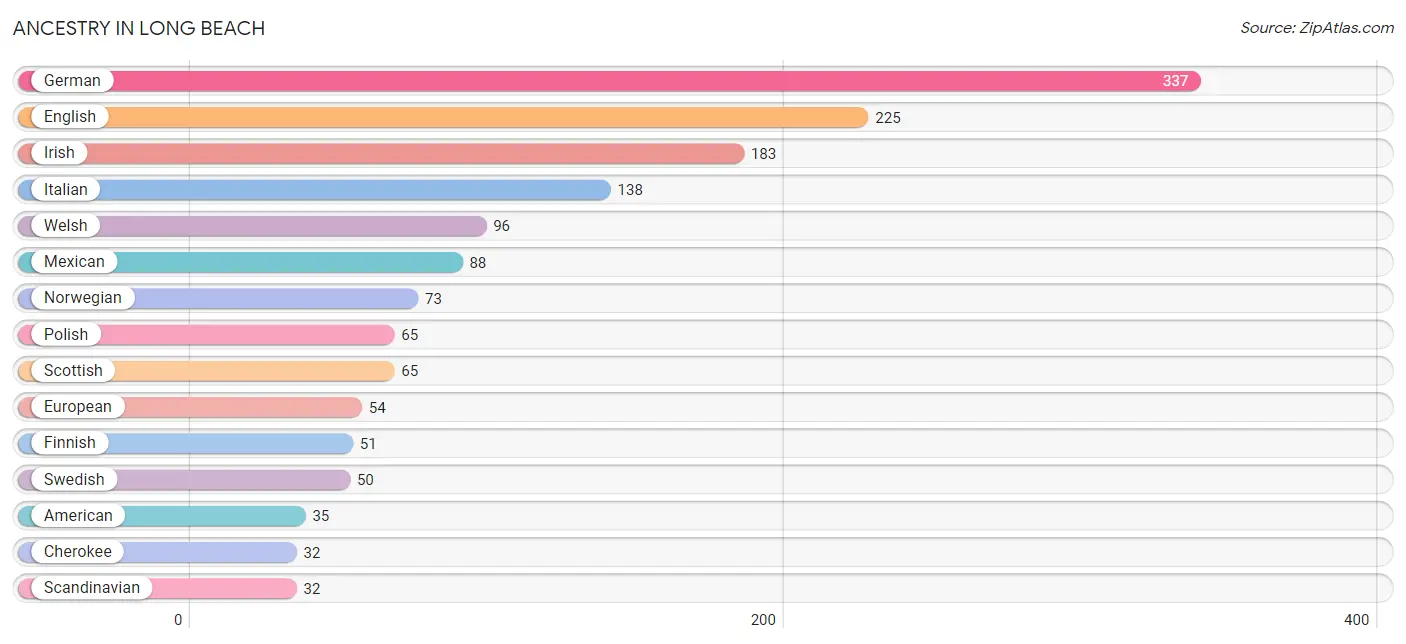
| Ancestry | # Population | % Population |
| Aleut | 3 | 0.2% |
| American | 35 | 1.9% |
| Belgian | 22 | 1.2% |
| Cherokee | 32 | 1.8% |
| Chilean | 22 | 1.2% |
| Croatian | 9 | 0.5% |
| Cuban | 13 | 0.7% |
| Czech | 4 | 0.2% |
| Czechoslovakian | 17 | 0.9% |
| Danish | 6 | 0.3% |
| Dutch | 25 | 1.4% |
| English | 225 | 12.3% |
| European | 54 | 2.9% |
| Finnish | 51 | 2.8% |
| French | 30 | 1.6% |
| German | 337 | 18.4% |
| Hungarian | 5 | 0.3% |
| Inupiat | 5 | 0.3% |
| Irish | 183 | 10.0% |
| Italian | 138 | 7.5% |
| Mexican | 88 | 4.8% |
| Northern European | 12 | 0.7% |
| Norwegian | 73 | 4.0% |
| Polish | 65 | 3.5% |
| Portuguese | 1 | 0.1% |
| Romanian | 8 | 0.4% |
| Scandinavian | 32 | 1.8% |
| Scotch-Irish | 8 | 0.4% |
| Scottish | 65 | 3.5% |
| South American | 22 | 1.2% |
| Sri Lankan | 17 | 0.9% |
| Swedish | 50 | 2.7% |
| Welsh | 96 | 5.2% | View All 33 Rows |
Immigrants in Long Beach
The most numerous immigrant groups reported in Long Beach came from Europe (71 | 3.9%), Western Europe (71 | 3.9%), Germany (49 | 2.7%), Central America (26 | 1.4%), and Latin America (26 | 1.4%), together accounting for 13.3% of all Long Beach residents.
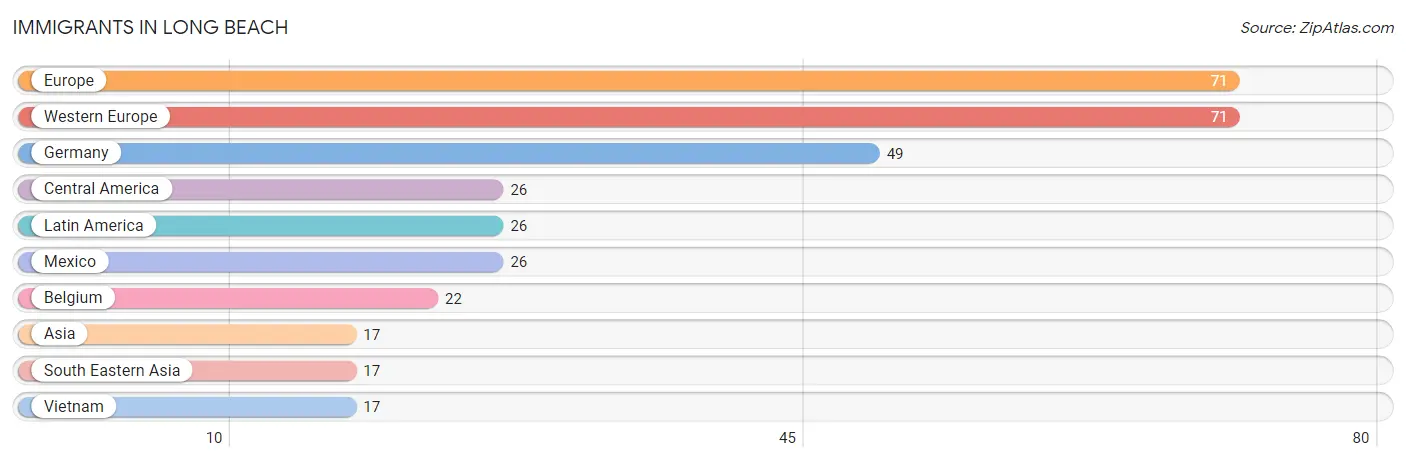
| Immigration Origin | # Population | % Population |
| Asia | 17 | 0.9% |
| Belgium | 22 | 1.2% |
| Central America | 26 | 1.4% |
| Europe | 71 | 3.9% |
| Germany | 49 | 2.7% |
| Latin America | 26 | 1.4% |
| Mexico | 26 | 1.4% |
| South Eastern Asia | 17 | 0.9% |
| Vietnam | 17 | 0.9% |
| Western Europe | 71 | 3.9% | View All 10 Rows |
Sex and Age in Long Beach
Sex and Age in Long Beach
The most populous age groups in Long Beach are 60 to 64 Years (96 | 11.9%) for men and 65 to 69 Years (126 | 12.3%) for women.
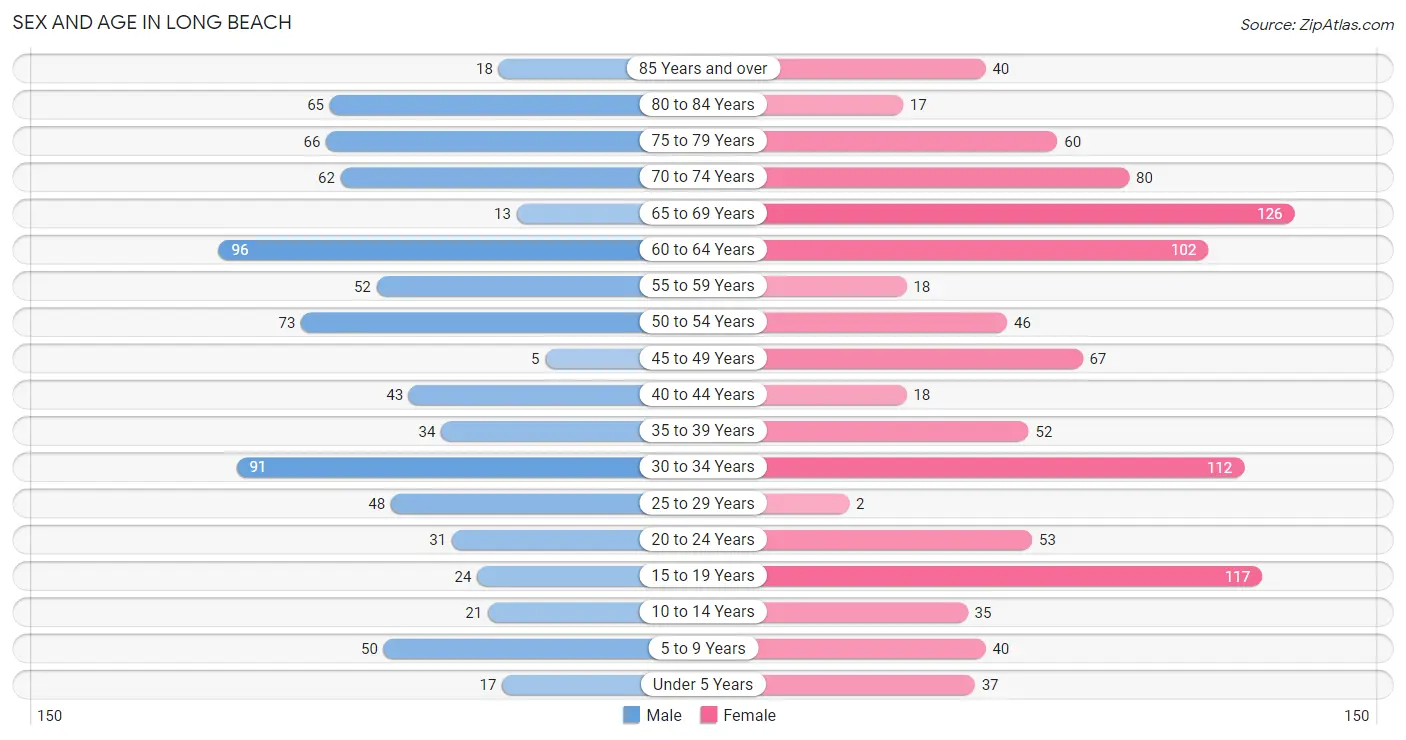
| Age Bracket | Male | Female |
| Under 5 Years | 17 (2.1%) | 37 (3.6%) |
| 5 to 9 Years | 50 (6.2%) | 40 (3.9%) |
| 10 to 14 Years | 21 (2.6%) | 35 (3.4%) |
| 15 to 19 Years | 24 (3.0%) | 117 (11.5%) |
| 20 to 24 Years | 31 (3.8%) | 53 (5.2%) |
| 25 to 29 Years | 48 (5.9%) | 2 (0.2%) |
| 30 to 34 Years | 91 (11.3%) | 112 (11.0%) |
| 35 to 39 Years | 34 (4.2%) | 52 (5.1%) |
| 40 to 44 Years | 43 (5.3%) | 18 (1.8%) |
| 45 to 49 Years | 5 (0.6%) | 67 (6.6%) |
| 50 to 54 Years | 73 (9.0%) | 46 (4.5%) |
| 55 to 59 Years | 52 (6.4%) | 18 (1.8%) |
| 60 to 64 Years | 96 (11.9%) | 102 (10.0%) |
| 65 to 69 Years | 13 (1.6%) | 126 (12.3%) |
| 70 to 74 Years | 62 (7.7%) | 80 (7.8%) |
| 75 to 79 Years | 66 (8.2%) | 60 (5.9%) |
| 80 to 84 Years | 65 (8.0%) | 17 (1.7%) |
| 85 Years and over | 18 (2.2%) | 40 (3.9%) |
| Total | 809 (100.0%) | 1,022 (100.0%) |
Families and Households in Long Beach
Median Family Size in Long Beach
The median family size in Long Beach is 2.94 persons per family, with single female/mother families (106 | 25.5%) accounting for the largest median family size of 3.38 persons per family. On the other hand, single male/father families (9 | 2.2%) represent the smallest median family size with 1.89 persons per family.
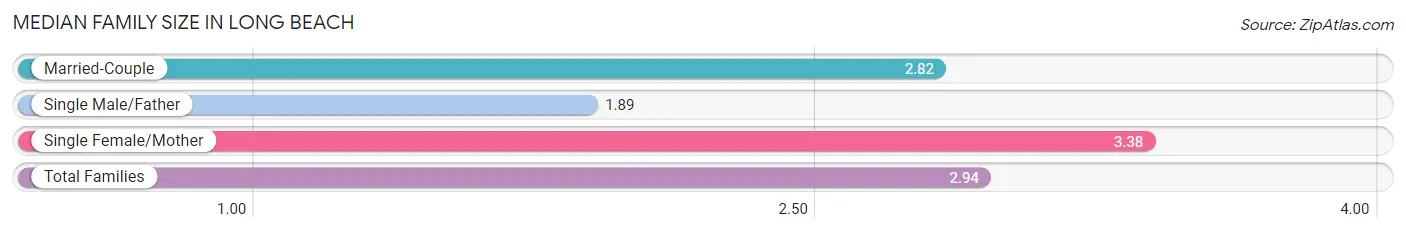
| Family Type | # Families | Family Size |
| Married-Couple | 300 (72.3%) | 2.82 |
| Single Male/Father | 9 (2.2%) | 1.89 |
| Single Female/Mother | 106 (25.5%) | 3.38 |
| Total Families | 415 (100.0%) | 2.94 |
Median Household Size in Long Beach
The median household size in Long Beach is 2.17 persons per household, with single female/mother households (106 | 12.6%) accounting for the largest median household size of 3.68 persons per household. non-family households (426 | 50.6%) represent the smallest median household size with 1.35 persons per household.
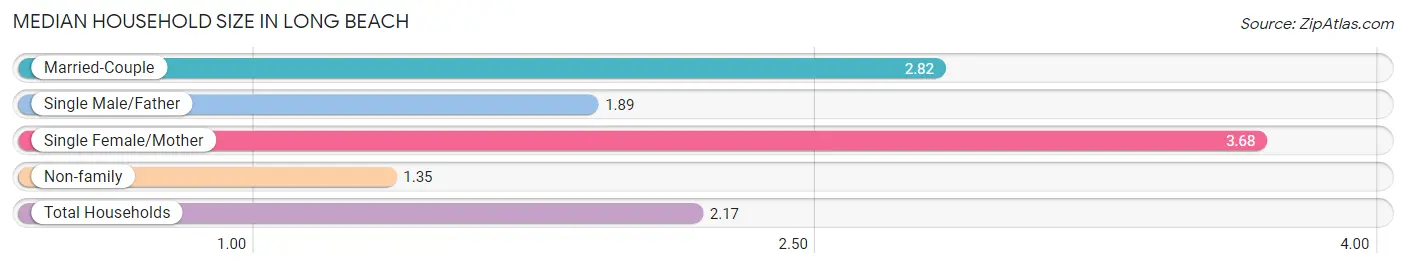
| Household Type | # Households | Household Size |
| Married-Couple | 300 (35.7%) | 2.82 |
| Single Male/Father | 9 (1.1%) | 1.89 |
| Single Female/Mother | 106 (12.6%) | 3.68 |
| Non-family | 426 (50.6%) | 1.35 |
| Total Households | 841 (100.0%) | 2.17 |
Household Size by Marriage Status in Long Beach
Out of a total of 841 households in Long Beach, 415 (49.3%) are family households, while 426 (50.6%) are nonfamily households. The most numerous type of family households are 2-person households, comprising 236, and the most common type of nonfamily households are 1-person households, comprising 331.
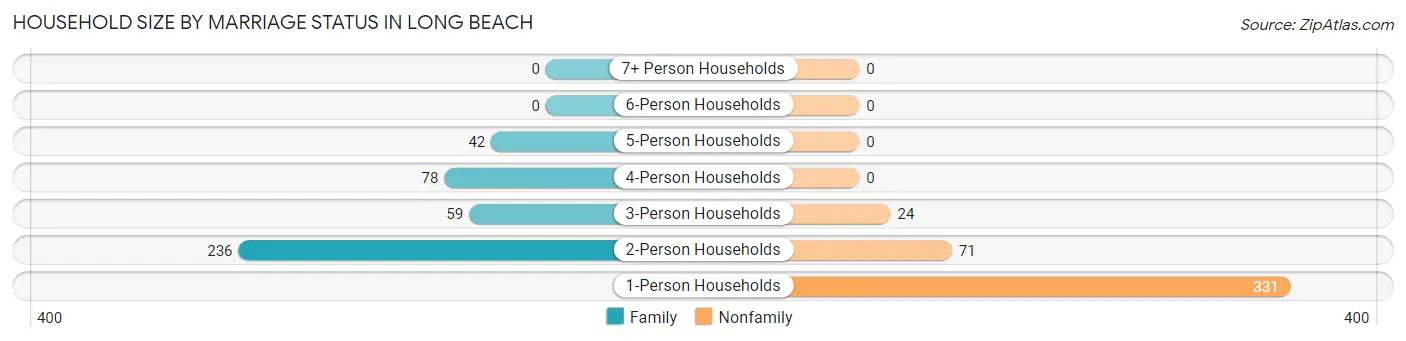
| Household Size | Family Households | Nonfamily Households |
| 1-Person Households | - | 331 (39.4%) |
| 2-Person Households | 236 (28.1%) | 71 (8.4%) |
| 3-Person Households | 59 (7.0%) | 24 (2.9%) |
| 4-Person Households | 78 (9.3%) | 0 (0.0%) |
| 5-Person Households | 42 (5.0%) | 0 (0.0%) |
| 6-Person Households | 0 (0.0%) | 0 (0.0%) |
| 7+ Person Households | 0 (0.0%) | 0 (0.0%) |
| Total | 415 (49.3%) | 426 (50.6%) |
Female Fertility in Long Beach
Fertility by Age in Long Beach
Average fertility rate in Long Beach is 100.0 births per 1,000 women. Women in the age bracket of 20 to 34 years have the highest fertility rate with 150.0 births per 1,000 women. Women in the age bracket of 20 to 34 years acount for 59.5% of all women with births.
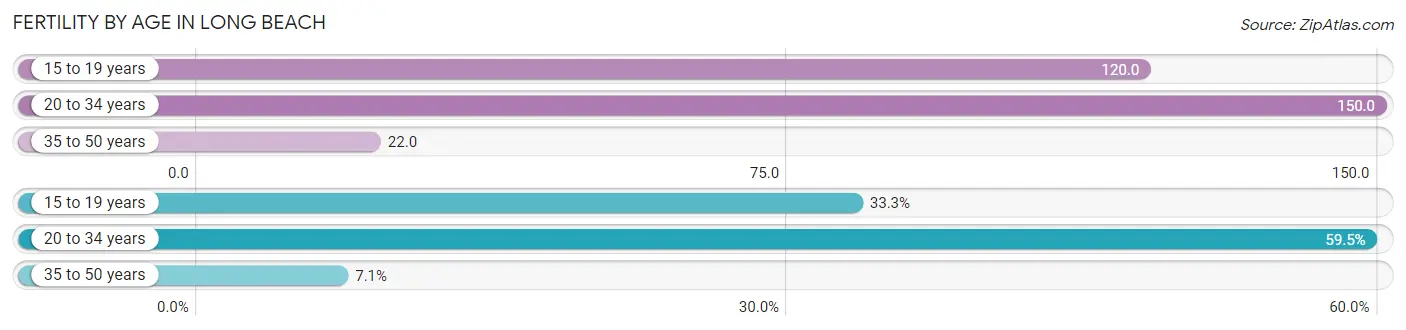
| Age Bracket | Women with Births | Births / 1,000 Women |
| 15 to 19 years | 14 (33.3%) | 120.0 |
| 20 to 34 years | 25 (59.5%) | 150.0 |
| 35 to 50 years | 3 (7.1%) | 22.0 |
| Total | 42 (100.0%) | 100.0 |
Fertility by Age by Marriage Status in Long Beach
7.1% of women with births (42) in Long Beach are married. The highest percentage of unmarried women with births falls into 15 to 19 years age bracket with 100.0% of them unmarried at the time of birth, while the lowest percentage of unmarried women with births belong to 35 to 50 years age bracket with 0.0% of them unmarried.
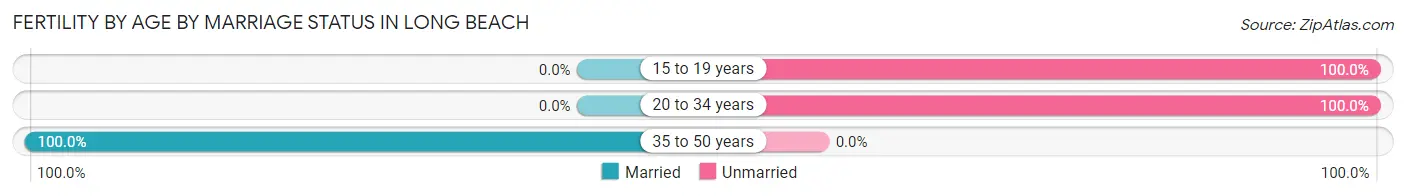
| Age Bracket | Married | Unmarried |
| 15 to 19 years | 0 (0.0%) | 14 (100.0%) |
| 20 to 34 years | 0 (0.0%) | 25 (100.0%) |
| 35 to 50 years | 3 (100.0%) | 0 (0.0%) |
| Total | 3 (7.1%) | 39 (92.9%) |
Fertility by Education in Long Beach
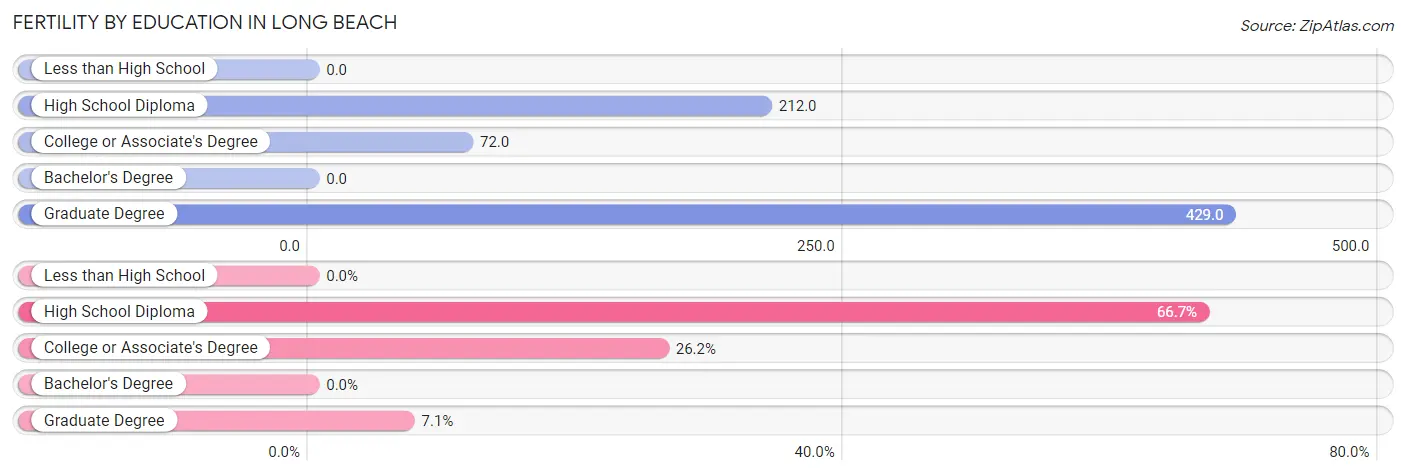
| Educational Attainment | Women with Births | Births / 1,000 Women |
| Less than High School | 0 (0.0%) | 0.0 |
| High School Diploma | 28 (66.7%) | 212.0 |
| College or Associate's Degree | 11 (26.2%) | 72.0 |
| Bachelor's Degree | 0 (0.0%) | 0.0 |
| Graduate Degree | 3 (7.1%) | 429.0 |
| Total | 42 (100.0%) | 100.0 |
Fertility by Education by Marriage Status in Long Beach
92.9% of women with births in Long Beach are unmarried. Women with the educational attainment of graduate degree are most likely to be married with 100.0% of them married at childbirth, while women with the educational attainment of high school diploma are least likely to be married with 100.0% of them unmarried at childbirth.
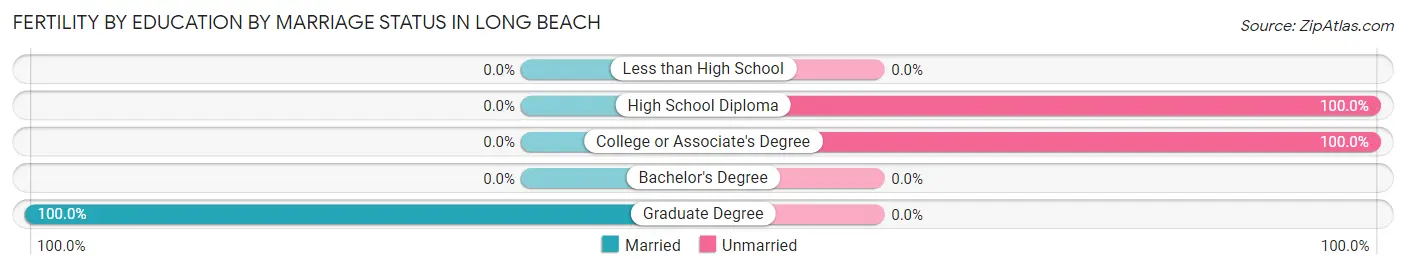
| Educational Attainment | Married | Unmarried |
| Less than High School | 0 (0.0%) | 0 (0.0%) |
| High School Diploma | 0 (0.0%) | 28 (100.0%) |
| College or Associate's Degree | 0 (0.0%) | 11 (100.0%) |
| Bachelor's Degree | 0 (0.0%) | 0 (0.0%) |
| Graduate Degree | 3 (100.0%) | 0 (0.0%) |
| Total | 3 (7.1%) | 39 (92.9%) |
Employment Characteristics in Long Beach
Employment by Class of Employer in Long Beach
Among the 563 employed individuals in Long Beach, private company employees (367 | 65.2%), local government employees (104 | 18.5%), and state government employees (37 | 6.6%) make up the most common classes of employment.
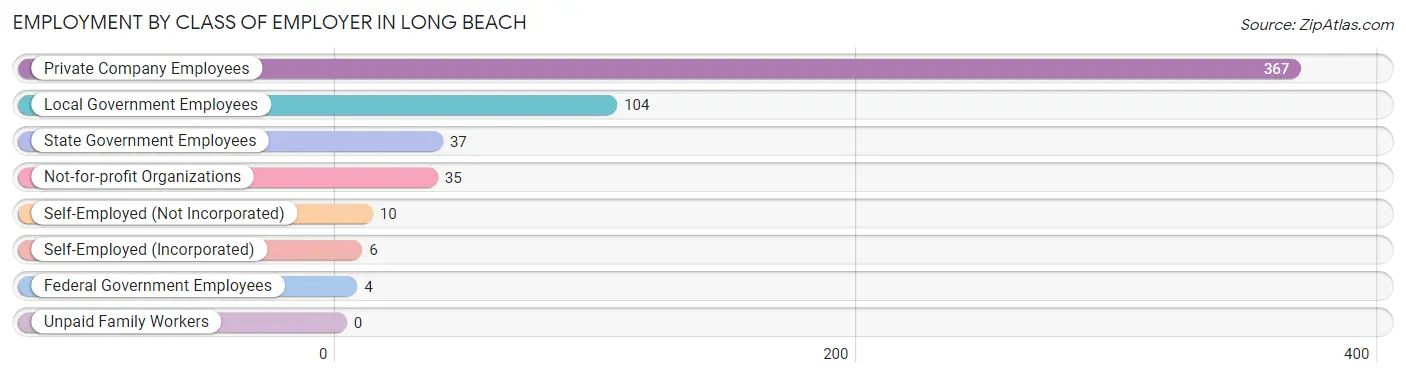
| Employer Class | # Employees | % Employees |
| Private Company Employees | 367 | 65.2% |
| Self-Employed (Incorporated) | 6 | 1.1% |
| Self-Employed (Not Incorporated) | 10 | 1.8% |
| Not-for-profit Organizations | 35 | 6.2% |
| Local Government Employees | 104 | 18.5% |
| State Government Employees | 37 | 6.6% |
| Federal Government Employees | 4 | 0.7% |
| Unpaid Family Workers | 0 | 0.0% |
| Total | 563 | 100.0% |
Employment Status by Age in Long Beach
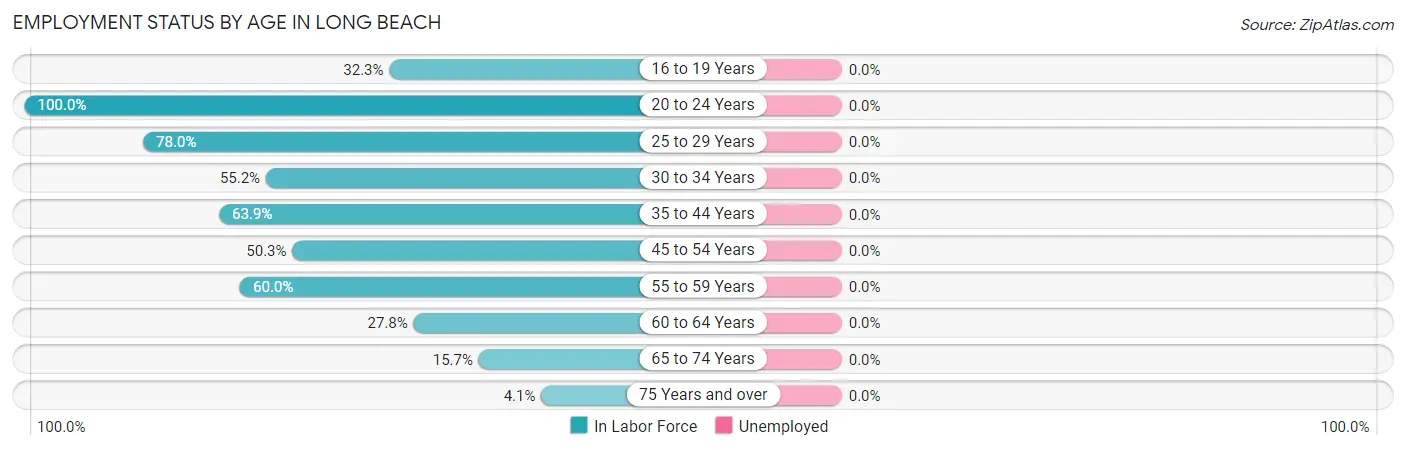
| Age Bracket | In Labor Force | Unemployed |
| 16 to 19 Years | 41 (32.3%) | 0 (0.0%) |
| 20 to 24 Years | 84 (100.0%) | 0 (0.0%) |
| 25 to 29 Years | 39 (78.0%) | 0 (0.0%) |
| 30 to 34 Years | 112 (55.2%) | 0 (0.0%) |
| 35 to 44 Years | 94 (63.9%) | 0 (0.0%) |
| 45 to 54 Years | 96 (50.3%) | 0 (0.0%) |
| 55 to 59 Years | 42 (60.0%) | 0 (0.0%) |
| 60 to 64 Years | 55 (27.8%) | 0 (0.0%) |
| 65 to 74 Years | 44 (15.7%) | 0 (0.0%) |
| 75 Years and over | 11 (4.1%) | 0 (0.0%) |
| Total | 618 (38.2%) | 0 (0.0%) |
Employment Status by Educational Attainment in Long Beach
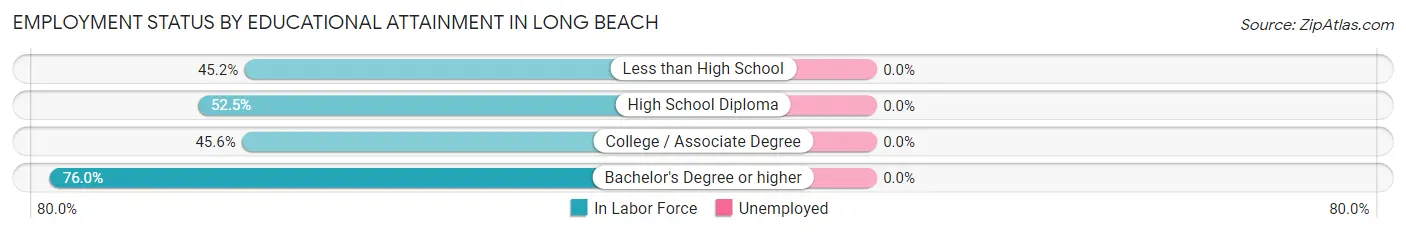
| Educational Attainment | In Labor Force | Unemployed |
| Less than High School | 42 (45.2%) | 0 (0.0%) |
| High School Diploma | 124 (52.5%) | 0 (0.0%) |
| College / Associate Degree | 196 (45.6%) | 0 (0.0%) |
| Bachelor's Degree or higher | 76 (76.0%) | 0 (0.0%) |
| Total | 438 (51.0%) | 0 (0.0%) |
Employment Occupations by Sex in Long Beach
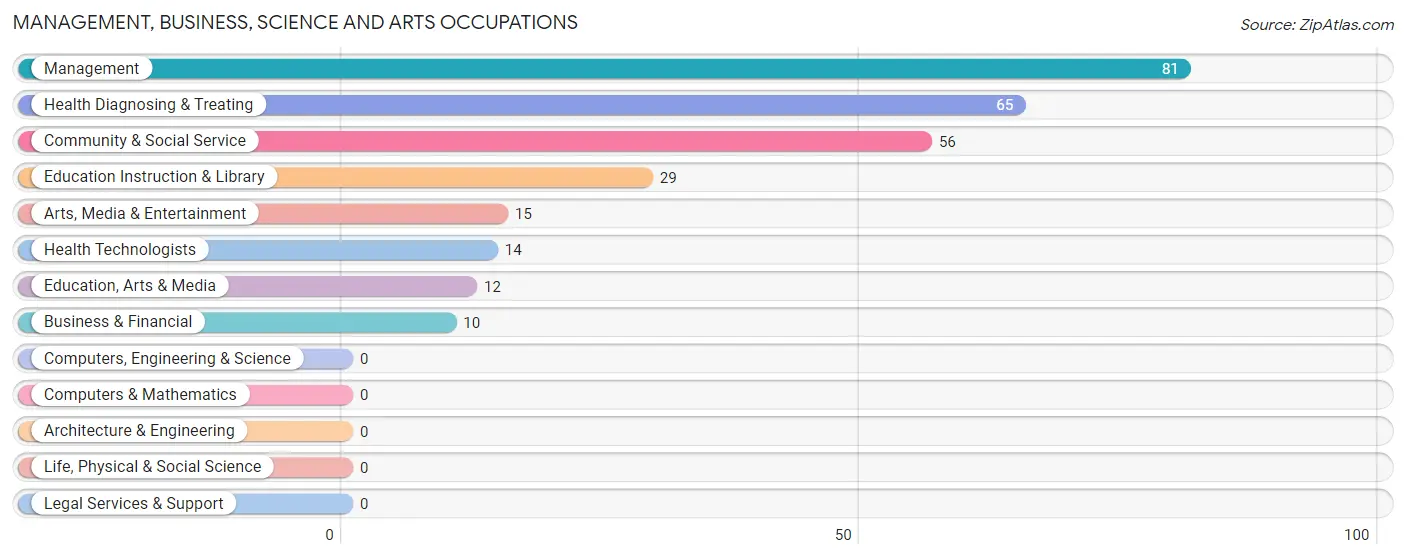
Management, Business, Science and Arts Occupations
The most common Management, Business, Science and Arts occupations in Long Beach are Management (81 | 13.2%), Health Diagnosing & Treating (65 | 10.6%), Community & Social Service (56 | 9.1%), Education Instruction & Library (29 | 4.7%), and Arts, Media & Entertainment (15 | 2.4%).
Management, Business, Science and Arts Occupations by Sex
Within the Management, Business, Science and Arts occupations in Long Beach, the most male-oriented occupations are Business & Financial (100.0%), Education, Arts & Media (100.0%), and Arts, Media & Entertainment (100.0%), while the most female-oriented occupations are Education Instruction & Library (100.0%), Health Technologists (100.0%), and Health Diagnosing & Treating (92.3%).
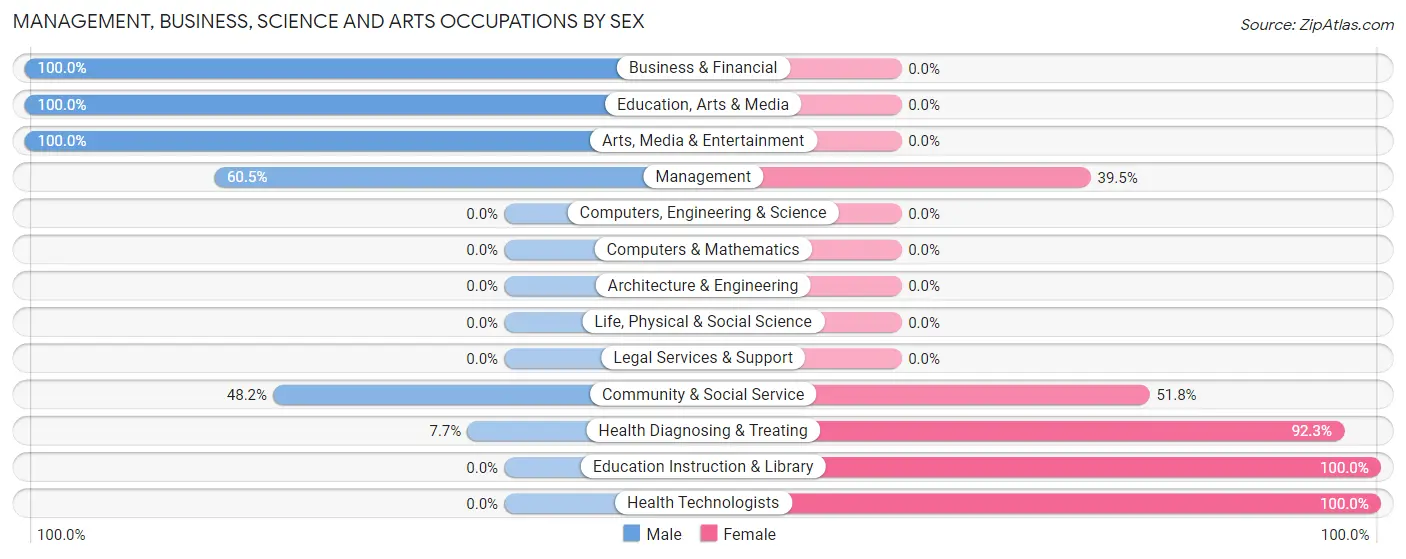
| Occupation | Male | Female |
| Management | 49 (60.5%) | 32 (39.5%) |
| Business & Financial | 10 (100.0%) | 0 (0.0%) |
| Computers, Engineering & Science | 0 (0.0%) | 0 (0.0%) |
| Computers & Mathematics | 0 (0.0%) | 0 (0.0%) |
| Architecture & Engineering | 0 (0.0%) | 0 (0.0%) |
| Life, Physical & Social Science | 0 (0.0%) | 0 (0.0%) |
| Community & Social Service | 27 (48.2%) | 29 (51.8%) |
| Education, Arts & Media | 12 (100.0%) | 0 (0.0%) |
| Legal Services & Support | 0 (0.0%) | 0 (0.0%) |
| Education Instruction & Library | 0 (0.0%) | 29 (100.0%) |
| Arts, Media & Entertainment | 15 (100.0%) | 0 (0.0%) |
| Health Diagnosing & Treating | 5 (7.7%) | 60 (92.3%) |
| Health Technologists | 0 (0.0%) | 14 (100.0%) |
| Total (Category) | 91 (42.9%) | 121 (57.1%) |
| Total (Overall) | 310 (50.5%) | 304 (49.5%) |
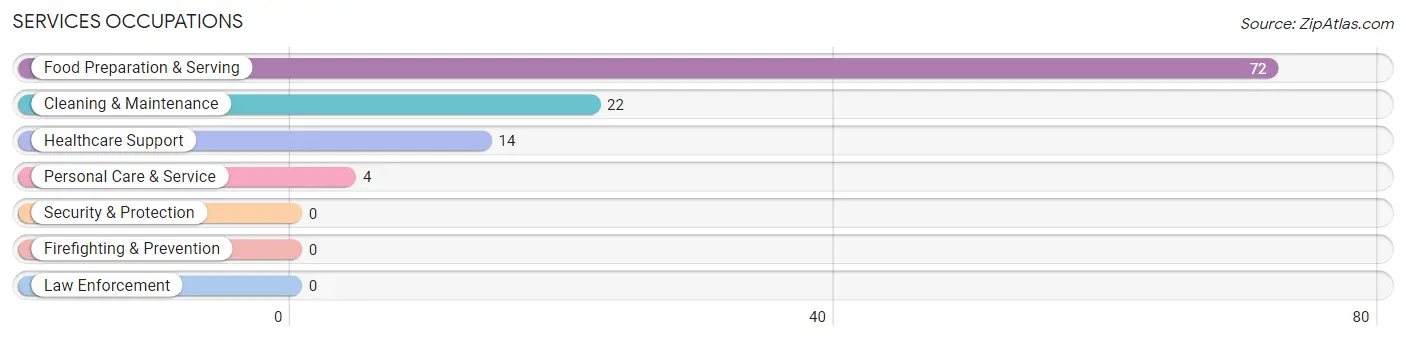
Services Occupations
The most common Services occupations in Long Beach are Food Preparation & Serving (72 | 11.7%), Cleaning & Maintenance (22 | 3.6%), Healthcare Support (14 | 2.3%), and Personal Care & Service (4 | 0.6%).
Services Occupations by Sex
Within the Services occupations in Long Beach, the most male-oriented occupations are Cleaning & Maintenance (100.0%), Personal Care & Service (100.0%), and Food Preparation & Serving (33.3%), while the most female-oriented occupations are Healthcare Support (100.0%), and Food Preparation & Serving (66.7%).
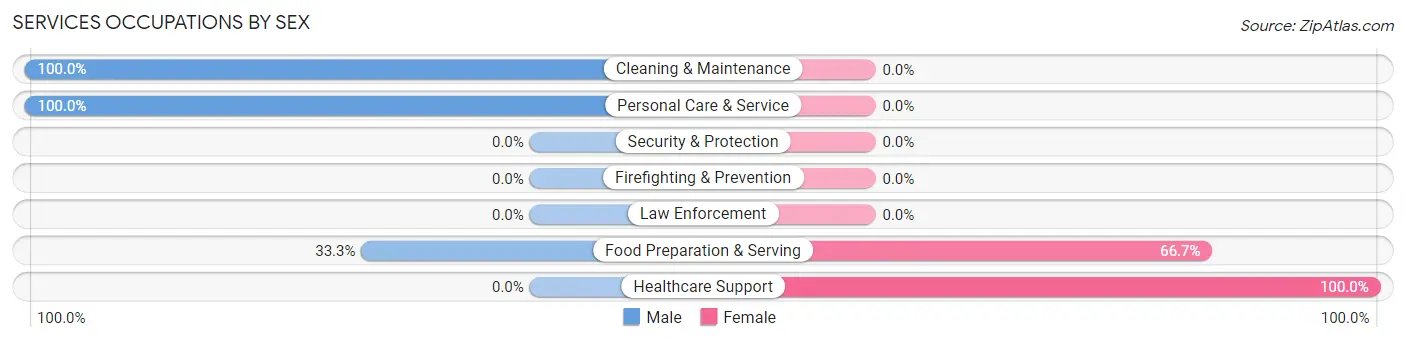
| Occupation | Male | Female |
| Healthcare Support | 0 (0.0%) | 14 (100.0%) |
| Security & Protection | 0 (0.0%) | 0 (0.0%) |
| Firefighting & Prevention | 0 (0.0%) | 0 (0.0%) |
| Law Enforcement | 0 (0.0%) | 0 (0.0%) |
| Food Preparation & Serving | 24 (33.3%) | 48 (66.7%) |
| Cleaning & Maintenance | 22 (100.0%) | 0 (0.0%) |
| Personal Care & Service | 4 (100.0%) | 0 (0.0%) |
| Total (Category) | 50 (44.6%) | 62 (55.4%) |
| Total (Overall) | 310 (50.5%) | 304 (49.5%) |
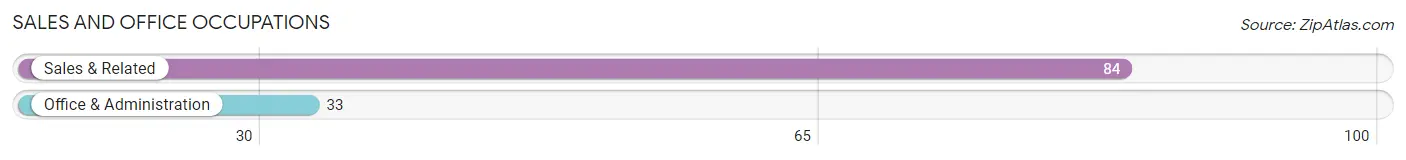
Sales and Office Occupations
The most common Sales and Office occupations in Long Beach are Sales & Related (84 | 13.7%), and Office & Administration (33 | 5.4%).
Sales and Office Occupations by Sex
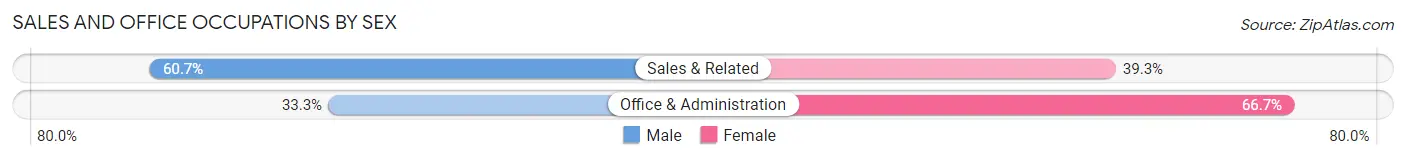
| Occupation | Male | Female |
| Sales & Related | 51 (60.7%) | 33 (39.3%) |
| Office & Administration | 11 (33.3%) | 22 (66.7%) |
| Total (Category) | 62 (53.0%) | 55 (47.0%) |
| Total (Overall) | 310 (50.5%) | 304 (49.5%) |
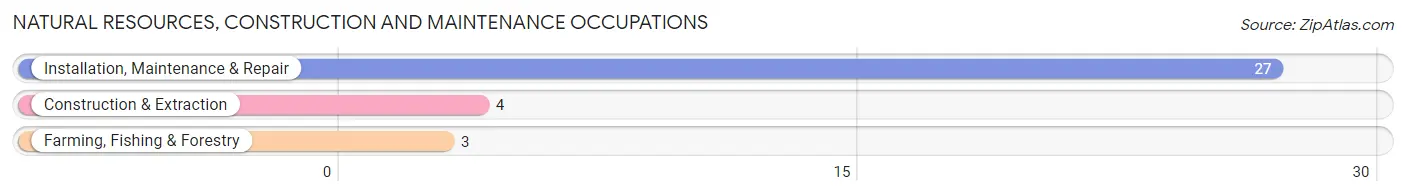
Natural Resources, Construction and Maintenance Occupations
The most common Natural Resources, Construction and Maintenance occupations in Long Beach are Installation, Maintenance & Repair (27 | 4.4%), Construction & Extraction (4 | 0.6%), and Farming, Fishing & Forestry (3 | 0.5%).
Natural Resources, Construction and Maintenance Occupations by Sex
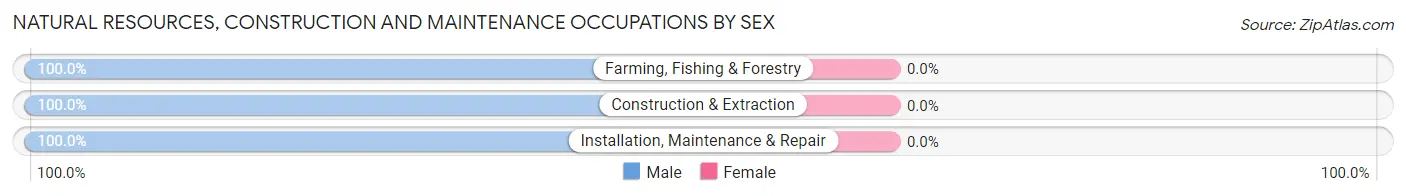
| Occupation | Male | Female |
| Farming, Fishing & Forestry | 3 (100.0%) | 0 (0.0%) |
| Construction & Extraction | 4 (100.0%) | 0 (0.0%) |
| Installation, Maintenance & Repair | 27 (100.0%) | 0 (0.0%) |
| Total (Category) | 34 (100.0%) | 0 (0.0%) |
| Total (Overall) | 310 (50.5%) | 304 (49.5%) |
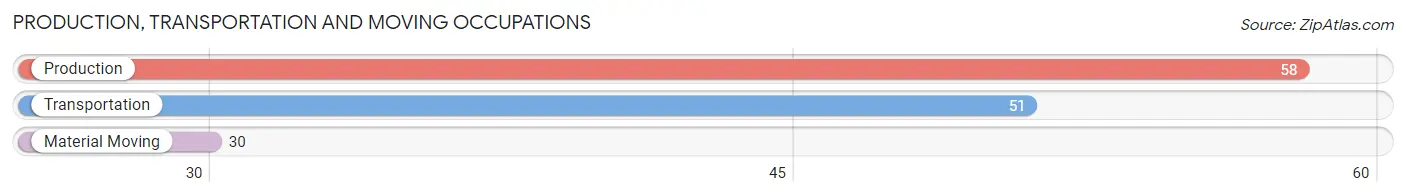
Production, Transportation and Moving Occupations
The most common Production, Transportation and Moving occupations in Long Beach are Production (58 | 9.5%), Transportation (51 | 8.3%), and Material Moving (30 | 4.9%).
Production, Transportation and Moving Occupations by Sex
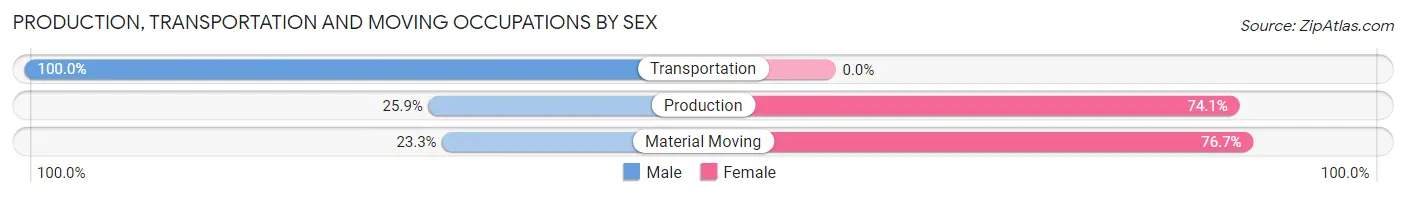
| Occupation | Male | Female |
| Production | 15 (25.9%) | 43 (74.1%) |
| Transportation | 51 (100.0%) | 0 (0.0%) |
| Material Moving | 7 (23.3%) | 23 (76.7%) |
| Total (Category) | 73 (52.5%) | 66 (47.5%) |
| Total (Overall) | 310 (50.5%) | 304 (49.5%) |
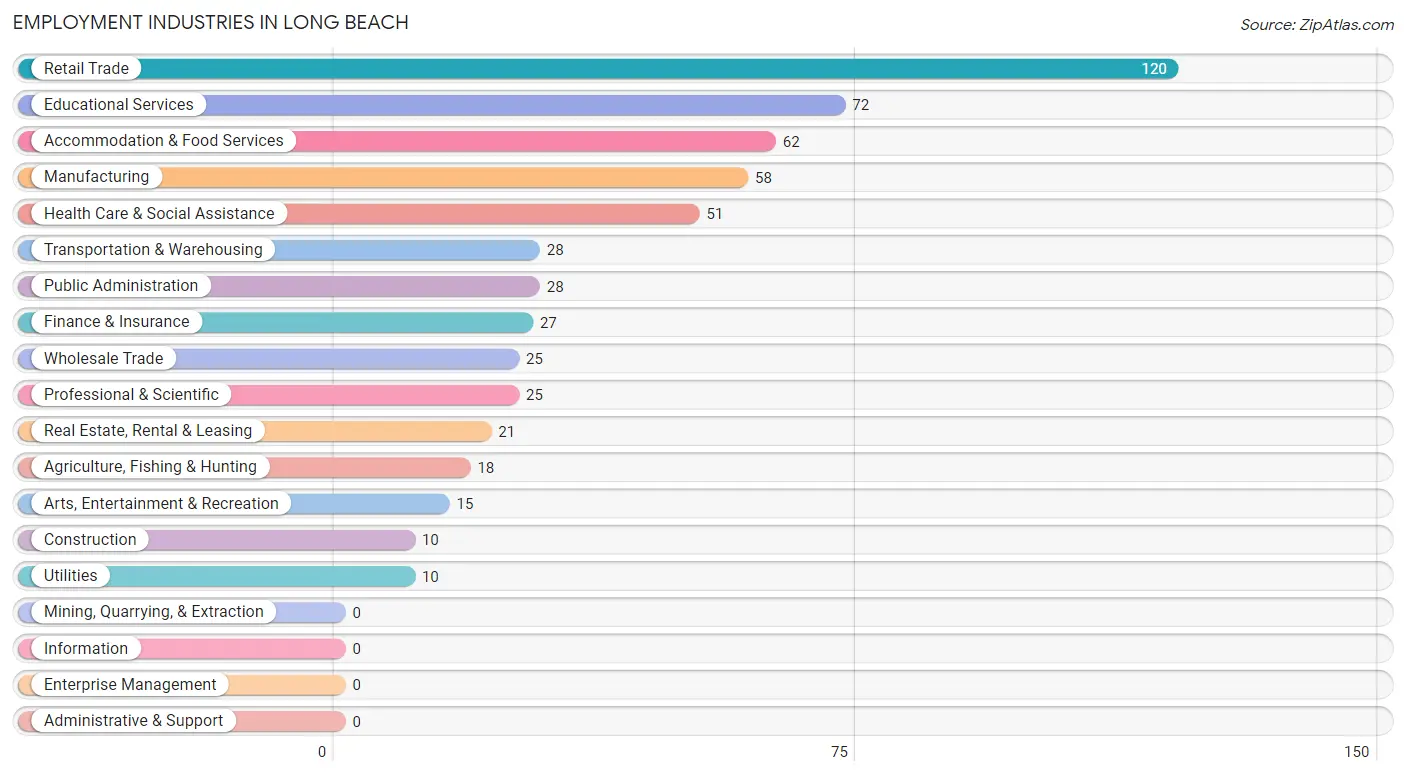
Employment Industries by Sex in Long Beach
Employment Industries in Long Beach
The major employment industries in Long Beach include Retail Trade (120 | 19.5%), Educational Services (72 | 11.7%), Accommodation & Food Services (62 | 10.1%), Manufacturing (58 | 9.5%), and Health Care & Social Assistance (51 | 8.3%).
Employment Industries by Sex in Long Beach
The Long Beach industries that see more men than women are Construction (100.0%), Wholesale Trade (100.0%), and Transportation & Warehousing (100.0%), whereas the industries that tend to have a higher number of women are Manufacturing (100.0%), Finance & Insurance (100.0%), and Health Care & Social Assistance (98.0%).
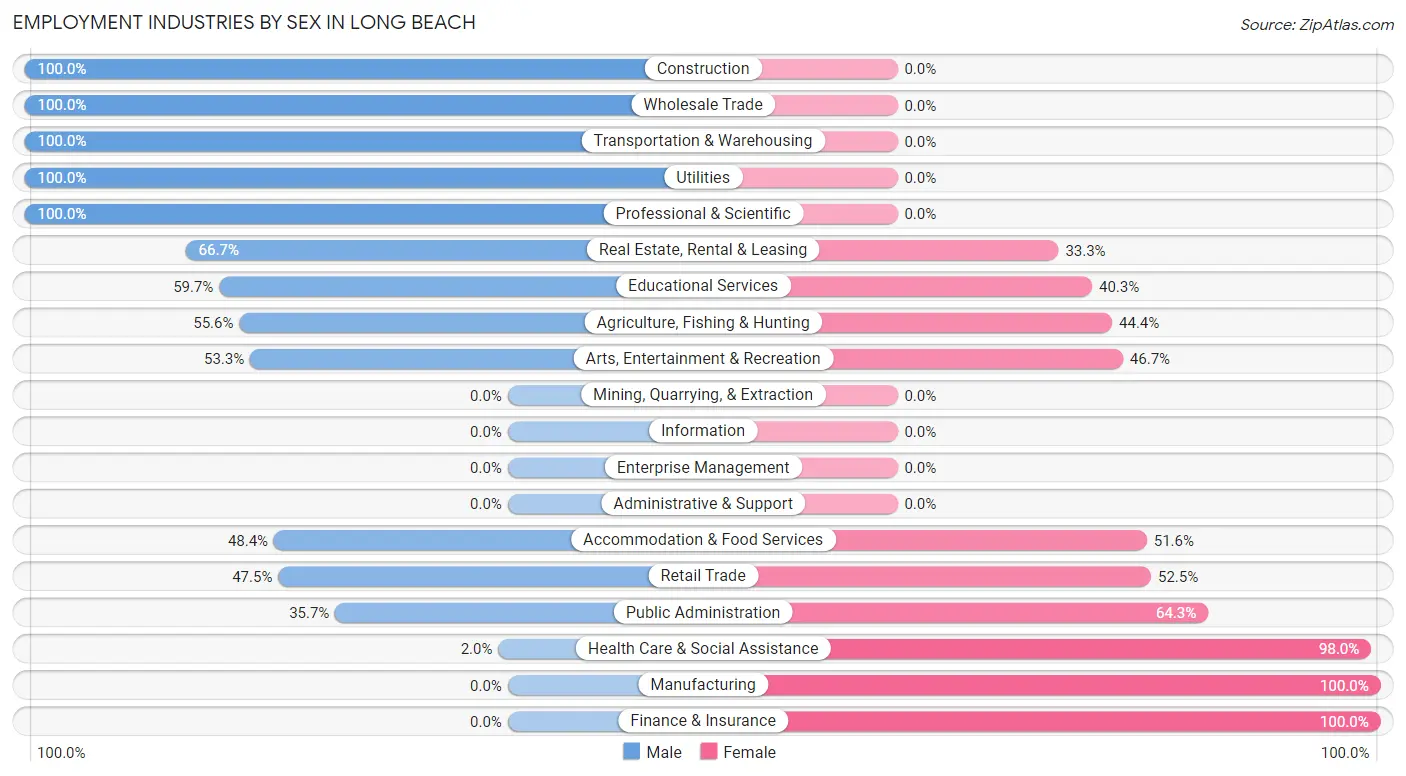
| Industry | Male | Female |
| Agriculture, Fishing & Hunting | 10 (55.6%) | 8 (44.4%) |
| Mining, Quarrying, & Extraction | 0 (0.0%) | 0 (0.0%) |
| Construction | 10 (100.0%) | 0 (0.0%) |
| Manufacturing | 0 (0.0%) | 58 (100.0%) |
| Wholesale Trade | 25 (100.0%) | 0 (0.0%) |
| Retail Trade | 57 (47.5%) | 63 (52.5%) |
| Transportation & Warehousing | 28 (100.0%) | 0 (0.0%) |
| Utilities | 10 (100.0%) | 0 (0.0%) |
| Information | 0 (0.0%) | 0 (0.0%) |
| Finance & Insurance | 0 (0.0%) | 27 (100.0%) |
| Real Estate, Rental & Leasing | 14 (66.7%) | 7 (33.3%) |
| Professional & Scientific | 25 (100.0%) | 0 (0.0%) |
| Enterprise Management | 0 (0.0%) | 0 (0.0%) |
| Administrative & Support | 0 (0.0%) | 0 (0.0%) |
| Educational Services | 43 (59.7%) | 29 (40.3%) |
| Health Care & Social Assistance | 1 (2.0%) | 50 (98.0%) |
| Arts, Entertainment & Recreation | 8 (53.3%) | 7 (46.7%) |
| Accommodation & Food Services | 30 (48.4%) | 32 (51.6%) |
| Public Administration | 10 (35.7%) | 18 (64.3%) |
| Total | 310 (50.5%) | 304 (49.5%) |
Education in Long Beach
School Enrollment in Long Beach
The most common levels of schooling among the 325 students in Long Beach are high school (118 | 36.3%), college / undergraduate (61 | 18.8%), and elementary school (52 | 16.0%).
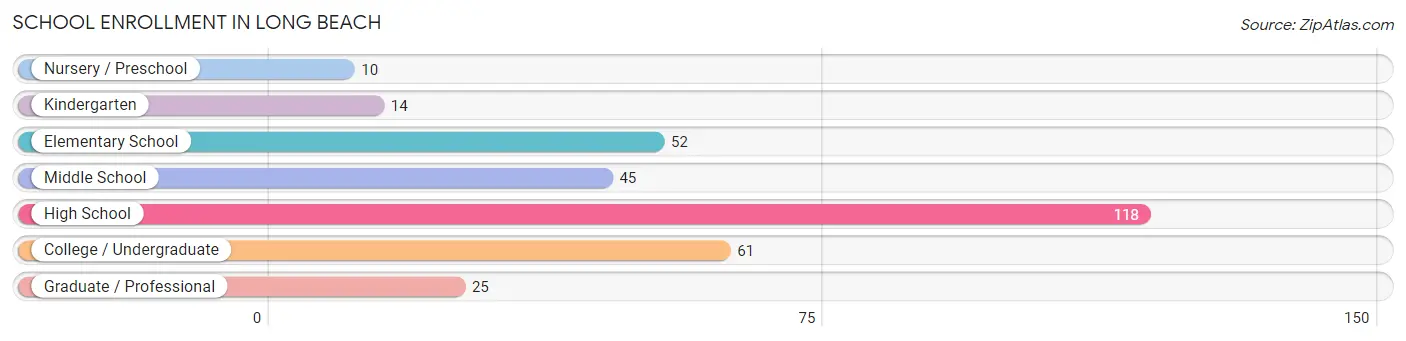
| School Level | # Students | % Students |
| Nursery / Preschool | 10 | 3.1% |
| Kindergarten | 14 | 4.3% |
| Elementary School | 52 | 16.0% |
| Middle School | 45 | 13.9% |
| High School | 118 | 36.3% |
| College / Undergraduate | 61 | 18.8% |
| Graduate / Professional | 25 | 7.7% |
| Total | 325 | 100.0% |
School Enrollment by Age by Funding Source in Long Beach
Out of a total of 325 students who are enrolled in schools in Long Beach, 13 (4.0%) attend a private institution, while the remaining 312 (96.0%) are enrolled in public schools. The age group of 20 to 24 year olds has the highest likelihood of being enrolled in private schools, with 6 (100.0% in the age bracket) enrolled. Conversely, the age group of 3 to 4 year olds has the lowest likelihood of being enrolled in a private school, with 2 (100.0% in the age bracket) attending a public institution.
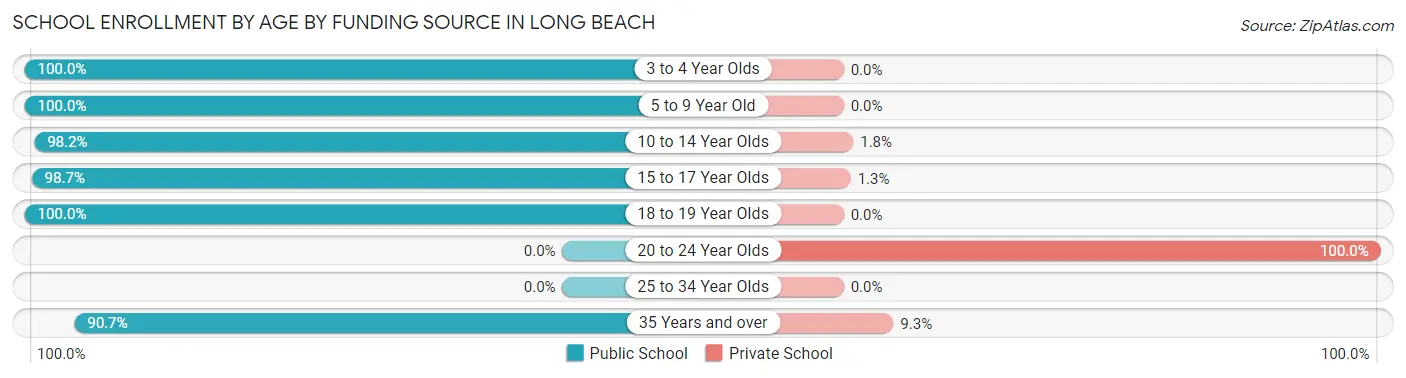
| Age Bracket | Public School | Private School |
| 3 to 4 Year Olds | 2 (100.0%) | 0 (0.0%) |
| 5 to 9 Year Old | 70 (100.0%) | 0 (0.0%) |
| 10 to 14 Year Olds | 55 (98.2%) | 1 (1.8%) |
| 15 to 17 Year Olds | 75 (98.7%) | 1 (1.3%) |
| 18 to 19 Year Olds | 61 (100.0%) | 0 (0.0%) |
| 20 to 24 Year Olds | 0 (0.0%) | 6 (100.0%) |
| 25 to 34 Year Olds | 0 (0.0%) | 0 (0.0%) |
| 35 Years and over | 49 (90.7%) | 5 (9.3%) |
| Total | 312 (96.0%) | 13 (4.0%) |
Educational Attainment by Field of Study in Long Beach
Education (64 | 21.8%), business (60 | 20.5%), computers & mathematics (29 | 9.9%), literature & languages (29 | 9.9%), and science & technology (28 | 9.6%) are the most common fields of study among 293 individuals in Long Beach who have obtained a bachelor's degree or higher.
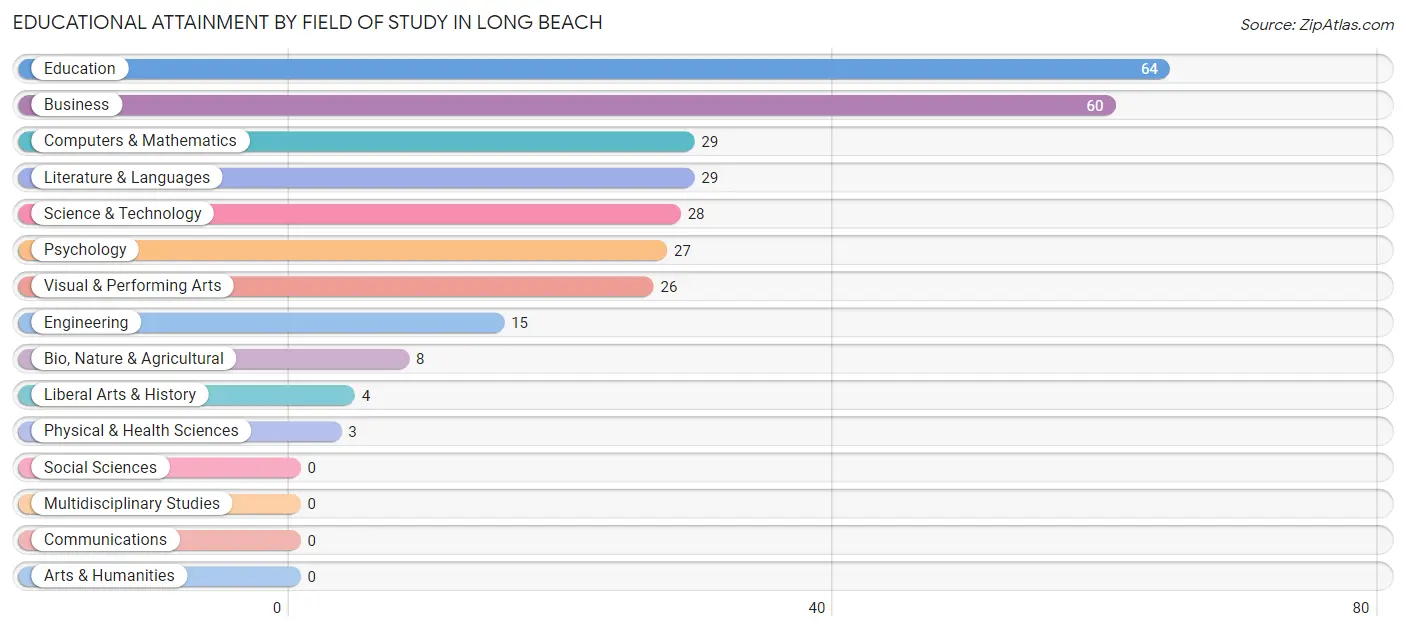
| Field of Study | # Graduates | % Graduates |
| Computers & Mathematics | 29 | 9.9% |
| Bio, Nature & Agricultural | 8 | 2.7% |
| Physical & Health Sciences | 3 | 1.0% |
| Psychology | 27 | 9.2% |
| Social Sciences | 0 | 0.0% |
| Engineering | 15 | 5.1% |
| Multidisciplinary Studies | 0 | 0.0% |
| Science & Technology | 28 | 9.6% |
| Business | 60 | 20.5% |
| Education | 64 | 21.8% |
| Literature & Languages | 29 | 9.9% |
| Liberal Arts & History | 4 | 1.4% |
| Visual & Performing Arts | 26 | 8.9% |
| Communications | 0 | 0.0% |
| Arts & Humanities | 0 | 0.0% |
| Total | 293 | 100.0% |
Transportation & Commute in Long Beach
Vehicle Availability by Sex in Long Beach
The most prevalent vehicle ownership categories in Long Beach are males with 2 vehicles (130, accounting for 48.0%) and females with 2 vehicles (136, making up 44.8%).
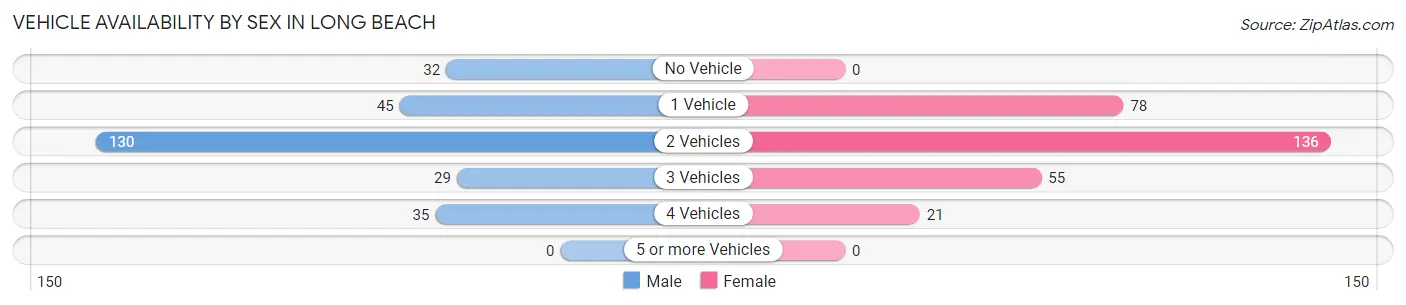
| Vehicles Available | Male | Female |
| No Vehicle | 32 (11.8%) | 0 (0.0%) |
| 1 Vehicle | 45 (16.6%) | 78 (26.9%) |
| 2 Vehicles | 130 (48.0%) | 136 (46.9%) |
| 3 Vehicles | 29 (10.7%) | 55 (19.0%) |
| 4 Vehicles | 35 (12.9%) | 21 (7.2%) |
| 5 or more Vehicles | 0 (0.0%) | 0 (0.0%) |
| Total | 271 (100.0%) | 290 (100.0%) |
Commute Time in Long Beach
The most frequently occuring commute durations in Long Beach are 5 to 9 minutes (152 commuters, 29.0%), less than 5 minutes (108 commuters, 20.6%), and 10 to 14 minutes (69 commuters, 13.2%).
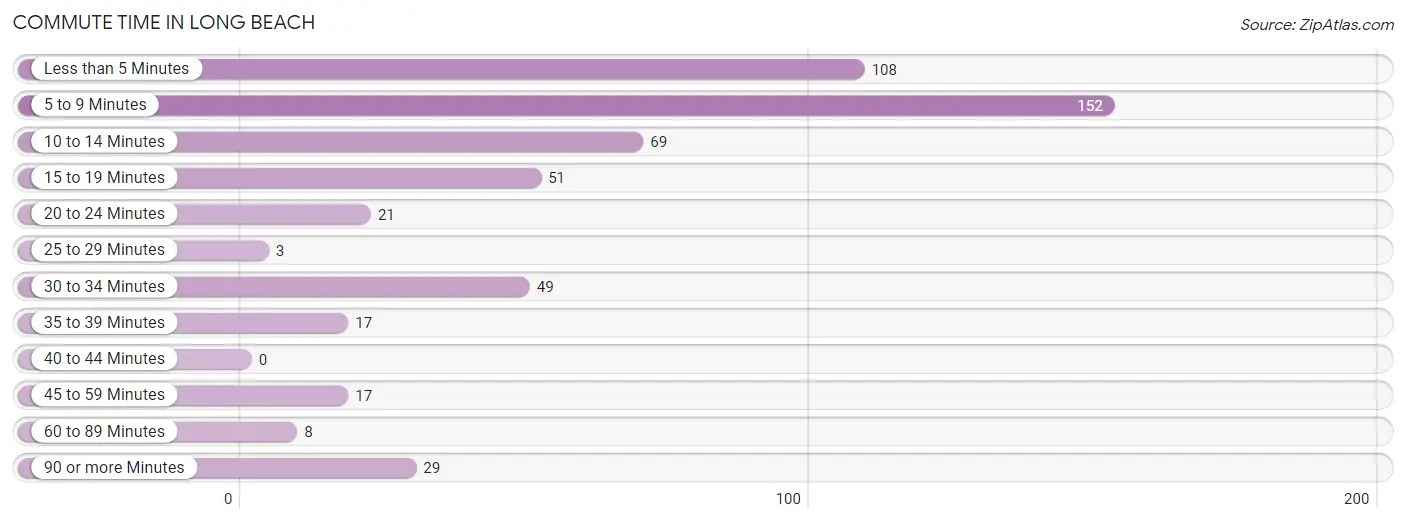
| Commute Time | # Commuters | % Commuters |
| Less than 5 Minutes | 108 | 20.6% |
| 5 to 9 Minutes | 152 | 29.0% |
| 10 to 14 Minutes | 69 | 13.2% |
| 15 to 19 Minutes | 51 | 9.7% |
| 20 to 24 Minutes | 21 | 4.0% |
| 25 to 29 Minutes | 3 | 0.6% |
| 30 to 34 Minutes | 49 | 9.3% |
| 35 to 39 Minutes | 17 | 3.2% |
| 40 to 44 Minutes | 0 | 0.0% |
| 45 to 59 Minutes | 17 | 3.2% |
| 60 to 89 Minutes | 8 | 1.5% |
| 90 or more Minutes | 29 | 5.5% |
Commute Time by Sex in Long Beach
The most common commute times in Long Beach are 5 to 9 minutes (77 commuters, 30.0%) for males and 5 to 9 minutes (75 commuters, 28.1%) for females.
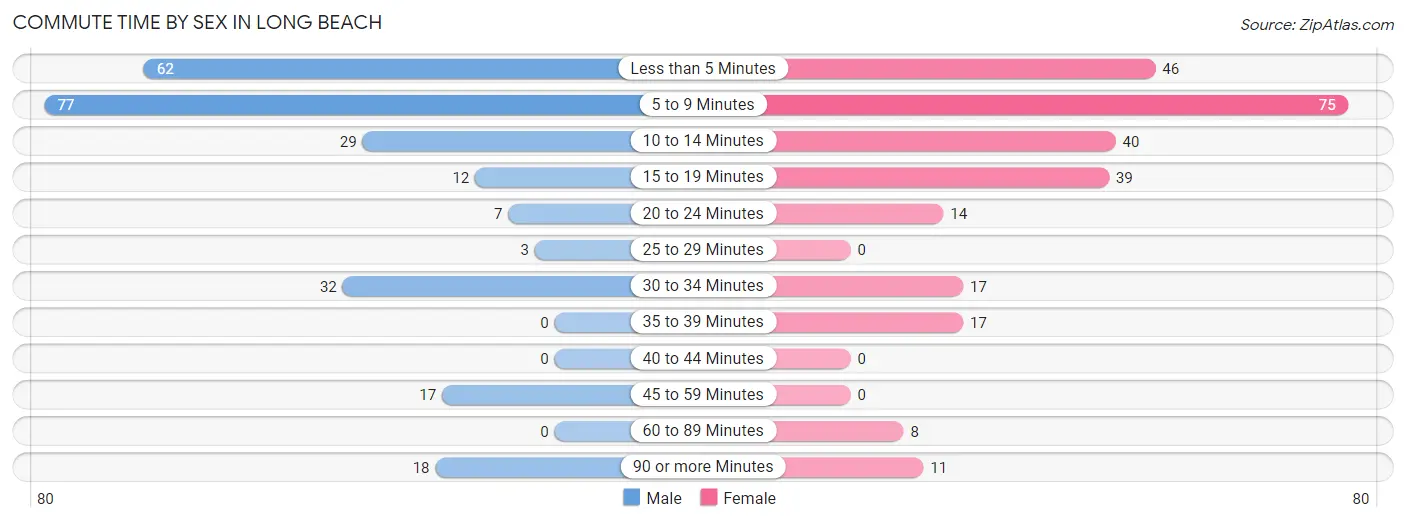
| Commute Time | Male | Female |
| Less than 5 Minutes | 62 (24.1%) | 46 (17.2%) |
| 5 to 9 Minutes | 77 (30.0%) | 75 (28.1%) |
| 10 to 14 Minutes | 29 (11.3%) | 40 (15.0%) |
| 15 to 19 Minutes | 12 (4.7%) | 39 (14.6%) |
| 20 to 24 Minutes | 7 (2.7%) | 14 (5.2%) |
| 25 to 29 Minutes | 3 (1.2%) | 0 (0.0%) |
| 30 to 34 Minutes | 32 (12.4%) | 17 (6.4%) |
| 35 to 39 Minutes | 0 (0.0%) | 17 (6.4%) |
| 40 to 44 Minutes | 0 (0.0%) | 0 (0.0%) |
| 45 to 59 Minutes | 17 (6.6%) | 0 (0.0%) |
| 60 to 89 Minutes | 0 (0.0%) | 8 (3.0%) |
| 90 or more Minutes | 18 (7.0%) | 11 (4.1%) |
Time of Departure to Work by Sex in Long Beach
The most frequent times of departure to work in Long Beach are 9:00 AM to 9:59 AM (61, 23.7%) for males and 9:00 AM to 9:59 AM (58, 21.7%) for females.
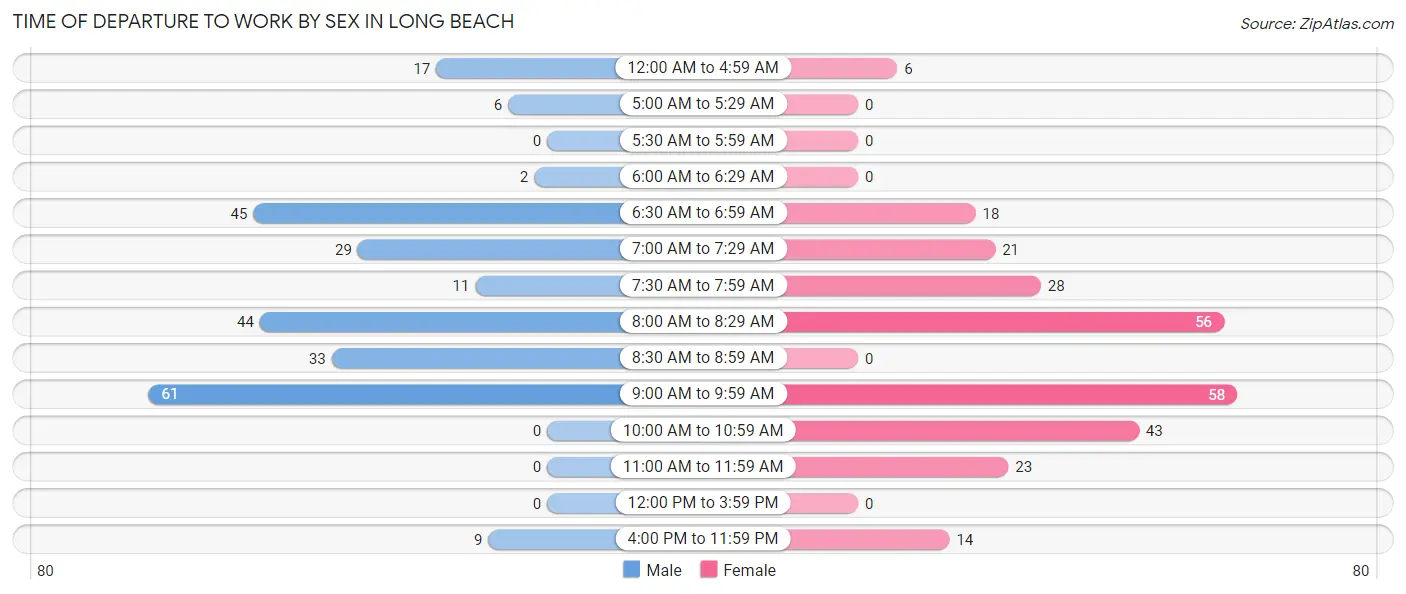
| Time of Departure | Male | Female |
| 12:00 AM to 4:59 AM | 17 (6.6%) | 6 (2.2%) |
| 5:00 AM to 5:29 AM | 6 (2.3%) | 0 (0.0%) |
| 5:30 AM to 5:59 AM | 0 (0.0%) | 0 (0.0%) |
| 6:00 AM to 6:29 AM | 2 (0.8%) | 0 (0.0%) |
| 6:30 AM to 6:59 AM | 45 (17.5%) | 18 (6.7%) |
| 7:00 AM to 7:29 AM | 29 (11.3%) | 21 (7.9%) |
| 7:30 AM to 7:59 AM | 11 (4.3%) | 28 (10.5%) |
| 8:00 AM to 8:29 AM | 44 (17.1%) | 56 (21.0%) |
| 8:30 AM to 8:59 AM | 33 (12.8%) | 0 (0.0%) |
| 9:00 AM to 9:59 AM | 61 (23.7%) | 58 (21.7%) |
| 10:00 AM to 10:59 AM | 0 (0.0%) | 43 (16.1%) |
| 11:00 AM to 11:59 AM | 0 (0.0%) | 23 (8.6%) |
| 12:00 PM to 3:59 PM | 0 (0.0%) | 0 (0.0%) |
| 4:00 PM to 11:59 PM | 9 (3.5%) | 14 (5.2%) |
| Total | 257 (100.0%) | 267 (100.0%) |
Housing Occupancy in Long Beach
Occupancy by Ownership in Long Beach
Of the total 841 dwellings in Long Beach, owner-occupied units account for 536 (63.7%), while renter-occupied units make up 305 (36.3%).
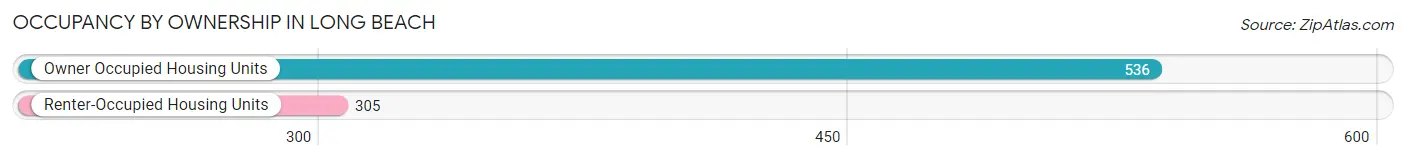
| Occupancy | # Housing Units | % Housing Units |
| Owner Occupied Housing Units | 536 | 63.7% |
| Renter-Occupied Housing Units | 305 | 36.3% |
| Total Occupied Housing Units | 841 | 100.0% |
Occupancy by Household Size in Long Beach
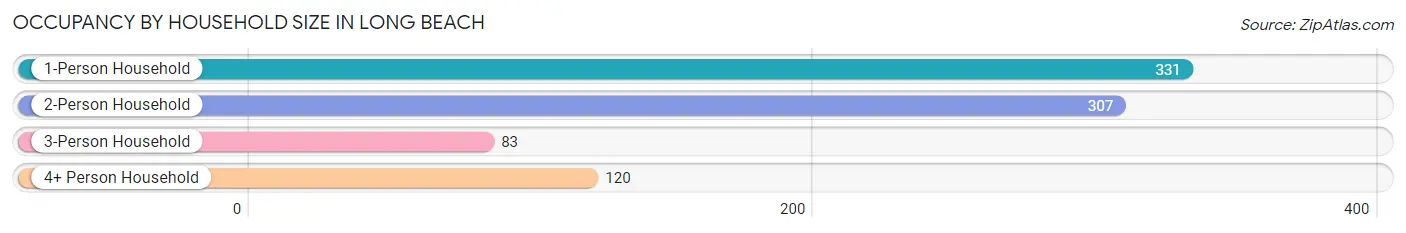
| Household Size | # Housing Units | % Housing Units |
| 1-Person Household | 331 | 39.4% |
| 2-Person Household | 307 | 36.5% |
| 3-Person Household | 83 | 9.9% |
| 4+ Person Household | 120 | 14.3% |
| Total Housing Units | 841 | 100.0% |
Occupancy by Ownership by Household Size in Long Beach
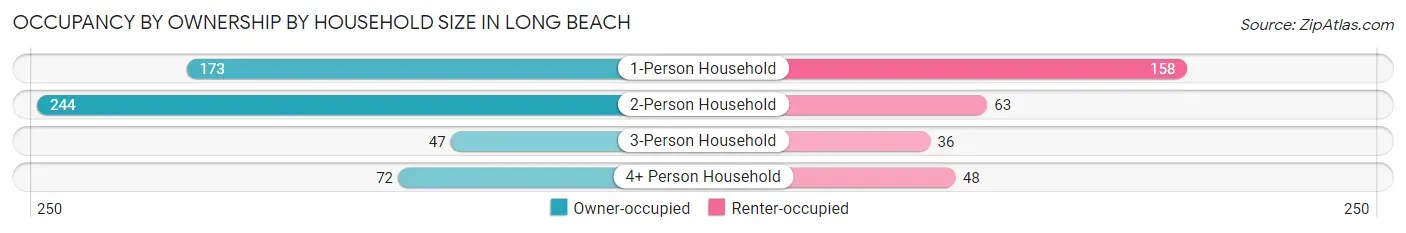
| Household Size | Owner-occupied | Renter-occupied |
| 1-Person Household | 173 (52.3%) | 158 (47.7%) |
| 2-Person Household | 244 (79.5%) | 63 (20.5%) |
| 3-Person Household | 47 (56.6%) | 36 (43.4%) |
| 4+ Person Household | 72 (60.0%) | 48 (40.0%) |
| Total Housing Units | 536 (63.7%) | 305 (36.3%) |
Occupancy by Educational Attainment in Long Beach
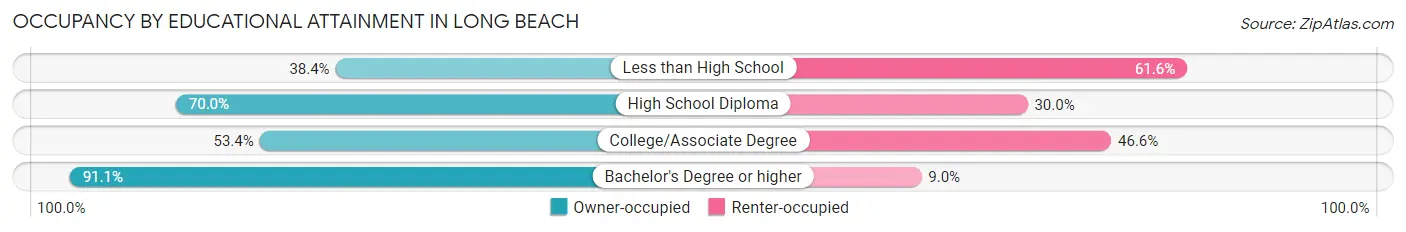
| Household Size | Owner-occupied | Renter-occupied |
| Less than High School | 33 (38.4%) | 53 (61.6%) |
| High School Diploma | 119 (70.0%) | 51 (30.0%) |
| College/Associate Degree | 211 (53.4%) | 184 (46.6%) |
| Bachelor's Degree or higher | 173 (91.0%) | 17 (8.9%) |
Occupancy by Age of Householder in Long Beach
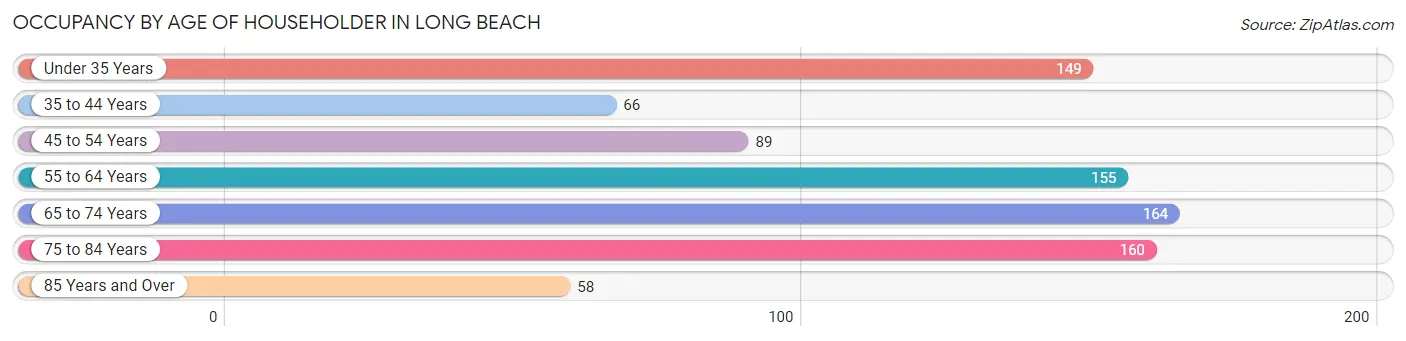
| Age Bracket | # Households | % Households |
| Under 35 Years | 149 | 17.7% |
| 35 to 44 Years | 66 | 7.9% |
| 45 to 54 Years | 89 | 10.6% |
| 55 to 64 Years | 155 | 18.4% |
| 65 to 74 Years | 164 | 19.5% |
| 75 to 84 Years | 160 | 19.0% |
| 85 Years and Over | 58 | 6.9% |
| Total | 841 | 100.0% |
Housing Finances in Long Beach
Median Income by Occupancy in Long Beach
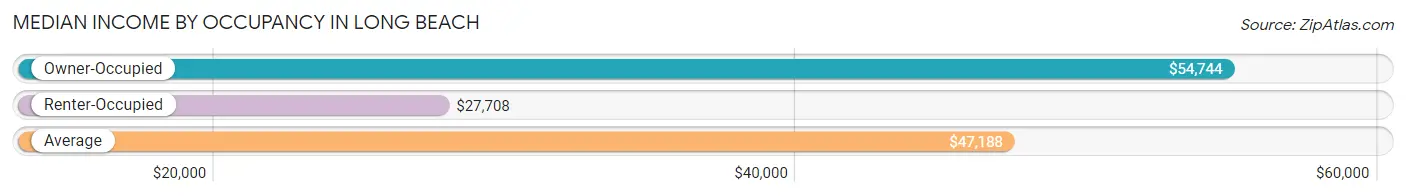
| Occupancy Type | # Households | Median Income |
| Owner-Occupied | 536 (63.7%) | $54,744 |
| Renter-Occupied | 305 (36.3%) | $27,708 |
| Average | 841 (100.0%) | $47,188 |
Occupancy by Householder Income Bracket in Long Beach
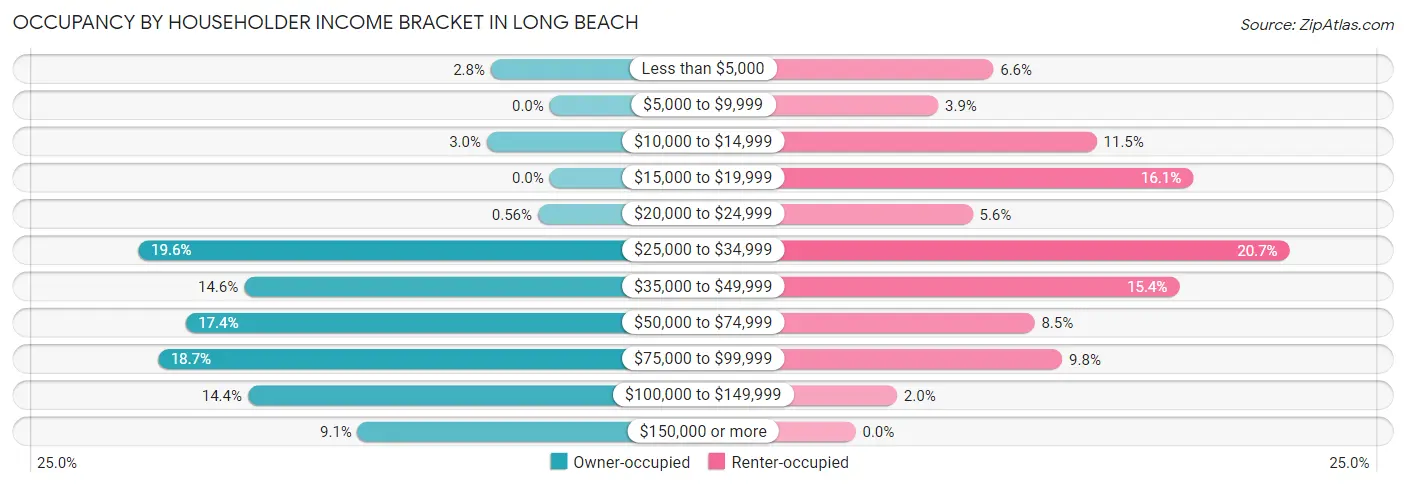
| Income Bracket | Owner-occupied | Renter-occupied |
| Less than $5,000 | 15 (2.8%) | 20 (6.6%) |
| $5,000 to $9,999 | 0 (0.0%) | 12 (3.9%) |
| $10,000 to $14,999 | 16 (3.0%) | 35 (11.5%) |
| $15,000 to $19,999 | 0 (0.0%) | 49 (16.1%) |
| $20,000 to $24,999 | 3 (0.6%) | 17 (5.6%) |
| $25,000 to $34,999 | 105 (19.6%) | 63 (20.7%) |
| $35,000 to $49,999 | 78 (14.5%) | 47 (15.4%) |
| $50,000 to $74,999 | 93 (17.3%) | 26 (8.5%) |
| $75,000 to $99,999 | 100 (18.7%) | 30 (9.8%) |
| $100,000 to $149,999 | 77 (14.4%) | 6 (2.0%) |
| $150,000 or more | 49 (9.1%) | 0 (0.0%) |
| Total | 536 (100.0%) | 305 (100.0%) |
Monthly Housing Cost Tiers in Long Beach
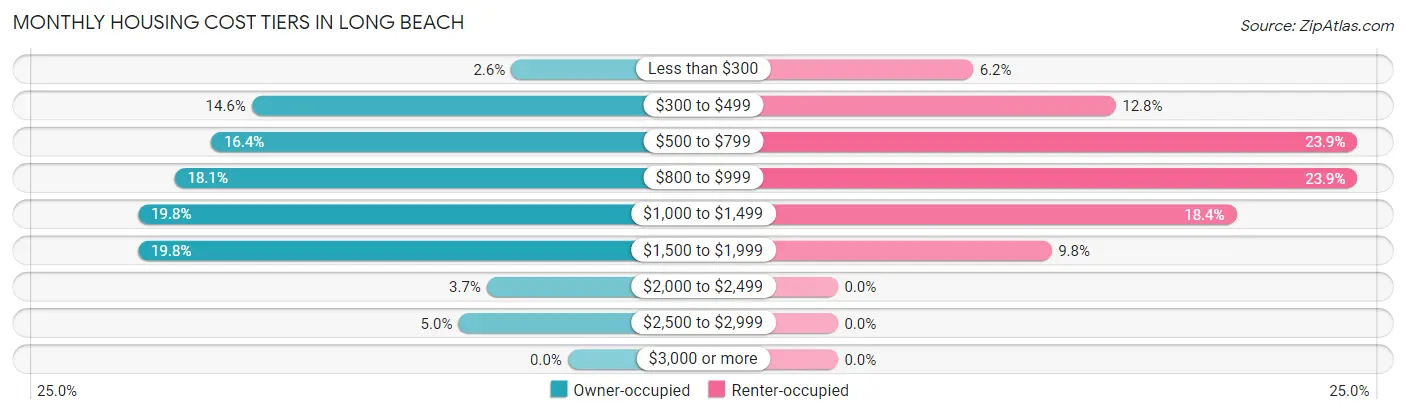
| Monthly Cost | Owner-occupied | Renter-occupied |
| Less than $300 | 14 (2.6%) | 19 (6.2%) |
| $300 to $499 | 78 (14.5%) | 39 (12.8%) |
| $500 to $799 | 88 (16.4%) | 73 (23.9%) |
| $800 to $999 | 97 (18.1%) | 73 (23.9%) |
| $1,000 to $1,499 | 106 (19.8%) | 56 (18.4%) |
| $1,500 to $1,999 | 106 (19.8%) | 30 (9.8%) |
| $2,000 to $2,499 | 20 (3.7%) | 0 (0.0%) |
| $2,500 to $2,999 | 27 (5.0%) | 0 (0.0%) |
| $3,000 or more | 0 (0.0%) | 0 (0.0%) |
| Total | 536 (100.0%) | 305 (100.0%) |
Physical Housing Characteristics in Long Beach
Housing Structures in Long Beach
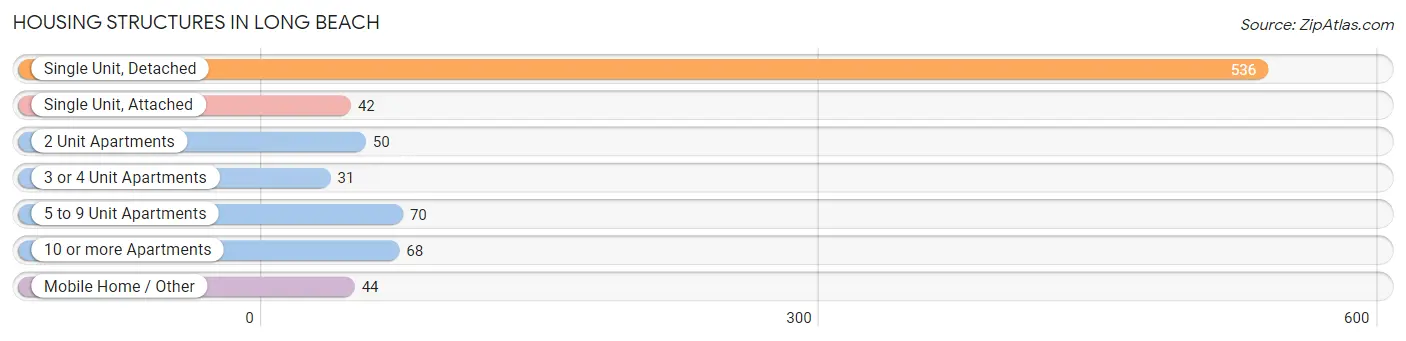
| Structure Type | # Housing Units | % Housing Units |
| Single Unit, Detached | 536 | 63.7% |
| Single Unit, Attached | 42 | 5.0% |
| 2 Unit Apartments | 50 | 5.9% |
| 3 or 4 Unit Apartments | 31 | 3.7% |
| 5 to 9 Unit Apartments | 70 | 8.3% |
| 10 or more Apartments | 68 | 8.1% |
| Mobile Home / Other | 44 | 5.2% |
| Total | 841 | 100.0% |
Housing Structures by Occupancy in Long Beach
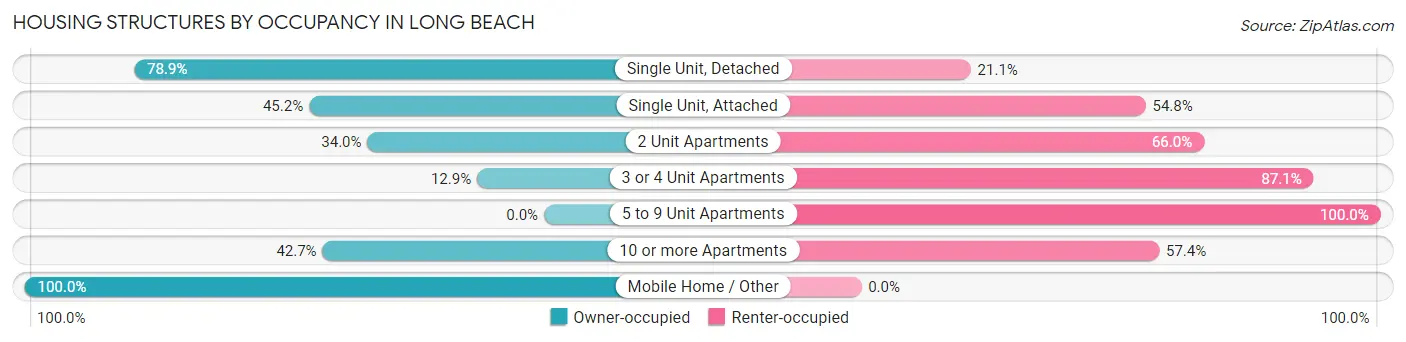
| Structure Type | Owner-occupied | Renter-occupied |
| Single Unit, Detached | 423 (78.9%) | 113 (21.1%) |
| Single Unit, Attached | 19 (45.2%) | 23 (54.8%) |
| 2 Unit Apartments | 17 (34.0%) | 33 (66.0%) |
| 3 or 4 Unit Apartments | 4 (12.9%) | 27 (87.1%) |
| 5 to 9 Unit Apartments | 0 (0.0%) | 70 (100.0%) |
| 10 or more Apartments | 29 (42.6%) | 39 (57.4%) |
| Mobile Home / Other | 44 (100.0%) | 0 (0.0%) |
| Total | 536 (63.7%) | 305 (36.3%) |
Housing Structures by Number of Rooms in Long Beach
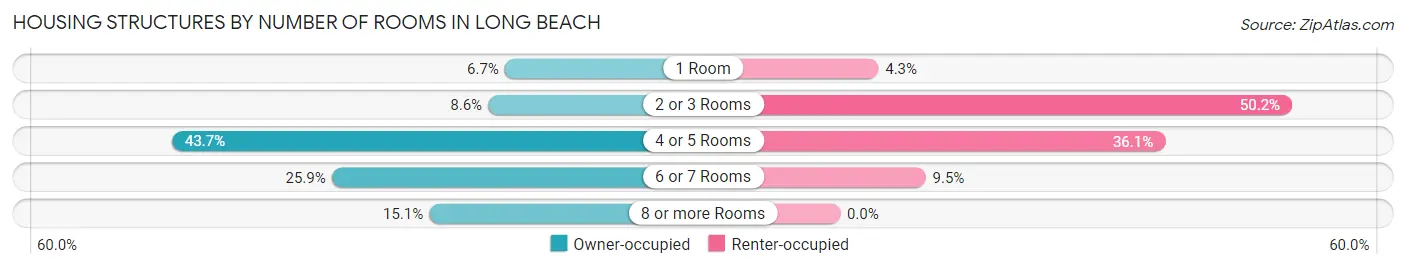
| Number of Rooms | Owner-occupied | Renter-occupied |
| 1 Room | 36 (6.7%) | 13 (4.3%) |
| 2 or 3 Rooms | 46 (8.6%) | 153 (50.2%) |
| 4 or 5 Rooms | 234 (43.7%) | 110 (36.1%) |
| 6 or 7 Rooms | 139 (25.9%) | 29 (9.5%) |
| 8 or more Rooms | 81 (15.1%) | 0 (0.0%) |
| Total | 536 (100.0%) | 305 (100.0%) |
Housing Structure by Heating Type in Long Beach
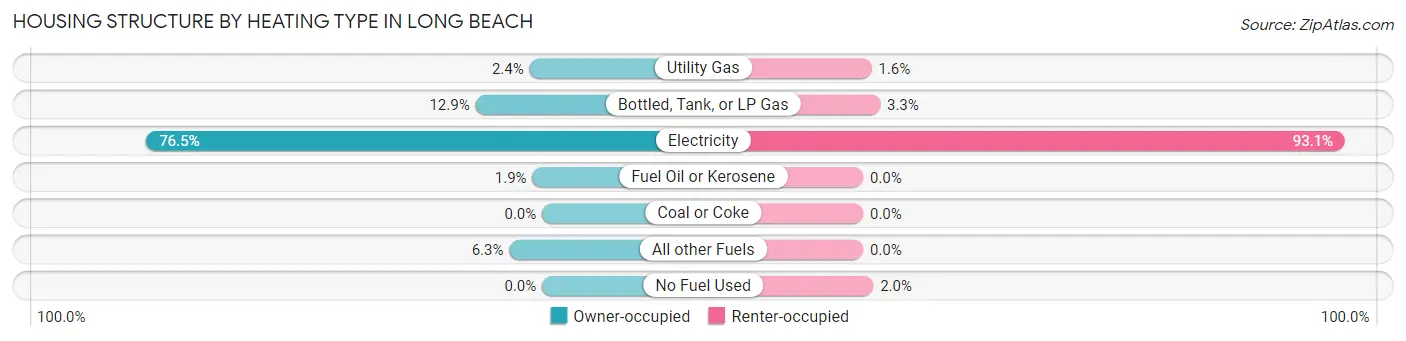
| Heating Type | Owner-occupied | Renter-occupied |
| Utility Gas | 13 (2.4%) | 5 (1.6%) |
| Bottled, Tank, or LP Gas | 69 (12.9%) | 10 (3.3%) |
| Electricity | 410 (76.5%) | 284 (93.1%) |
| Fuel Oil or Kerosene | 10 (1.9%) | 0 (0.0%) |
| Coal or Coke | 0 (0.0%) | 0 (0.0%) |
| All other Fuels | 34 (6.3%) | 0 (0.0%) |
| No Fuel Used | 0 (0.0%) | 6 (2.0%) |
| Total | 536 (100.0%) | 305 (100.0%) |
Household Vehicle Usage in Long Beach
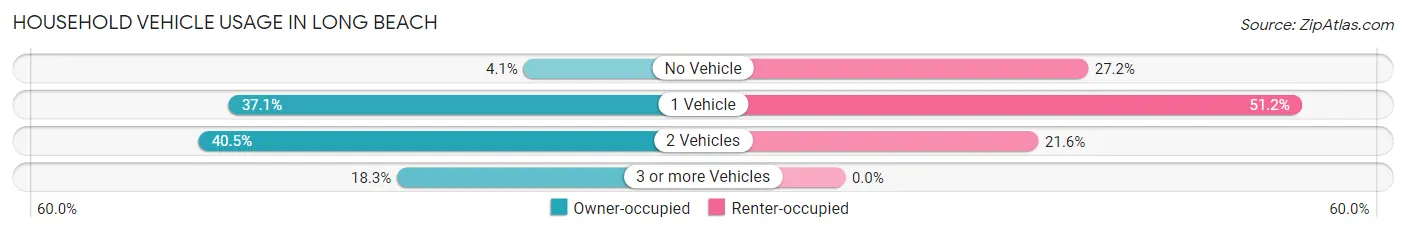
| Vehicles per Household | Owner-occupied | Renter-occupied |
| No Vehicle | 22 (4.1%) | 83 (27.2%) |
| 1 Vehicle | 199 (37.1%) | 156 (51.1%) |
| 2 Vehicles | 217 (40.5%) | 66 (21.6%) |
| 3 or more Vehicles | 98 (18.3%) | 0 (0.0%) |
| Total | 536 (100.0%) | 305 (100.0%) |
Real Estate & Mortgages in Long Beach
Real Estate and Mortgage Overview in Long Beach
| Characteristic | Without Mortgage | With Mortgage |
| Housing Units | 208 | 328 |
| Median Property Value | $241,800 | $346,200 |
| Median Household Income | $53,472 | $36 |
| Monthly Housing Costs | $550 | $0 |
| Real Estate Taxes | $2,205 | $0 |
Property Value by Mortgage Status in Long Beach
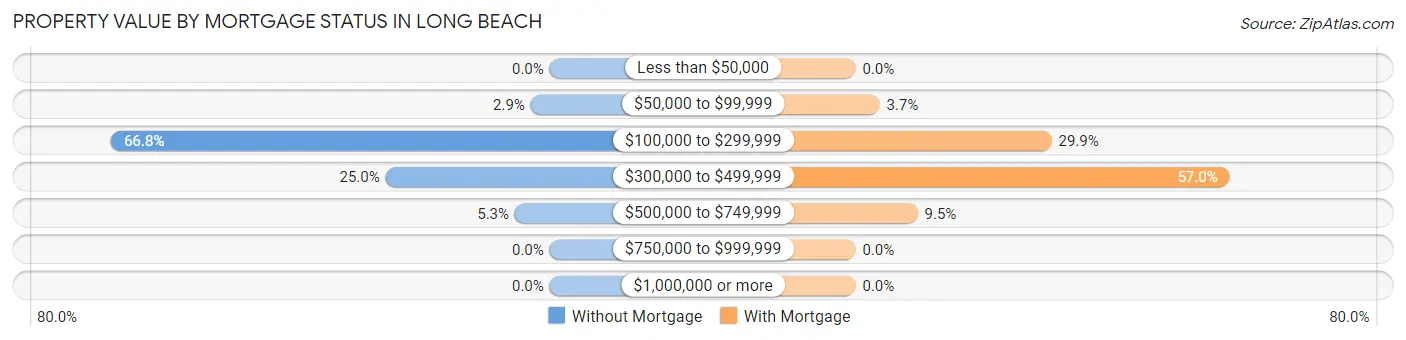
| Property Value | Without Mortgage | With Mortgage |
| Less than $50,000 | 0 (0.0%) | 0 (0.0%) |
| $50,000 to $99,999 | 6 (2.9%) | 12 (3.7%) |
| $100,000 to $299,999 | 139 (66.8%) | 98 (29.9%) |
| $300,000 to $499,999 | 52 (25.0%) | 187 (57.0%) |
| $500,000 to $749,999 | 11 (5.3%) | 31 (9.5%) |
| $750,000 to $999,999 | 0 (0.0%) | 0 (0.0%) |
| $1,000,000 or more | 0 (0.0%) | 0 (0.0%) |
| Total | 208 (100.0%) | 328 (100.0%) |
Household Income by Mortgage Status in Long Beach
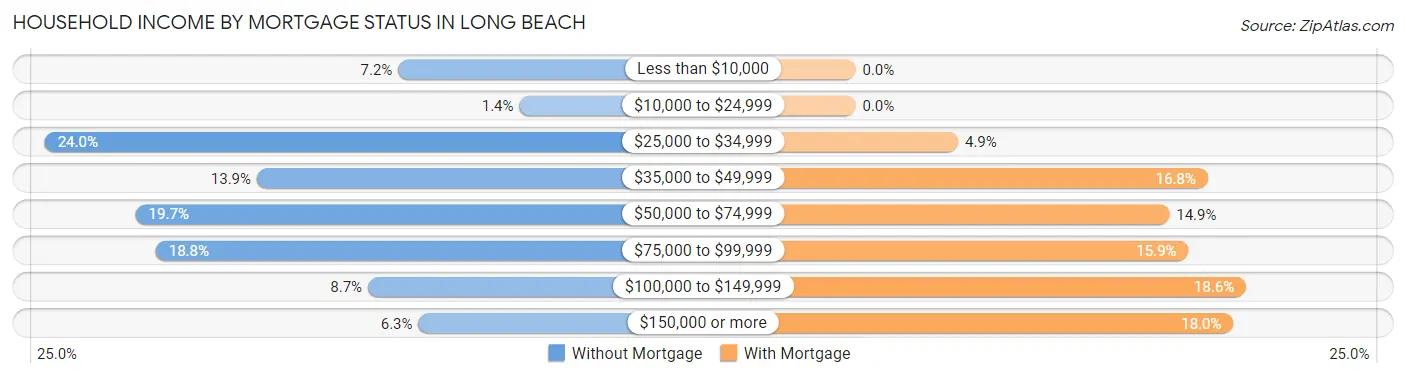
| Household Income | Without Mortgage | With Mortgage |
| Less than $10,000 | 15 (7.2%) | 0 (0.0%) |
| $10,000 to $24,999 | 3 (1.4%) | 0 (0.0%) |
| $25,000 to $34,999 | 50 (24.0%) | 16 (4.9%) |
| $35,000 to $49,999 | 29 (13.9%) | 55 (16.8%) |
| $50,000 to $74,999 | 41 (19.7%) | 49 (14.9%) |
| $75,000 to $99,999 | 39 (18.8%) | 52 (15.9%) |
| $100,000 to $149,999 | 18 (8.6%) | 61 (18.6%) |
| $150,000 or more | 13 (6.2%) | 59 (18.0%) |
| Total | 208 (100.0%) | 328 (100.0%) |
Property Value to Household Income Ratio in Long Beach
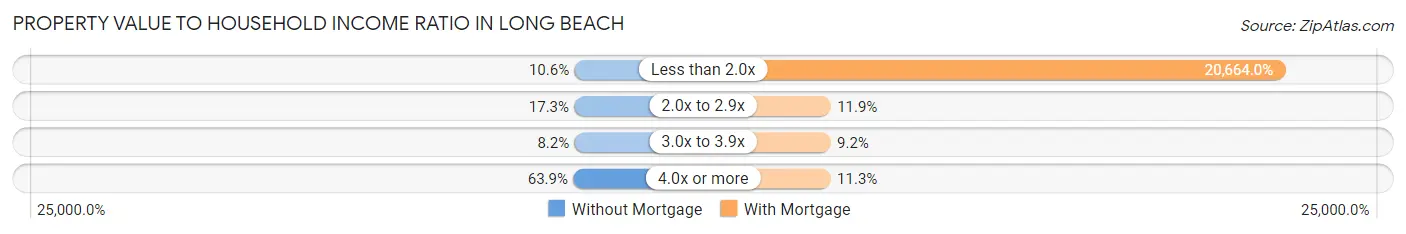
| Value-to-Income Ratio | Without Mortgage | With Mortgage |
| Less than 2.0x | 22 (10.6%) | 67,778 (20,664.0%) |
| 2.0x to 2.9x | 36 (17.3%) | 39 (11.9%) |
| 3.0x to 3.9x | 17 (8.2%) | 30 (9.1%) |
| 4.0x or more | 133 (63.9%) | 37 (11.3%) |
| Total | 208 (100.0%) | 328 (100.0%) |
Real Estate Taxes by Mortgage Status in Long Beach
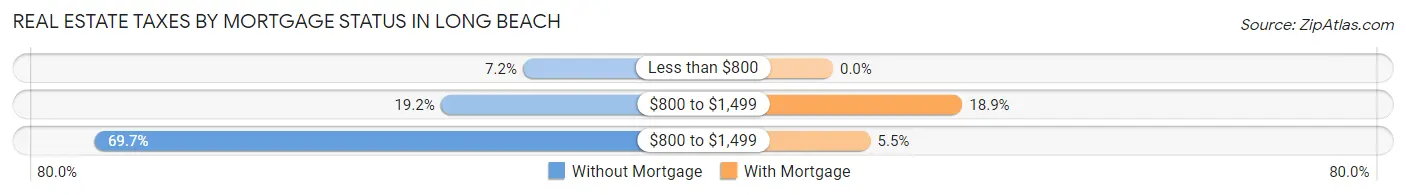
| Property Taxes | Without Mortgage | With Mortgage |
| Less than $800 | 15 (7.2%) | 0 (0.0%) |
| $800 to $1,499 | 40 (19.2%) | 62 (18.9%) |
| $800 to $1,499 | 145 (69.7%) | 18 (5.5%) |
| Total | 208 (100.0%) | 328 (100.0%) |
Health & Disability in Long Beach
Health Insurance Coverage by Age in Long Beach
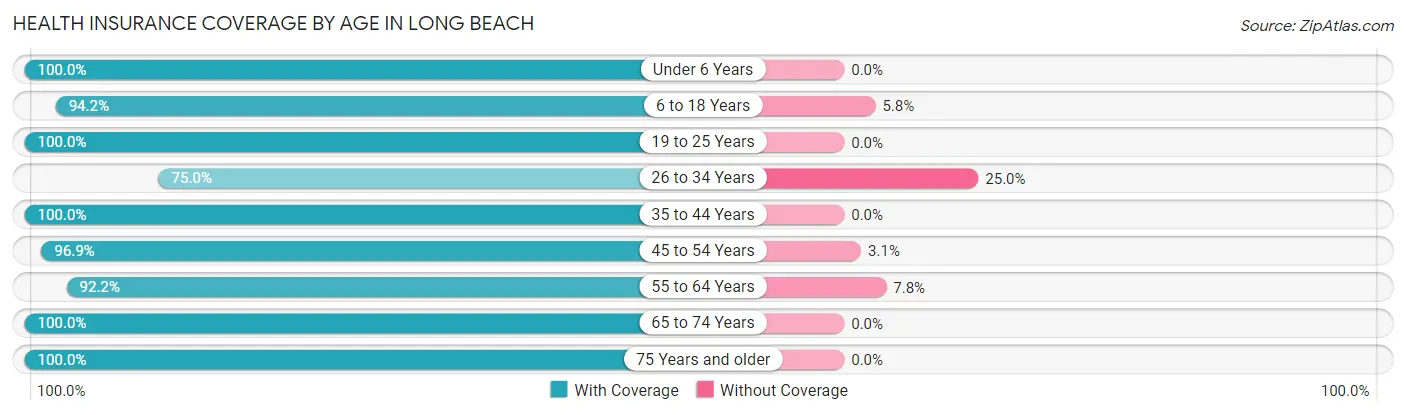
| Age Bracket | With Coverage | Without Coverage |
| Under 6 Years | 82 (100.0%) | 0 (0.0%) |
| 6 to 18 Years | 243 (94.2%) | 15 (5.8%) |
| 19 to 25 Years | 109 (100.0%) | 0 (0.0%) |
| 26 to 34 Years | 171 (75.0%) | 57 (25.0%) |
| 35 to 44 Years | 144 (100.0%) | 0 (0.0%) |
| 45 to 54 Years | 185 (96.9%) | 6 (3.1%) |
| 55 to 64 Years | 247 (92.2%) | 21 (7.8%) |
| 65 to 74 Years | 281 (100.0%) | 0 (0.0%) |
| 75 Years and older | 266 (100.0%) | 0 (0.0%) |
| Total | 1,728 (94.6%) | 99 (5.4%) |
Health Insurance Coverage by Citizenship Status in Long Beach
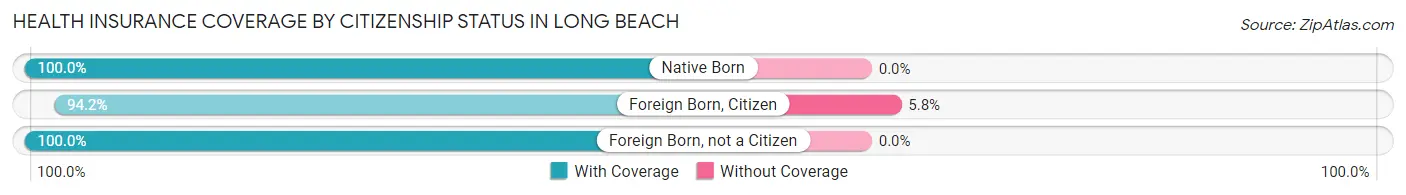
| Citizenship Status | With Coverage | Without Coverage |
| Native Born | 82 (100.0%) | 0 (0.0%) |
| Foreign Born, Citizen | 243 (94.2%) | 15 (5.8%) |
| Foreign Born, not a Citizen | 109 (100.0%) | 0 (0.0%) |
Health Insurance Coverage by Household Income in Long Beach
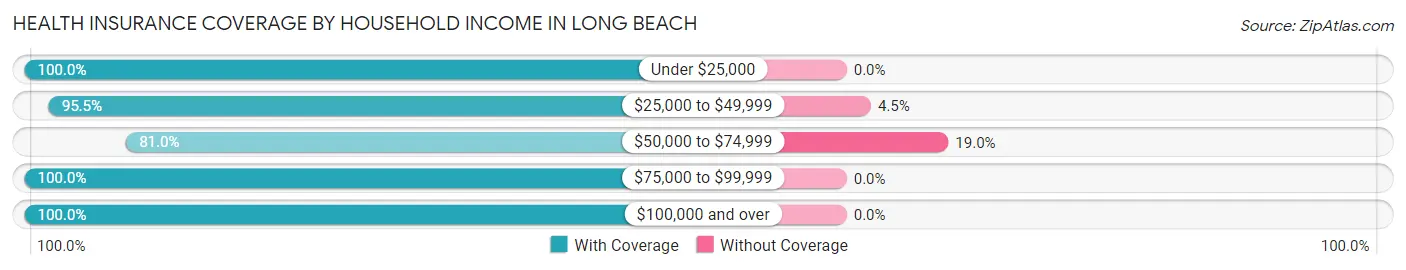
| Household Income | With Coverage | Without Coverage |
| Under $25,000 | 212 (100.0%) | 0 (0.0%) |
| $25,000 to $49,999 | 505 (95.5%) | 24 (4.5%) |
| $50,000 to $74,999 | 319 (81.0%) | 75 (19.0%) |
| $75,000 to $99,999 | 365 (100.0%) | 0 (0.0%) |
| $100,000 and over | 321 (100.0%) | 0 (0.0%) |
Public vs Private Health Insurance Coverage by Age in Long Beach
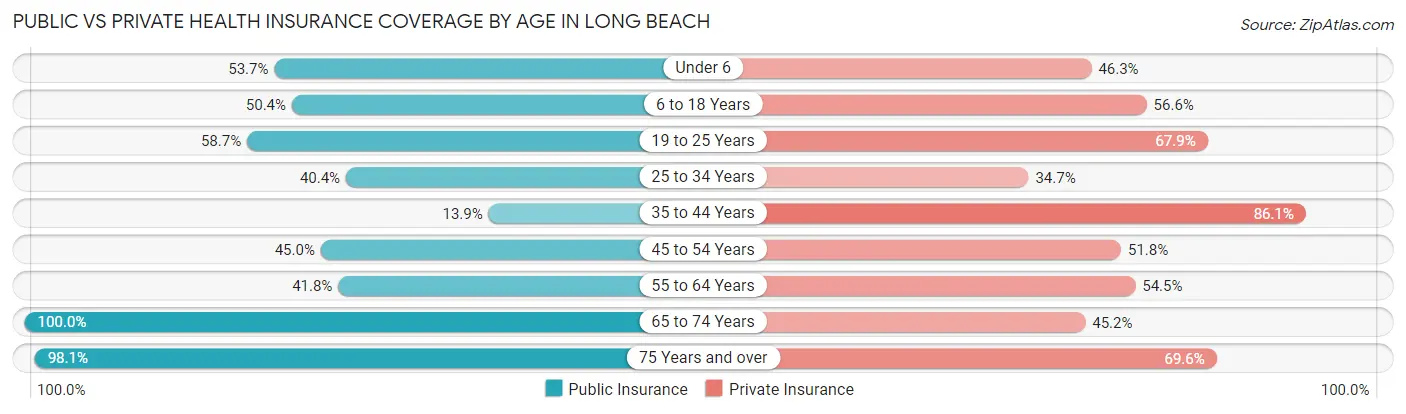
| Age Bracket | Public Insurance | Private Insurance |
| Under 6 | 44 (53.7%) | 38 (46.3%) |
| 6 to 18 Years | 130 (50.4%) | 146 (56.6%) |
| 19 to 25 Years | 64 (58.7%) | 74 (67.9%) |
| 25 to 34 Years | 92 (40.4%) | 79 (34.6%) |
| 35 to 44 Years | 20 (13.9%) | 124 (86.1%) |
| 45 to 54 Years | 86 (45.0%) | 99 (51.8%) |
| 55 to 64 Years | 112 (41.8%) | 146 (54.5%) |
| 65 to 74 Years | 281 (100.0%) | 127 (45.2%) |
| 75 Years and over | 261 (98.1%) | 185 (69.6%) |
| Total | 1,090 (59.7%) | 1,018 (55.7%) |
Disability Status by Sex by Age in Long Beach
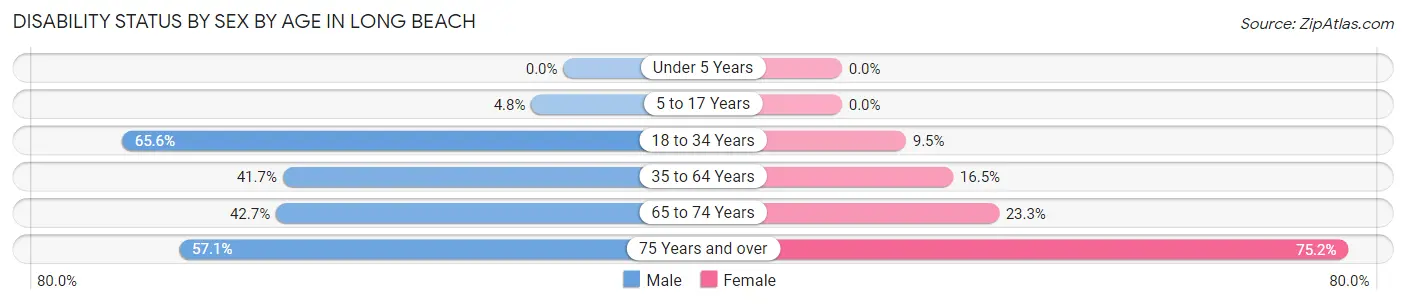
| Age Bracket | Male | Female |
| Under 5 Years | 0 (0.0%) | 0 (0.0%) |
| 5 to 17 Years | 4 (4.8%) | 0 (0.0%) |
| 18 to 34 Years | 118 (65.6%) | 21 (9.5%) |
| 35 to 64 Years | 125 (41.7%) | 50 (16.5%) |
| 65 to 74 Years | 32 (42.7%) | 48 (23.3%) |
| 75 Years and over | 85 (57.1%) | 88 (75.2%) |
Disability Class by Sex by Age in Long Beach
Disability Class: Hearing Difficulty
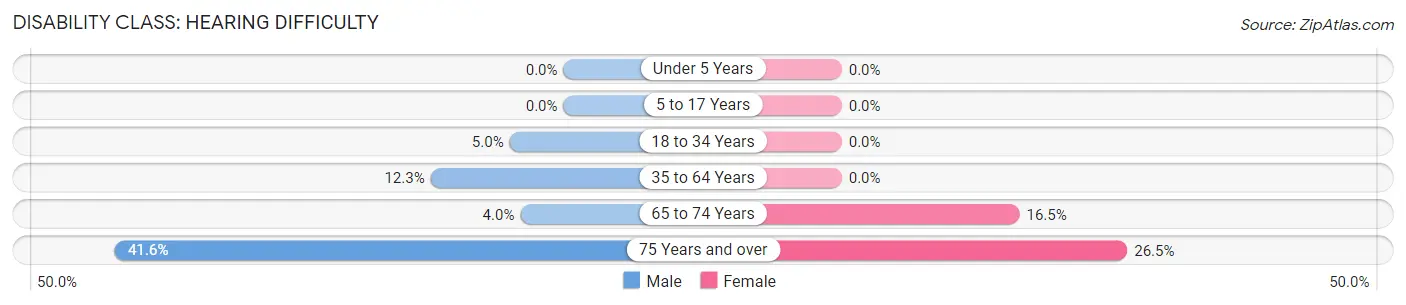
| Age Bracket | Male | Female |
| Under 5 Years | 0 (0.0%) | 0 (0.0%) |
| 5 to 17 Years | 0 (0.0%) | 0 (0.0%) |
| 18 to 34 Years | 9 (5.0%) | 0 (0.0%) |
| 35 to 64 Years | 37 (12.3%) | 0 (0.0%) |
| 65 to 74 Years | 3 (4.0%) | 34 (16.5%) |
| 75 Years and over | 62 (41.6%) | 31 (26.5%) |
Disability Class: Vision Difficulty
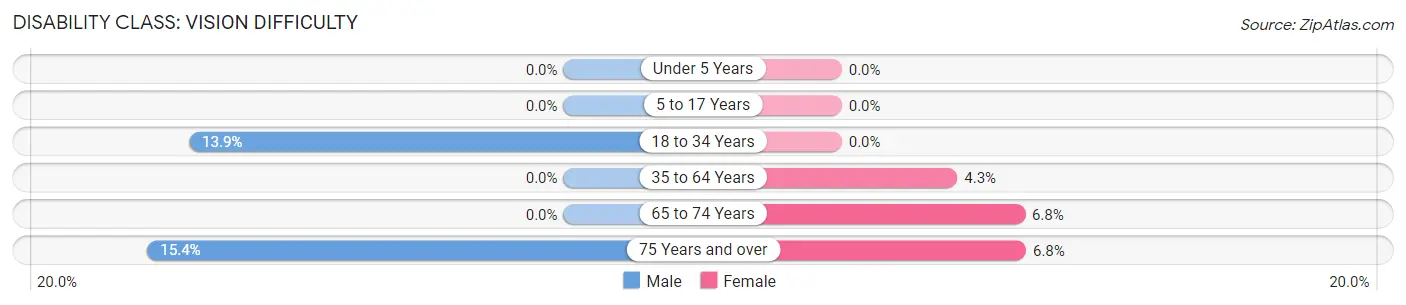
| Age Bracket | Male | Female |
| Under 5 Years | 0 (0.0%) | 0 (0.0%) |
| 5 to 17 Years | 0 (0.0%) | 0 (0.0%) |
| 18 to 34 Years | 25 (13.9%) | 0 (0.0%) |
| 35 to 64 Years | 0 (0.0%) | 13 (4.3%) |
| 65 to 74 Years | 0 (0.0%) | 14 (6.8%) |
| 75 Years and over | 23 (15.4%) | 8 (6.8%) |
Disability Class: Cognitive Difficulty
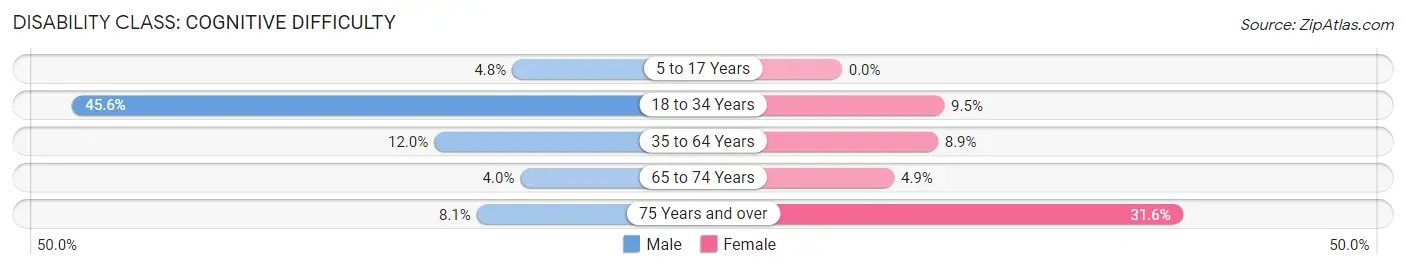
| Age Bracket | Male | Female |
| 5 to 17 Years | 4 (4.8%) | 0 (0.0%) |
| 18 to 34 Years | 82 (45.6%) | 21 (9.5%) |
| 35 to 64 Years | 36 (12.0%) | 27 (8.9%) |
| 65 to 74 Years | 3 (4.0%) | 10 (4.9%) |
| 75 Years and over | 12 (8.1%) | 37 (31.6%) |
Disability Class: Ambulatory Difficulty
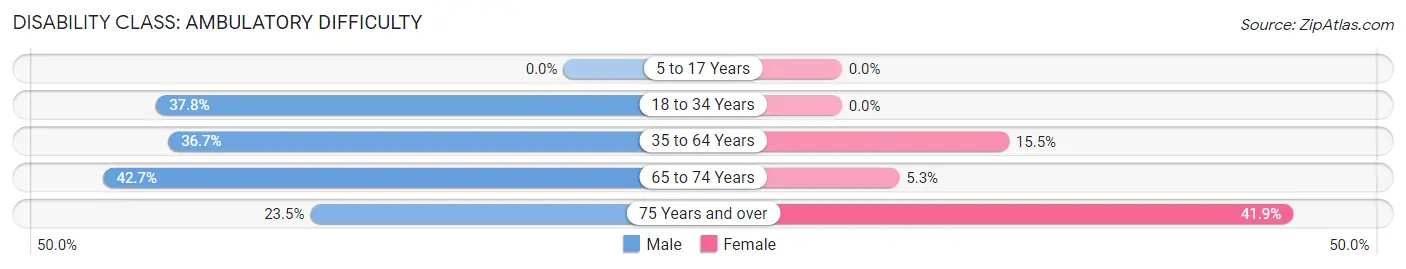
| Age Bracket | Male | Female |
| 5 to 17 Years | 0 (0.0%) | 0 (0.0%) |
| 18 to 34 Years | 68 (37.8%) | 0 (0.0%) |
| 35 to 64 Years | 110 (36.7%) | 47 (15.5%) |
| 65 to 74 Years | 32 (42.7%) | 11 (5.3%) |
| 75 Years and over | 35 (23.5%) | 49 (41.9%) |
Disability Class: Self-Care Difficulty
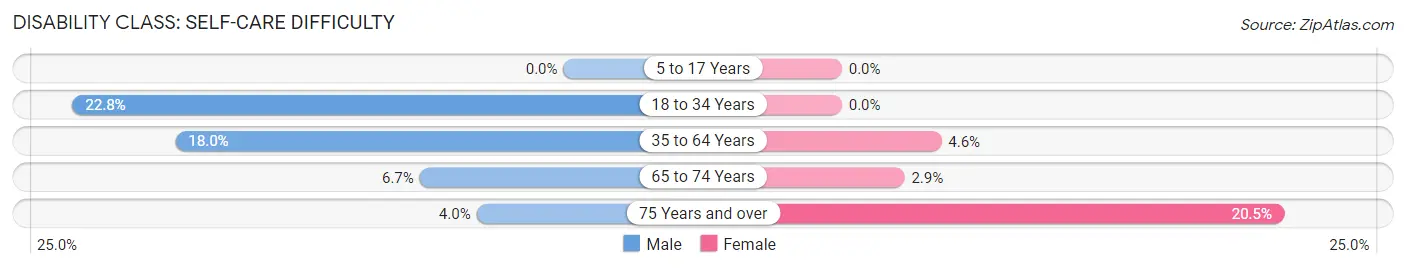
| Age Bracket | Male | Female |
| 5 to 17 Years | 0 (0.0%) | 0 (0.0%) |
| 18 to 34 Years | 41 (22.8%) | 0 (0.0%) |
| 35 to 64 Years | 54 (18.0%) | 14 (4.6%) |
| 65 to 74 Years | 5 (6.7%) | 6 (2.9%) |
| 75 Years and over | 6 (4.0%) | 24 (20.5%) |
Technology Access in Long Beach
Computing Device Access in Long Beach
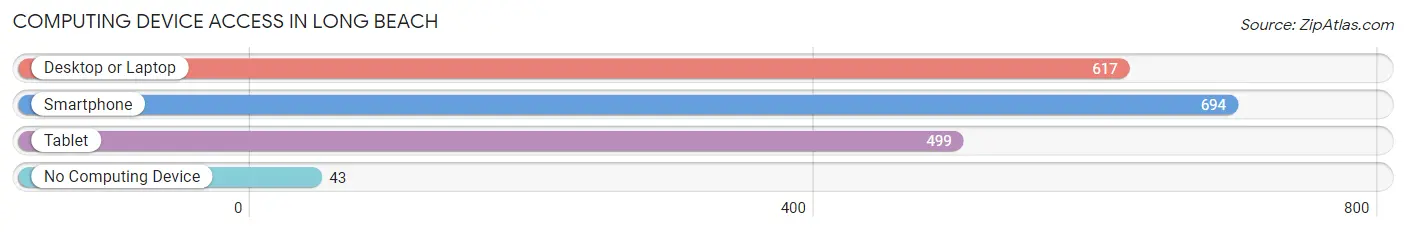
| Device Type | # Households | % Households |
| Desktop or Laptop | 617 | 73.4% |
| Smartphone | 694 | 82.5% |
| Tablet | 499 | 59.3% |
| No Computing Device | 43 | 5.1% |
| Total | 841 | 100.0% |
Internet Access in Long Beach
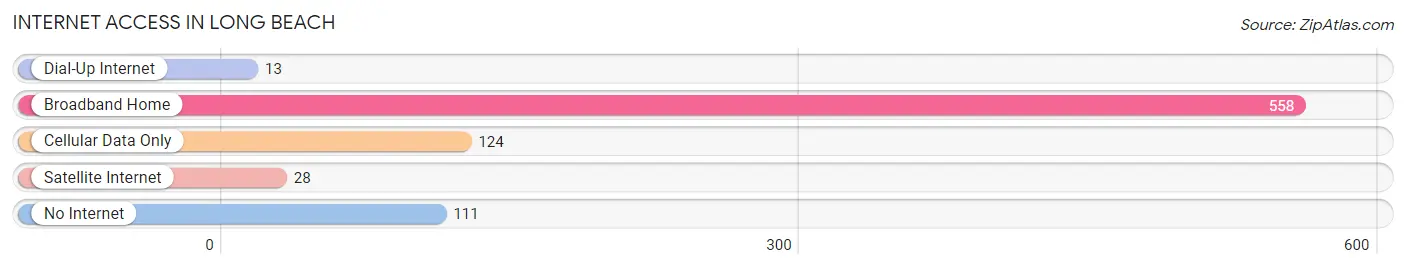
| Internet Type | # Households | % Households |
| Dial-Up Internet | 13 | 1.5% |
| Broadband Home | 558 | 66.3% |
| Cellular Data Only | 124 | 14.7% |
| Satellite Internet | 28 | 3.3% |
| No Internet | 111 | 13.2% |
| Total | 841 | 100.0% |
Long Beach Summary
Long Beach is a city located in Pacific County, Washington, United States. It is situated on the Long Beach Peninsula, a narrow strip of land that separates Willapa Bay from the Pacific Ocean. The city is known for its long, sandy beaches, which attract tourists from all over the world. The city is also home to a variety of attractions, including the World Kite Museum and the Long Beach Boardwalk.
History
Long Beach was first settled in the late 1800s by settlers from the Midwest. The first settlers were attracted to the area by the abundance of timber and the potential for fishing and farming. The first post office was established in 1891, and the town was officially incorporated in 1909.
The city was named after the long, sandy beaches that stretch along the peninsula. The beaches were a popular destination for tourists, and the city quickly became a popular summer resort. In the early 1900s, the city was home to a variety of businesses, including hotels, restaurants, and stores.
Geography
Long Beach is located on the Long Beach Peninsula, a narrow strip of land that separates Willapa Bay from the Pacific Ocean. The city is bordered by the cities of Ocean Park to the north, Ilwaco to the south, and Naselle to the east. The city covers an area of 8.3 square miles, and has a population of approximately 3,000 people.
The city is situated on a flat, sandy plain, and is surrounded by wetlands and marshes. The city is home to a variety of wildlife, including bald eagles, ospreys, and herons. The city is also home to a variety of plant life, including Douglas fir, western hemlock, and western red cedar.
Economy
The economy of Long Beach is largely based on tourism. The city is home to a variety of attractions, including the World Kite Museum and the Long Beach Boardwalk. The city is also home to a variety of restaurants, shops, and hotels.
The city is also home to a variety of industries, including fishing, logging, and farming. The city is home to a number of seafood processing plants, and is a major producer of oysters, clams, and other shellfish. The city is also home to a number of timber mills, and is a major producer of lumber.
Demographics
As of the 2010 census, the population of Long Beach was 2,992. The racial makeup of the city was 94.3% White, 0.7% African American, 0.7% Native American, 0.7% Asian, 0.2% Pacific Islander, 0.7% from other races, and 2.5% from two or more races. Hispanic or Latino of any race were 3.2% of the population.
The median income for a household in the city was $37,917, and the median income for a family was $45,000. The per capita income for the city was $20,945. About 11.2% of families and 14.2% of the population were below the poverty line, including 18.2% of those under age 18 and 8.3% of those age 65 or over.
Common Questions
What is Per Capita Income in Long Beach?
Per Capita income in Long Beach is $28,188.
What is the Median Family Income in Long Beach?
Median Family Income in Long Beach is $70,096.
What is the Median Household income in Long Beach?
Median Household Income in Long Beach is $47,188.
What is Inequality or Gini Index in Long Beach?
Inequality or Gini Index in Long Beach is 0.42.
What is the Total Population of Long Beach?
Total Population of Long Beach is 1,831.
What is the Total Male Population of Long Beach?
Total Male Population of Long Beach is 809.
What is the Total Female Population of Long Beach?
Total Female Population of Long Beach is 1,022.
What is the Ratio of Males per 100 Females in Long Beach?
There are 79.16 Males per 100 Females in Long Beach.
What is the Ratio of Females per 100 Males in Long Beach?
There are 126.33 Females per 100 Males in Long Beach.
What is the Median Population Age in Long Beach?
Median Population Age in Long Beach is 51.3 Years.
What is the Average Family Size in Long Beach
Average Family Size in Long Beach is 2.9 People.
What is the Average Household Size in Long Beach
Average Household Size in Long Beach is 2.2 People.
How Large is the Labor Force in Long Beach?
There are 618 People in the Labor Forcein in Long Beach.
What is the Percentage of People in the Labor Force in Long Beach?
38.2% of People are in the Labor Force in Long Beach.