Cities with the Highest Poverty Level Among Married Couples in Washington
RELATED REPORTS & OPTIONS
Highest Poverty | Married Couple
Washington
Compare Cities
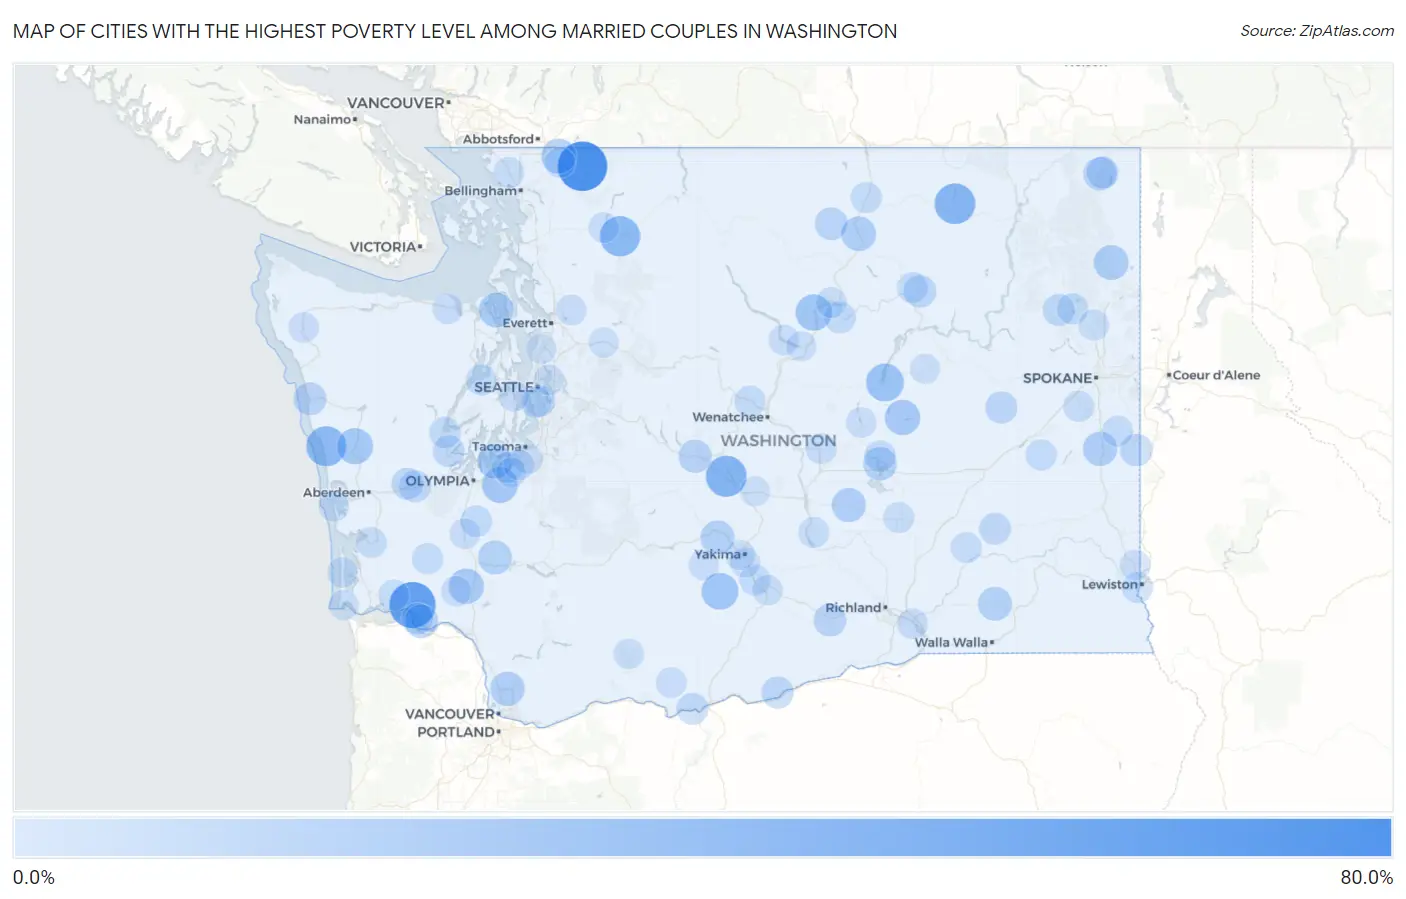
Map of Cities with the Highest Poverty Level Among Married Couples in Washington
0.0%
80.0%
Cities with the Highest Poverty Level Among Married Couples in Washington
| City | Married Couples Poverty | vs State | vs National | |
| 1. | Glacier | 73.3% | 3.3%(+70.0)#1 | 4.5%(+68.9)#154 |
| 2. | Skamokawa Valley | 61.5% | 3.3%(+58.3)#2 | 4.5%(+57.1)#247 |
| 3. | Thorp | 43.5% | 3.3%(+40.2)#3 | 4.5%(+39.0)#527 |
| 4. | Torboy | 42.9% | 3.3%(+39.6)#4 | 4.5%(+38.4)#537 |
| 5. | Rockport | 41.2% | 3.3%(+37.9)#5 | 4.5%(+36.7)#589 |
| 6. | Qui Nai Elt Village | 40.0% | 3.3%(+36.7)#6 | 4.5%(+35.5)#632 |
| 7. | Banks Lake South | 32.6% | 3.3%(+29.3)#7 | 4.5%(+28.1)#919 |
| 8. | White Swan | 29.4% | 3.3%(+26.1)#8 | 4.5%(+24.9)#1,060 |
| 9. | Pateros | 28.2% | 3.3%(+25.0)#9 | 4.5%(+23.8)#1,140 |
| 10. | Humptulips | 27.1% | 3.3%(+23.8)#10 | 4.5%(+22.6)#1,238 |
| 11. | Nisqually Indian Community | 26.4% | 3.3%(+23.2)#11 | 4.5%(+22.0)#1,292 |
| 12. | Wilson Creek | 25.0% | 3.3%(+21.7)#12 | 4.5%(+20.5)#1,430 |
| 13. | Vader | 24.8% | 3.3%(+21.6)#13 | 4.5%(+20.4)#1,468 |
| 14. | Peaceful Valley | 23.6% | 3.3%(+20.3)#14 | 4.5%(+19.2)#1,590 |
| 15. | Marrowstone | 23.2% | 3.3%(+19.9)#15 | 4.5%(+18.8)#1,638 |
| 16. | Anderson Island | 23.0% | 3.3%(+19.7)#16 | 4.5%(+18.5)#1,666 |
| 17. | Cusick | 22.9% | 3.3%(+19.6)#17 | 4.5%(+18.4)#1,680 |
| 18. | Riverside | 22.2% | 3.3%(+18.9)#18 | 4.5%(+17.8)#1,749 |
| 19. | Rosalia | 21.6% | 3.3%(+18.3)#19 | 4.5%(+17.1)#1,845 |
| 20. | Dollars Corner | 21.4% | 3.3%(+18.1)#20 | 4.5%(+17.0)#1,861 |
| 21. | Royal City | 20.7% | 3.3%(+17.4)#21 | 4.5%(+16.2)#1,954 |
| 22. | Tieton | 20.3% | 3.3%(+17.0)#22 | 4.5%(+15.8)#2,004 |
| 23. | Onalaska | 20.0% | 3.3%(+16.7)#23 | 4.5%(+15.5)#2,034 |
| 24. | Prescott | 20.0% | 3.3%(+16.7)#24 | 4.5%(+15.5)#2,045 |
| 25. | East Cathlamet | 19.2% | 3.3%(+15.9)#25 | 4.5%(+14.7)#2,181 |
| 26. | Cascade Valley | 18.8% | 3.3%(+15.5)#26 | 4.5%(+14.3)#2,246 |
| 27. | Metaline | 18.2% | 3.3%(+14.9)#27 | 4.5%(+13.7)#2,368 |
| 28. | South Cle Elum | 17.6% | 3.3%(+14.3)#28 | 4.5%(+13.1)#2,496 |
| 29. | Queets | 16.7% | 3.3%(+13.4)#29 | 4.5%(+12.2)#2,698 |
| 30. | Prosser | 16.7% | 3.3%(+13.4)#30 | 4.5%(+12.2)#2,714 |
| 31. | Conconully | 16.3% | 3.3%(+13.0)#31 | 4.5%(+11.9)#2,767 |
| 32. | Nespelem | 15.8% | 3.3%(+12.5)#32 | 4.5%(+11.3)#2,899 |
| 33. | Tekoa | 14.9% | 3.3%(+11.6)#33 | 4.5%(+10.5)#3,108 |
| 34. | Harrington | 14.3% | 3.3%(+11.0)#34 | 4.5%(+9.82)#3,292 |
| 35. | Roosevelt | 14.3% | 3.3%(+11.0)#35 | 4.5%(+9.82)#3,306 |
| 36. | Elma | 14.0% | 3.3%(+10.7)#36 | 4.5%(+9.56)#3,396 |
| 37. | Metaline Falls | 13.7% | 3.3%(+10.4)#37 | 4.5%(+9.26)#3,481 |
| 38. | Springdale | 13.6% | 3.3%(+10.3)#38 | 4.5%(+9.10)#3,531 |
| 39. | Washtucna | 13.5% | 3.3%(+10.2)#39 | 4.5%(+9.05)#3,557 |
| 40. | Satsop | 13.4% | 3.3%(+10.1)#40 | 4.5%(+8.91)#3,602 |
| 41. | Wishram | 13.3% | 3.3%(+10.0)#41 | 4.5%(+8.87)#3,612 |
| 42. | Shelton | 13.2% | 3.3%(+9.94)#42 | 4.5%(+8.76)#3,658 |
| 43. | Bridgeport | 13.0% | 3.3%(+9.71)#43 | 4.5%(+8.53)#3,758 |
| 44. | Skokomish | 12.7% | 3.3%(+9.41)#44 | 4.5%(+8.24)#3,853 |
| 45. | Bucoda | 12.5% | 3.3%(+9.22)#45 | 4.5%(+8.04)#3,926 |
| 46. | Cathlamet | 12.3% | 3.3%(+9.01)#46 | 4.5%(+7.83)#4,034 |
| 47. | Moses Lake North | 12.0% | 3.3%(+8.73)#47 | 4.5%(+7.56)#4,161 |
| 48. | Loon Lake | 11.6% | 3.3%(+8.32)#48 | 4.5%(+7.14)#4,364 |
| 49. | Cashmere | 11.5% | 3.3%(+8.21)#49 | 4.5%(+7.03)#4,410 |
| 50. | North Fort Lewis | 11.4% | 3.3%(+8.16)#50 | 4.5%(+6.98)#4,424 |
| 51. | Wapato | 11.2% | 3.3%(+7.93)#51 | 4.5%(+6.75)#4,529 |
| 52. | West Clarkston Highland | 11.1% | 3.3%(+7.83)#52 | 4.5%(+6.65)#4,553 |
| 53. | Tonasket | 11.1% | 3.3%(+7.83)#53 | 4.5%(+6.65)#4,557 |
| 54. | Pe Ell | 11.1% | 3.3%(+7.83)#54 | 4.5%(+6.65)#4,568 |
| 55. | Nespelem Community | 11.1% | 3.3%(+7.83)#55 | 4.5%(+6.65)#4,577 |
| 56. | Lamont | 11.1% | 3.3%(+7.83)#56 | 4.5%(+6.65)#4,596 |
| 57. | Boulevard Park | 11.0% | 3.3%(+7.67)#57 | 4.5%(+6.49)#4,678 |
| 58. | Seabeck | 10.9% | 3.3%(+7.59)#58 | 4.5%(+6.41)#4,728 |
| 59. | Waverly | 10.9% | 3.3%(+7.59)#59 | 4.5%(+6.41)#4,733 |
| 60. | Othello | 10.7% | 3.3%(+7.44)#60 | 4.5%(+6.26)#4,792 |
| 61. | Kahlotus | 10.7% | 3.3%(+7.43)#61 | 4.5%(+6.25)#4,814 |
| 62. | Cheney | 10.6% | 3.3%(+7.34)#62 | 4.5%(+6.17)#4,866 |
| 63. | South Bend | 10.6% | 3.3%(+7.33)#63 | 4.5%(+6.15)#4,879 |
| 64. | Ferndale | 10.5% | 3.3%(+7.20)#64 | 4.5%(+6.03)#4,953 |
| 65. | Deer Park | 10.4% | 3.3%(+7.13)#65 | 4.5%(+5.96)#4,996 |
| 66. | White Center | 10.4% | 3.3%(+7.12)#66 | 4.5%(+5.94)#5,011 |
| 67. | Quincy | 10.2% | 3.3%(+6.96)#67 | 4.5%(+5.79)#5,100 |
| 68. | Brewster | 10.0% | 3.3%(+6.76)#68 | 4.5%(+5.58)#5,209 |
| 69. | Grays River | 10.0% | 3.3%(+6.72)#69 | 4.5%(+5.54)#5,252 |
| 70. | Mattawa | 9.9% | 3.3%(+6.62)#70 | 4.5%(+5.45)#5,321 |
| 71. | Finley | 9.9% | 3.3%(+6.57)#71 | 4.5%(+5.40)#5,354 |
| 72. | Lochsloy | 9.7% | 3.3%(+6.42)#72 | 4.5%(+5.24)#5,456 |
| 73. | Klickitat | 9.6% | 3.3%(+6.30)#73 | 4.5%(+5.13)#5,518 |
| 74. | Tampico | 9.6% | 3.3%(+6.29)#74 | 4.5%(+5.11)#5,527 |
| 75. | River Road | 9.4% | 3.3%(+6.13)#75 | 4.5%(+4.95)#5,641 |
| 76. | Manson | 9.4% | 3.3%(+6.11)#76 | 4.5%(+4.94)#5,650 |
| 77. | Toppenish | 9.4% | 3.3%(+6.11)#77 | 4.5%(+4.93)#5,656 |
| 78. | Manchester | 9.3% | 3.3%(+6.04)#78 | 4.5%(+4.86)#5,696 |
| 79. | Hunts Point | 9.3% | 3.3%(+5.99)#79 | 4.5%(+4.82)#5,731 |
| 80. | Forks | 9.2% | 3.3%(+5.97)#80 | 4.5%(+4.79)#5,757 |
| 81. | Kendall | 9.2% | 3.3%(+5.95)#81 | 4.5%(+4.78)#5,764 |
| 82. | Midland | 9.2% | 3.3%(+5.95)#82 | 4.5%(+4.77)#5,770 |
| 83. | Centralia | 9.2% | 3.3%(+5.91)#83 | 4.5%(+4.73)#5,799 |
| 84. | Westport | 9.1% | 3.3%(+5.81)#84 | 4.5%(+4.63)#5,865 |
| 85. | Concrete | 9.1% | 3.3%(+5.81)#85 | 4.5%(+4.63)#5,874 |
| 86. | Ryderwood | 9.0% | 3.3%(+5.74)#86 | 4.5%(+4.57)#5,964 |
| 87. | Union Gap | 9.0% | 3.3%(+5.74)#87 | 4.5%(+4.56)#5,965 |
| 88. | Mcchord Afb | 8.9% | 3.3%(+5.58)#88 | 4.5%(+4.41)#6,072 |
| 89. | Ocean Park | 8.8% | 3.3%(+5.51)#89 | 4.5%(+4.33)#6,127 |
| 90. | Uniontown | 8.7% | 3.3%(+5.47)#90 | 4.5%(+4.29)#6,159 |
| 91. | Trout Lake | 8.7% | 3.3%(+5.41)#91 | 4.5%(+4.23)#6,184 |
| 92. | Soap Lake | 8.7% | 3.3%(+5.39)#92 | 4.5%(+4.21)#6,218 |
| 93. | Startup | 8.5% | 3.3%(+5.26)#93 | 4.5%(+4.08)#6,295 |
| 94. | Fort Lewis | 8.5% | 3.3%(+5.17)#94 | 4.5%(+4.00)#6,354 |
| 95. | Yakima | 8.4% | 3.3%(+5.15)#95 | 4.5%(+3.97)#6,376 |
| 96. | Almira | 8.3% | 3.3%(+5.05)#96 | 4.5%(+3.87)#6,450 |
| 97. | Ilwaco | 8.3% | 3.3%(+5.01)#97 | 4.5%(+3.83)#6,507 |
| 98. | Lynnwood | 8.2% | 3.3%(+4.96)#98 | 4.5%(+3.78)#6,541 |
| 99. | Kittitas | 8.2% | 3.3%(+4.91)#99 | 4.5%(+3.73)#6,577 |
| 100. | Chelan | 8.1% | 3.3%(+4.81)#100 | 4.5%(+3.64)#6,673 |
Common Questions
What are the Top 10 Cities with the Highest Poverty Level Among Married Couples in Washington?
Top 10 Cities with the Highest Poverty Level Among Married Couples in Washington are:
#1
73.3%
#2
61.5%
#3
43.5%
#4
42.9%
#5
41.2%
#6
40.0%
#7
32.6%
#8
29.4%
#9
28.2%
#10
27.1%
What city has the Highest Poverty Level Among Married Couples in Washington?
Glacier has the Highest Poverty Level Among Married Couples in Washington with 73.3%.
What is the Poverty Level Among Married Couples in the State of Washington?
Poverty Level Among Married Couples in Washington is 3.3%.
What is the Poverty Level Among Married Couples in the United States?
Poverty Level Among Married Couples in the United States is 4.5%.