Stevenson, WA Map & Demographics
Stevenson Map
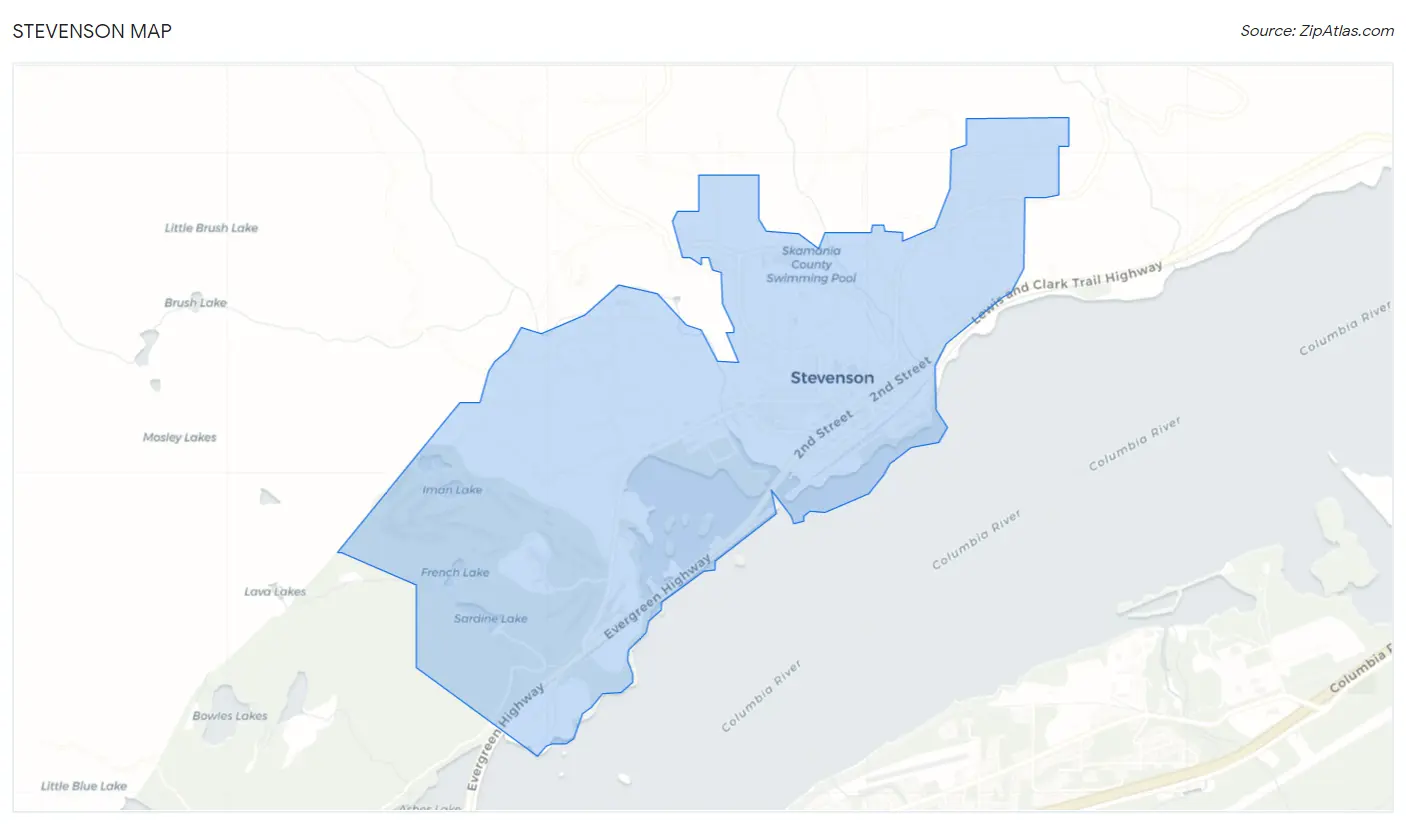
Stevenson Overview
$35,508
PER CAPITA INCOME
$96,979
AVG FAMILY INCOME
$84,000
AVG HOUSEHOLD INCOME
38.0%
WAGE / INCOME GAP [ % ]
62.0¢/ $1
WAGE / INCOME GAP [ $ ]
0.40
INEQUALITY / GINI INDEX
1,697
TOTAL POPULATION
842
MALE POPULATION
855
FEMALE POPULATION
98.48
MALES / 100 FEMALES
101.54
FEMALES / 100 MALES
42.6
MEDIAN AGE
3.0
AVG FAMILY SIZE
2.5
AVG HOUSEHOLD SIZE
740
LABOR FORCE [ PEOPLE ]
53.3%
PERCENT IN LABOR FORCE
2.7%
UNEMPLOYMENT RATE
Stevenson Zip Codes
Stevenson Area Codes
Income in Stevenson
Income Overview in Stevenson
Per Capita Income in Stevenson is $35,508, while median incomes of families and households are $96,979 and $84,000 respectively.
| Characteristic | Number | Measure |
| Per Capita Income | 1,697 | $35,508 |
| Median Family Income | 439 | $96,979 |
| Mean Family Income | 439 | $104,171 |
| Median Household Income | 648 | $84,000 |
| Mean Household Income | 648 | $91,320 |
| Income Deficit | 439 | $0 |
| Wage / Income Gap (%) | 1,697 | 37.99% |
| Wage / Income Gap ($) | 1,697 | 62.01¢ per $1 |
| Gini / Inequality Index | 1,697 | 0.40 |
Earnings by Sex in Stevenson
Average Earnings in Stevenson are $31,114, $36,042 for men and $22,350 for women, a difference of 38.0%.
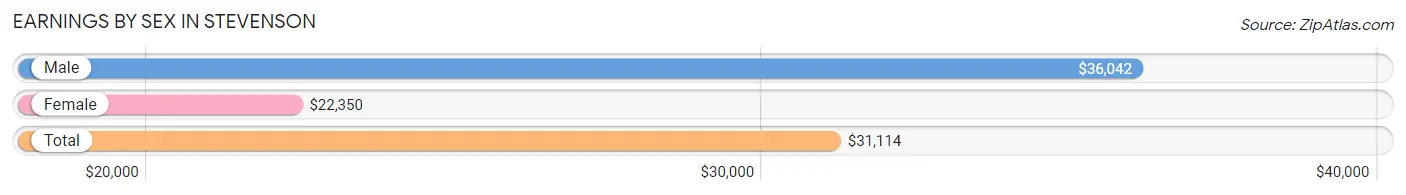
| Sex | Number | Average Earnings |
| Male | 516 (59.2%) | $36,042 |
| Female | 355 (40.8%) | $22,350 |
| Total | 871 (100.0%) | $31,114 |
Earnings by Sex by Income Bracket in Stevenson
The most common earnings brackets in Stevenson are $75,000 to $99,999 for men (93 | 18.0%) and $5,000 to $7,499 for women (68 | 19.2%).
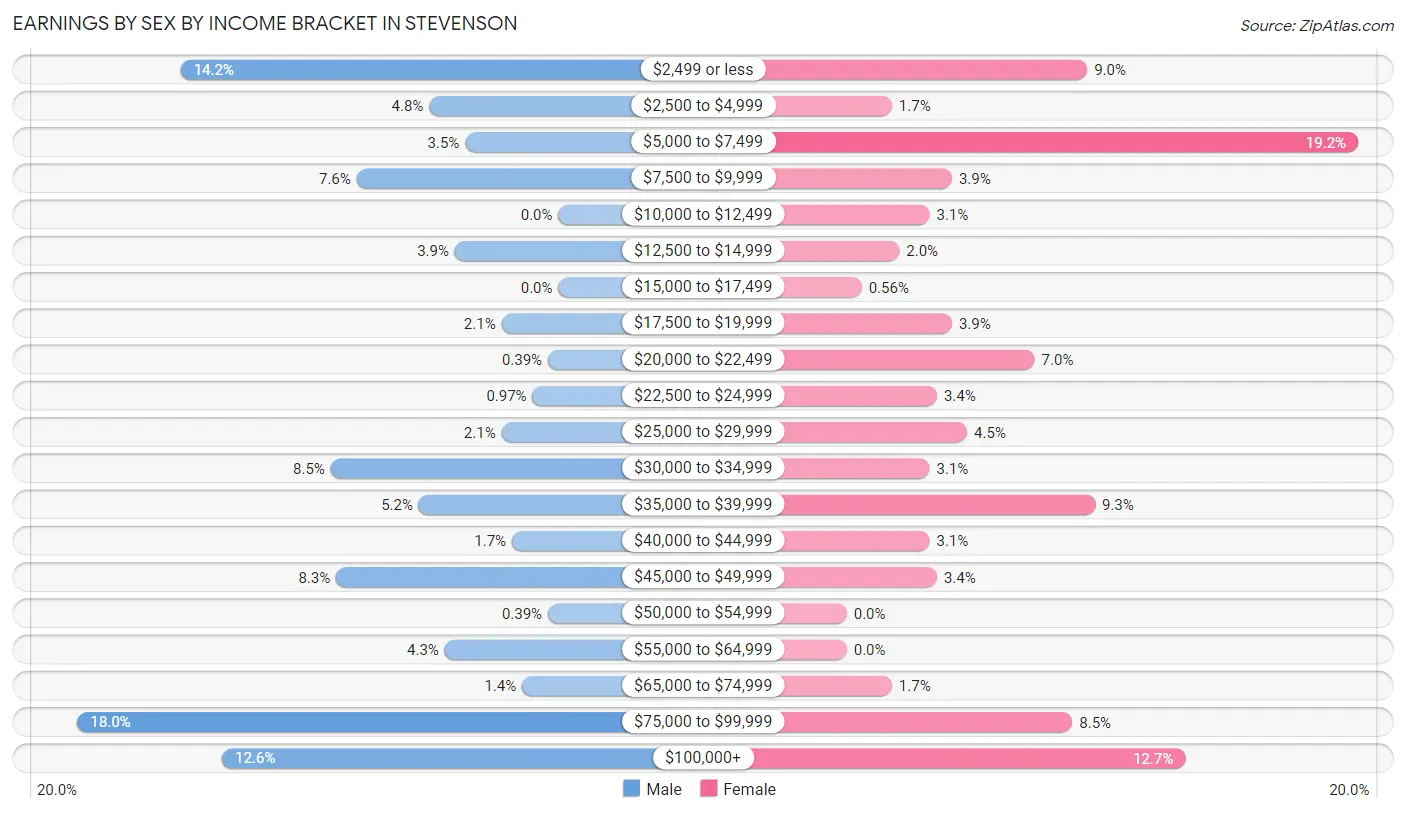
| Income | Male | Female |
| $2,499 or less | 73 (14.1%) | 32 (9.0%) |
| $2,500 to $4,999 | 25 (4.8%) | 6 (1.7%) |
| $5,000 to $7,499 | 18 (3.5%) | 68 (19.2%) |
| $7,500 to $9,999 | 39 (7.6%) | 14 (3.9%) |
| $10,000 to $12,499 | 0 (0.0%) | 11 (3.1%) |
| $12,500 to $14,999 | 20 (3.9%) | 7 (2.0%) |
| $15,000 to $17,499 | 0 (0.0%) | 2 (0.6%) |
| $17,500 to $19,999 | 11 (2.1%) | 14 (3.9%) |
| $20,000 to $22,499 | 2 (0.4%) | 25 (7.0%) |
| $22,500 to $24,999 | 5 (1.0%) | 12 (3.4%) |
| $25,000 to $29,999 | 11 (2.1%) | 16 (4.5%) |
| $30,000 to $34,999 | 44 (8.5%) | 11 (3.1%) |
| $35,000 to $39,999 | 27 (5.2%) | 33 (9.3%) |
| $40,000 to $44,999 | 9 (1.7%) | 11 (3.1%) |
| $45,000 to $49,999 | 43 (8.3%) | 12 (3.4%) |
| $50,000 to $54,999 | 2 (0.4%) | 0 (0.0%) |
| $55,000 to $64,999 | 22 (4.3%) | 0 (0.0%) |
| $65,000 to $74,999 | 7 (1.4%) | 6 (1.7%) |
| $75,000 to $99,999 | 93 (18.0%) | 30 (8.5%) |
| $100,000+ | 65 (12.6%) | 45 (12.7%) |
| Total | 516 (100.0%) | 355 (100.0%) |
Earnings by Sex by Educational Attainment in Stevenson
Average earnings in Stevenson are $49,688 for men and $22,708 for women, a difference of 54.3%. Men with an educational attainment of bachelor's degree enjoy the highest average annual earnings of $91,250, while those with high school diploma education earn the least with $35,250. Women with an educational attainment of graduate degree earn the most with the average annual earnings of $83,846, while those with high school diploma education have the smallest earnings of $21,000.
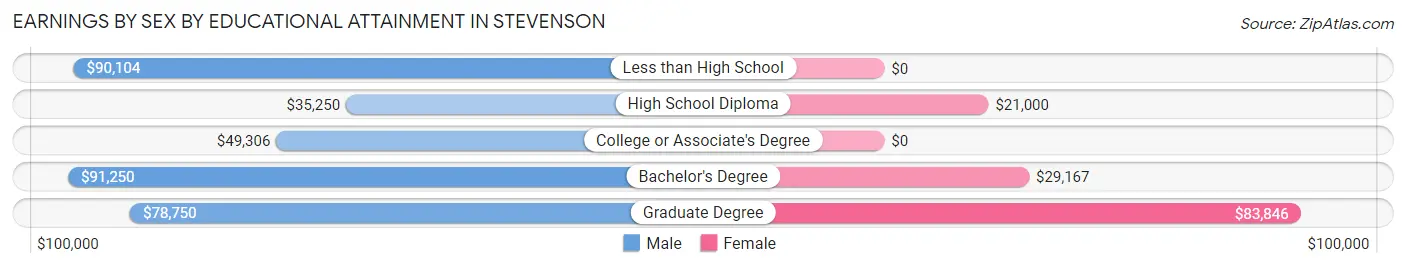
| Educational Attainment | Male Income | Female Income |
| Less than High School | $90,104 | $0 |
| High School Diploma | $35,250 | $21,000 |
| College or Associate's Degree | $49,306 | $0 |
| Bachelor's Degree | $91,250 | $29,167 |
| Graduate Degree | $78,750 | $83,846 |
| Total | $49,688 | $22,708 |
Family Income in Stevenson
Family Income Brackets in Stevenson
According to the Stevenson family income data, there are 129 families falling into the $100,000 to $149,999 income range, which is the most common income bracket and makes up 29.4% of all families. Conversely, the $10,000 to $14,999 income bracket is the least frequent group with only 7 families (1.6%) belonging to this category.
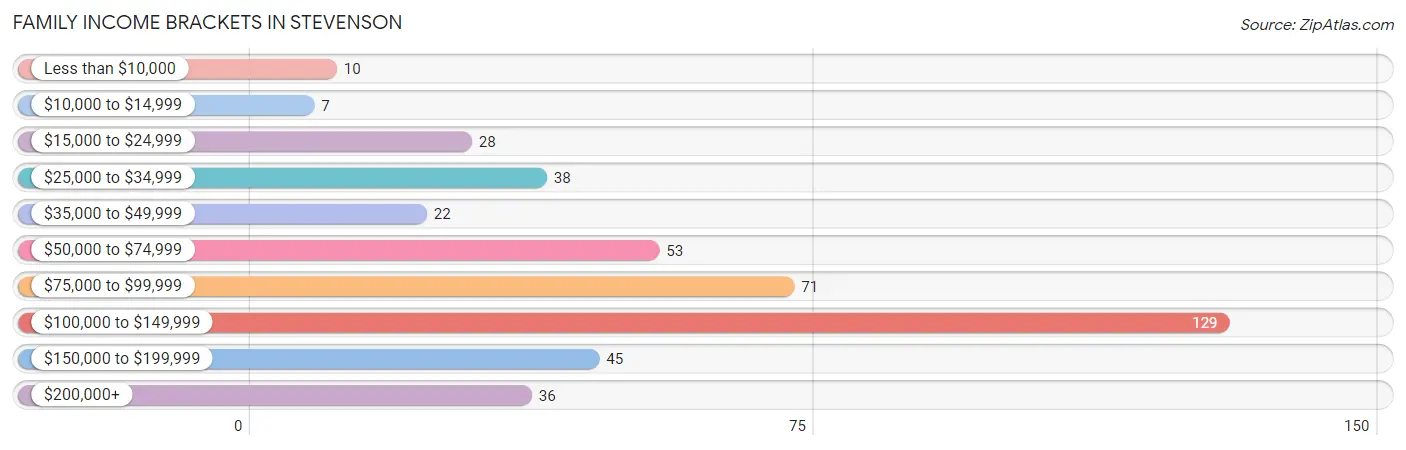
| Income Bracket | # Families | % Families |
| Less than $10,000 | 10 | 2.3% |
| $10,000 to $14,999 | 7 | 1.6% |
| $15,000 to $24,999 | 28 | 6.4% |
| $25,000 to $34,999 | 38 | 8.7% |
| $35,000 to $49,999 | 22 | 5.0% |
| $50,000 to $74,999 | 53 | 12.1% |
| $75,000 to $99,999 | 71 | 16.2% |
| $100,000 to $149,999 | 129 | 29.4% |
| $150,000 to $199,999 | 45 | 10.3% |
| $200,000+ | 36 | 8.2% |
Family Income by Famaliy Size in Stevenson
5-person families (37 | 8.4%) account for the highest median family income in Stevenson with $145,625 per family, while 2-person families (229 | 52.2%) have the highest median income of $39,688 per family member.
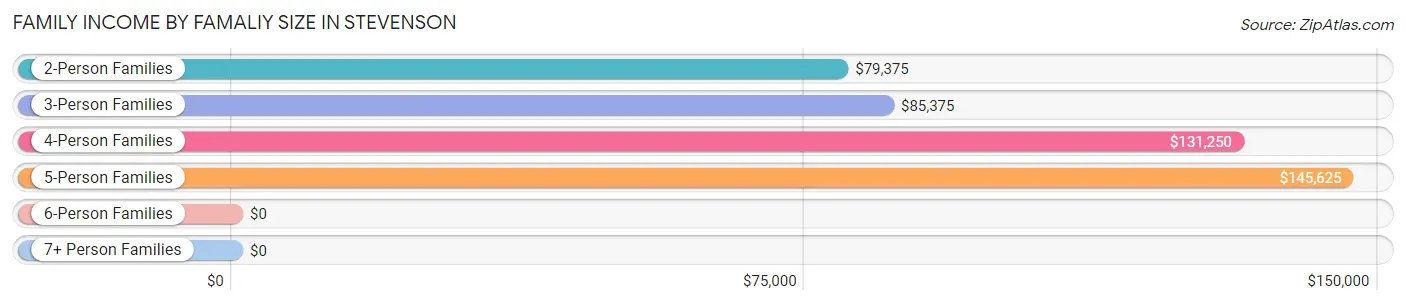
| Income Bracket | # Families | Median Income |
| 2-Person Families | 229 (52.2%) | $79,375 |
| 3-Person Families | 115 (26.2%) | $85,375 |
| 4-Person Families | 41 (9.3%) | $131,250 |
| 5-Person Families | 37 (8.4%) | $145,625 |
| 6-Person Families | 17 (3.9%) | $0 |
| 7+ Person Families | 0 (0.0%) | $0 |
| Total | 439 (100.0%) | $96,979 |
Family Income by Number of Earners in Stevenson
The median family income in Stevenson is $96,979, with families comprising 3+ earners (33) having the highest median family income of $131,250, while families with 1 earner (193) have the lowest median family income of $71,042, accounting for 7.5% and 44.0% of families, respectively.
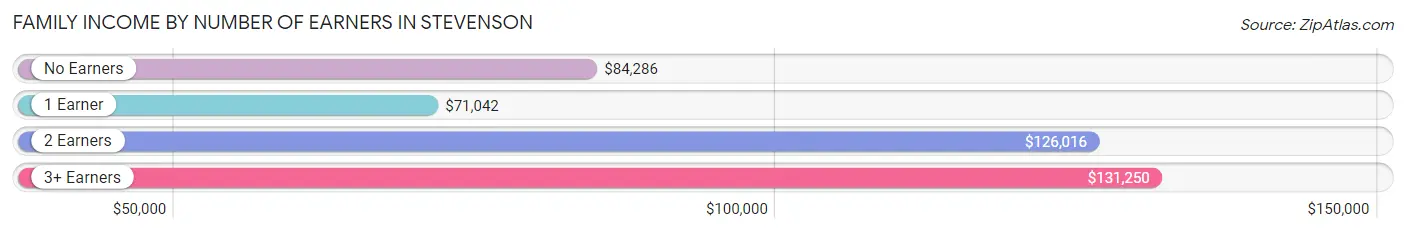
| Number of Earners | # Families | Median Income |
| No Earners | 72 (16.4%) | $84,286 |
| 1 Earner | 193 (44.0%) | $71,042 |
| 2 Earners | 141 (32.1%) | $126,016 |
| 3+ Earners | 33 (7.5%) | $131,250 |
| Total | 439 (100.0%) | $96,979 |
Household Income in Stevenson
Household Income Brackets in Stevenson
With 157 households falling in the category, the $100,000 to $149,999 income range is the most frequent in Stevenson, accounting for 24.2% of all households. In contrast, only 19 households (2.9%) fall into the $10,000 to $14,999 income bracket, making it the least populous group.
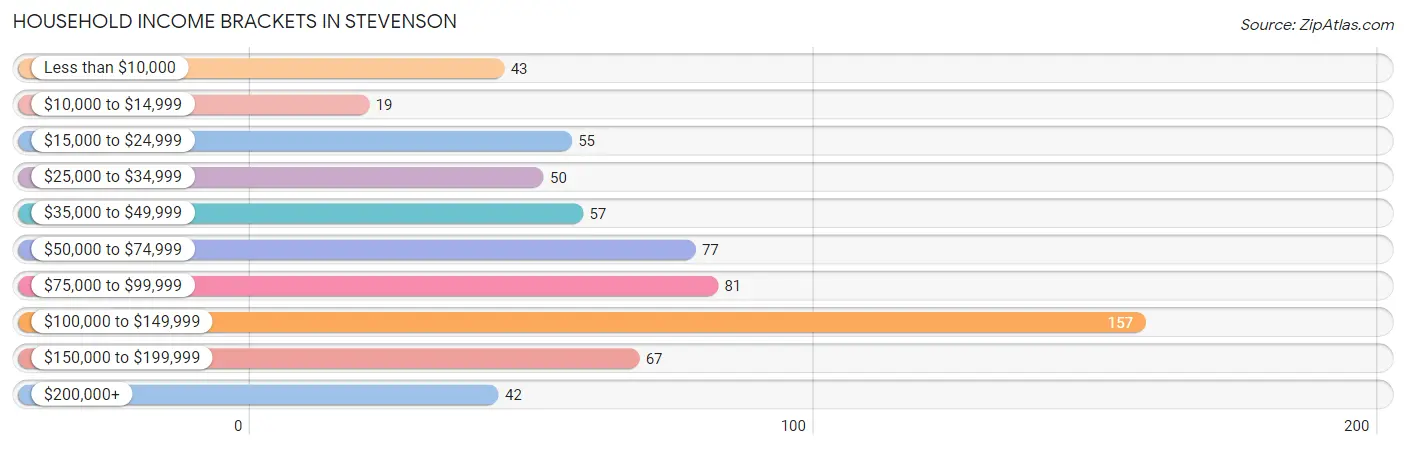
| Income Bracket | # Households | % Households |
| Less than $10,000 | 43 | 6.6% |
| $10,000 to $14,999 | 19 | 2.9% |
| $15,000 to $24,999 | 55 | 8.5% |
| $25,000 to $34,999 | 50 | 7.7% |
| $35,000 to $49,999 | 57 | 8.8% |
| $50,000 to $74,999 | 77 | 11.9% |
| $75,000 to $99,999 | 81 | 12.5% |
| $100,000 to $149,999 | 157 | 24.2% |
| $150,000 to $199,999 | 67 | 10.3% |
| $200,000+ | 42 | 6.5% |
Household Income by Householder Age in Stevenson
The median household income in Stevenson is $84,000, with the highest median household income of $124,861 found in the 45 to 64 years age bracket for the primary householder. A total of 213 households (32.9%) fall into this category. Meanwhile, the 15 to 24 years age bracket for the primary householder has the lowest median household income of $0, with 7 households (1.1%) in this group.
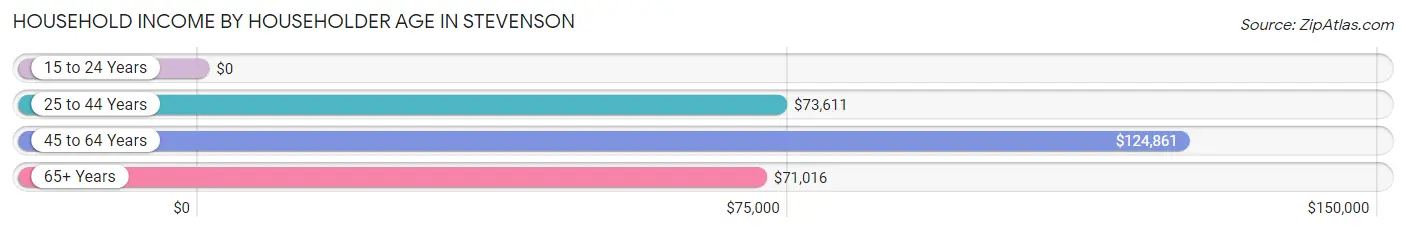
| Income Bracket | # Households | Median Income |
| 15 to 24 Years | 7 (1.1%) | $0 |
| 25 to 44 Years | 204 (31.5%) | $73,611 |
| 45 to 64 Years | 213 (32.9%) | $124,861 |
| 65+ Years | 224 (34.6%) | $71,016 |
| Total | 648 (100.0%) | $84,000 |
Poverty in Stevenson
Income Below Poverty by Sex and Age in Stevenson
With 9.1% poverty level for males and 10.6% for females among the residents of Stevenson, 5 year old males and 75 year old and over females are the most vulnerable to poverty, with 7 males (100.0%) and 16 females (31.4%) in their respective age groups living below the poverty level.
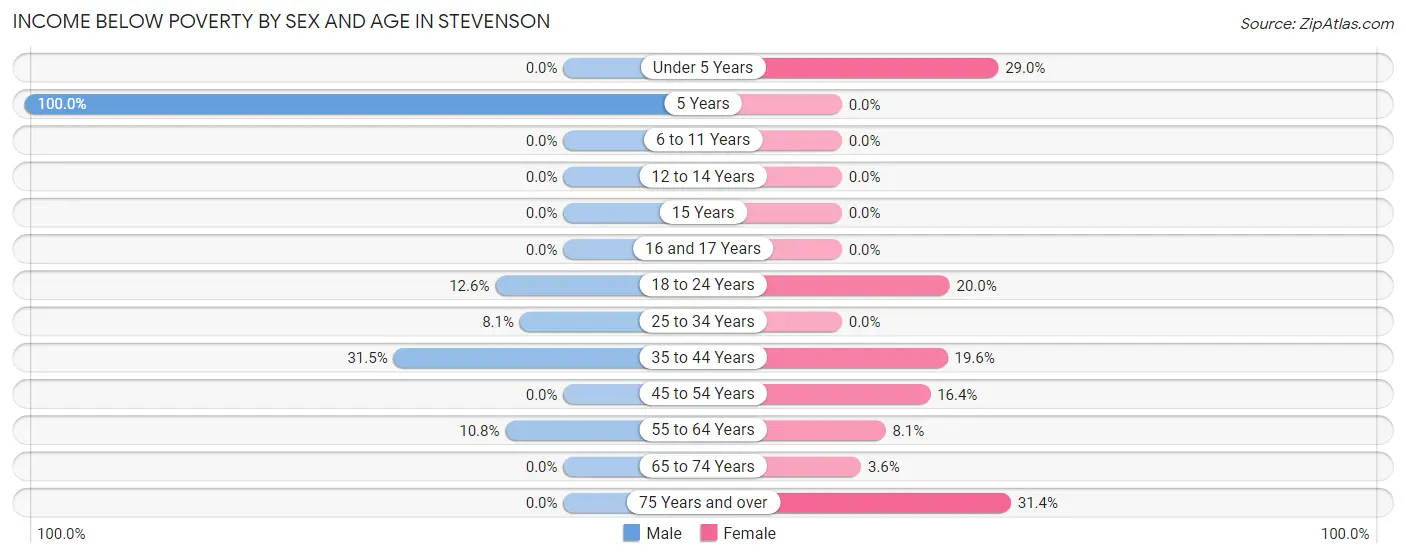
| Age Bracket | Male | Female |
| Under 5 Years | 0 (0.0%) | 9 (29.0%) |
| 5 Years | 7 (100.0%) | 0 (0.0%) |
| 6 to 11 Years | 0 (0.0%) | 0 (0.0%) |
| 12 to 14 Years | 0 (0.0%) | 0 (0.0%) |
| 15 Years | 0 (0.0%) | 0 (0.0%) |
| 16 and 17 Years | 0 (0.0%) | 0 (0.0%) |
| 18 to 24 Years | 11 (12.6%) | 7 (20.0%) |
| 25 to 34 Years | 8 (8.1%) | 0 (0.0%) |
| 35 to 44 Years | 35 (31.5%) | 21 (19.6%) |
| 45 to 54 Years | 0 (0.0%) | 21 (16.4%) |
| 55 to 64 Years | 11 (10.8%) | 9 (8.1%) |
| 65 to 74 Years | 0 (0.0%) | 6 (3.6%) |
| 75 Years and over | 0 (0.0%) | 16 (31.4%) |
| Total | 72 (9.1%) | 89 (10.6%) |
Income Above Poverty by Sex and Age in Stevenson
According to the poverty statistics in Stevenson, males aged under 5 years and females aged 5 years are the age groups that are most secure financially, with 100.0% of males and 100.0% of females in these age groups living above the poverty line.
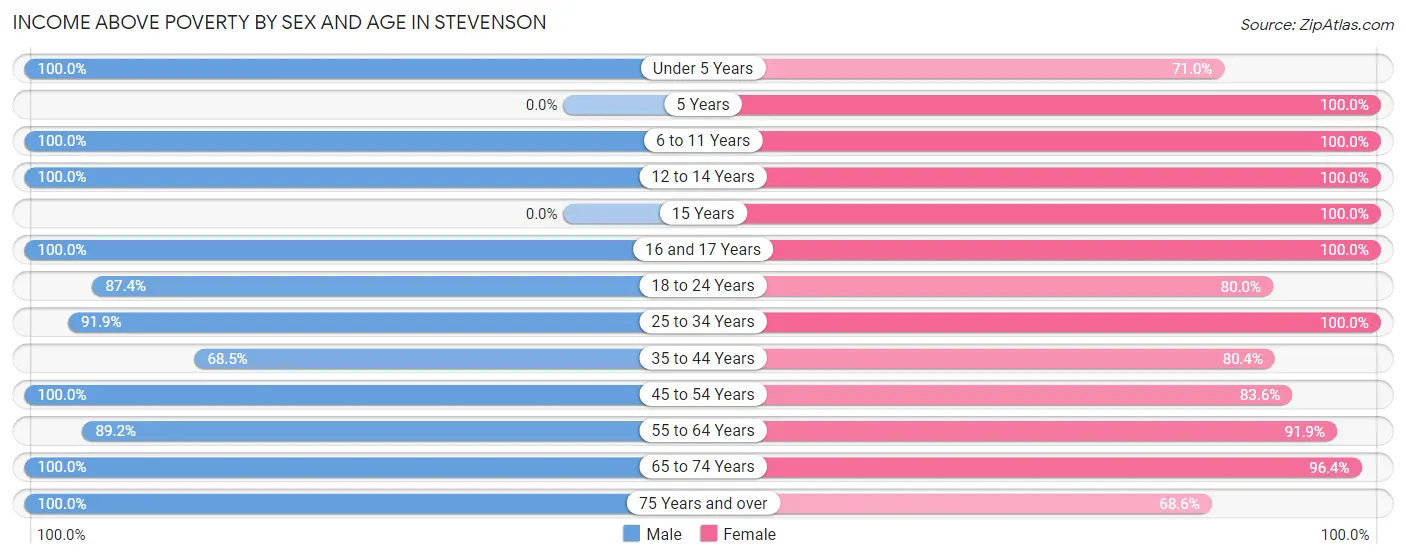
| Age Bracket | Male | Female |
| Under 5 Years | 22 (100.0%) | 22 (71.0%) |
| 5 Years | 0 (0.0%) | 15 (100.0%) |
| 6 to 11 Years | 47 (100.0%) | 116 (100.0%) |
| 12 to 14 Years | 28 (100.0%) | 7 (100.0%) |
| 15 Years | 0 (0.0%) | 22 (100.0%) |
| 16 and 17 Years | 41 (100.0%) | 14 (100.0%) |
| 18 to 24 Years | 76 (87.4%) | 28 (80.0%) |
| 25 to 34 Years | 91 (91.9%) | 36 (100.0%) |
| 35 to 44 Years | 76 (68.5%) | 86 (80.4%) |
| 45 to 54 Years | 68 (100.0%) | 107 (83.6%) |
| 55 to 64 Years | 91 (89.2%) | 102 (91.9%) |
| 65 to 74 Years | 135 (100.0%) | 162 (96.4%) |
| 75 Years and over | 47 (100.0%) | 35 (68.6%) |
| Total | 722 (90.9%) | 752 (89.4%) |
Income Below Poverty Among Married-Couple Families in Stevenson
The poverty statistics for married-couple families in Stevenson show that 7.5% or 24 of the total 321 families live below the poverty line. Families with 1 or 2 children have the highest poverty rate of 8.6%, comprising of 8 families. On the other hand, families with 3 or 4 children have the lowest poverty rate of 0.0%, which includes 0 families.
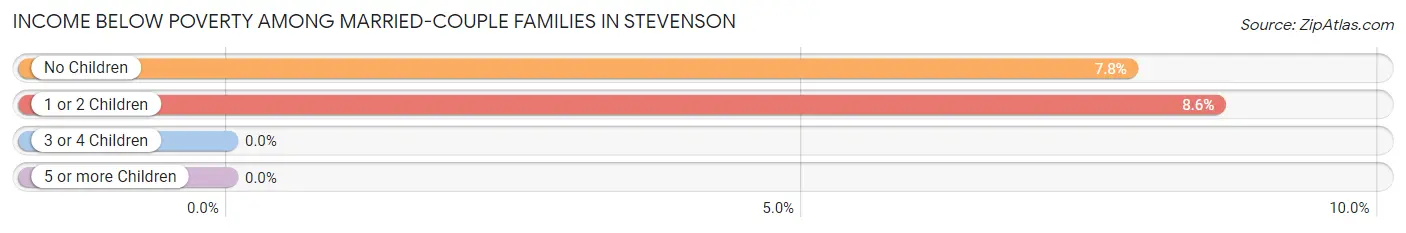
| Children | Above Poverty | Below Poverty |
| No Children | 188 (92.2%) | 16 (7.8%) |
| 1 or 2 Children | 85 (91.4%) | 8 (8.6%) |
| 3 or 4 Children | 24 (100.0%) | 0 (0.0%) |
| 5 or more Children | 0 (0.0%) | 0 (0.0%) |
| Total | 297 (92.5%) | 24 (7.5%) |
Income Below Poverty Among Single-Parent Households in Stevenson
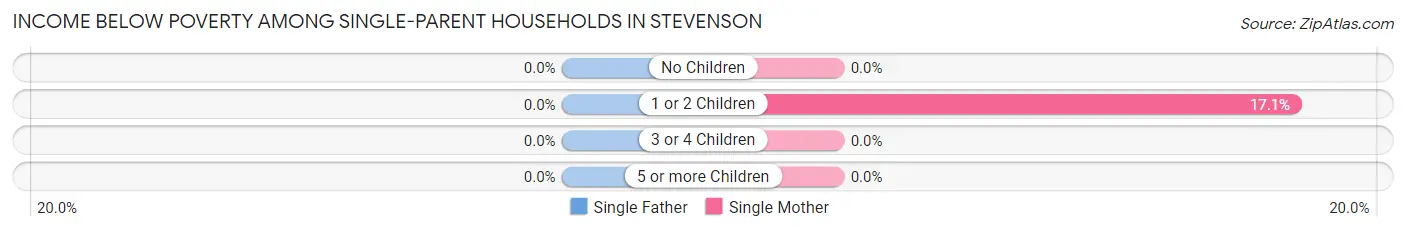
| Children | Single Father | Single Mother |
| No Children | 0 (0.0%) | 0 (0.0%) |
| 1 or 2 Children | 0 (0.0%) | 7 (17.1%) |
| 3 or 4 Children | 0 (0.0%) | 0 (0.0%) |
| 5 or more Children | 0 (0.0%) | 0 (0.0%) |
| Total | 0 (0.0%) | 7 (9.6%) |
Income Below Poverty Among Married-Couple vs Single-Parent Households in Stevenson
The poverty data for Stevenson shows that 24 of the married-couple family households (7.5%) and 7 of the single-parent households (5.9%) are living below the poverty level. Within the married-couple family households, those with 1 or 2 children have the highest poverty rate, with 8 households (8.6%) falling below the poverty line. Among the single-parent households, those with 1 or 2 children have the highest poverty rate, with 7 household (11.3%) living below poverty.
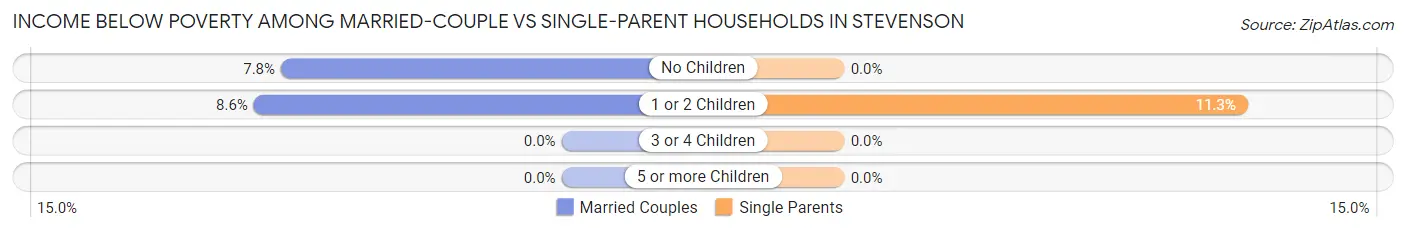
| Children | Married-Couple Families | Single-Parent Households |
| No Children | 16 (7.8%) | 0 (0.0%) |
| 1 or 2 Children | 8 (8.6%) | 7 (11.3%) |
| 3 or 4 Children | 0 (0.0%) | 0 (0.0%) |
| 5 or more Children | 0 (0.0%) | 0 (0.0%) |
| Total | 24 (7.5%) | 7 (5.9%) |
Race in Stevenson
The most populous races in Stevenson are White / Caucasian (1,455 | 85.7%), Hispanic or Latino (148 | 8.7%), and Some other Race (103 | 6.1%).
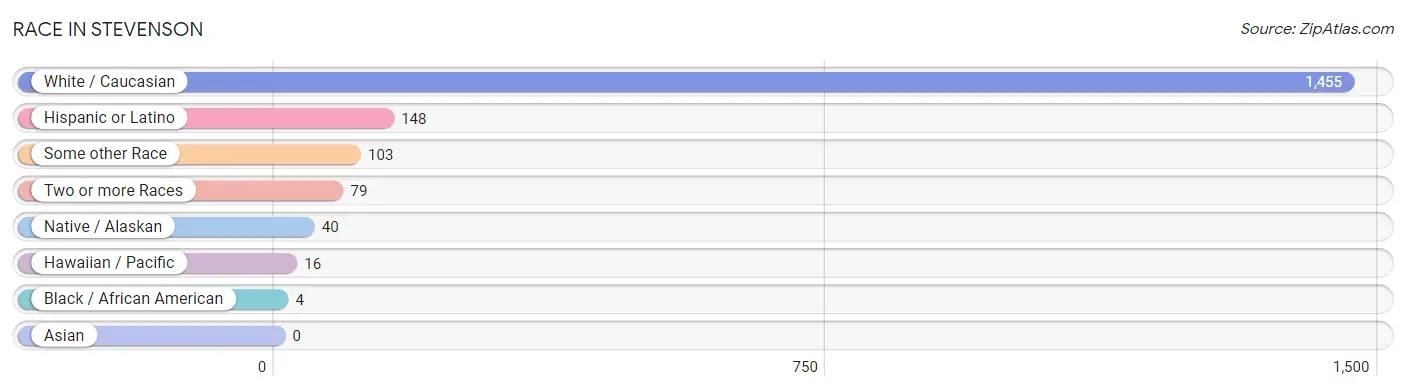
| Race | # Population | % Population |
| Asian | 0 | 0.0% |
| Black / African American | 4 | 0.2% |
| Hawaiian / Pacific | 16 | 0.9% |
| Hispanic or Latino | 148 | 8.7% |
| Native / Alaskan | 40 | 2.4% |
| White / Caucasian | 1,455 | 85.7% |
| Two or more Races | 79 | 4.7% |
| Some other Race | 103 | 6.1% |
| Total | 1,697 | 100.0% |
Ancestry in Stevenson
The most populous ancestries reported in Stevenson are German (357 | 21.0%), English (277 | 16.3%), Irish (219 | 12.9%), Mexican (148 | 8.7%), and American (117 | 6.9%), together accounting for 65.9% of all Stevenson residents.
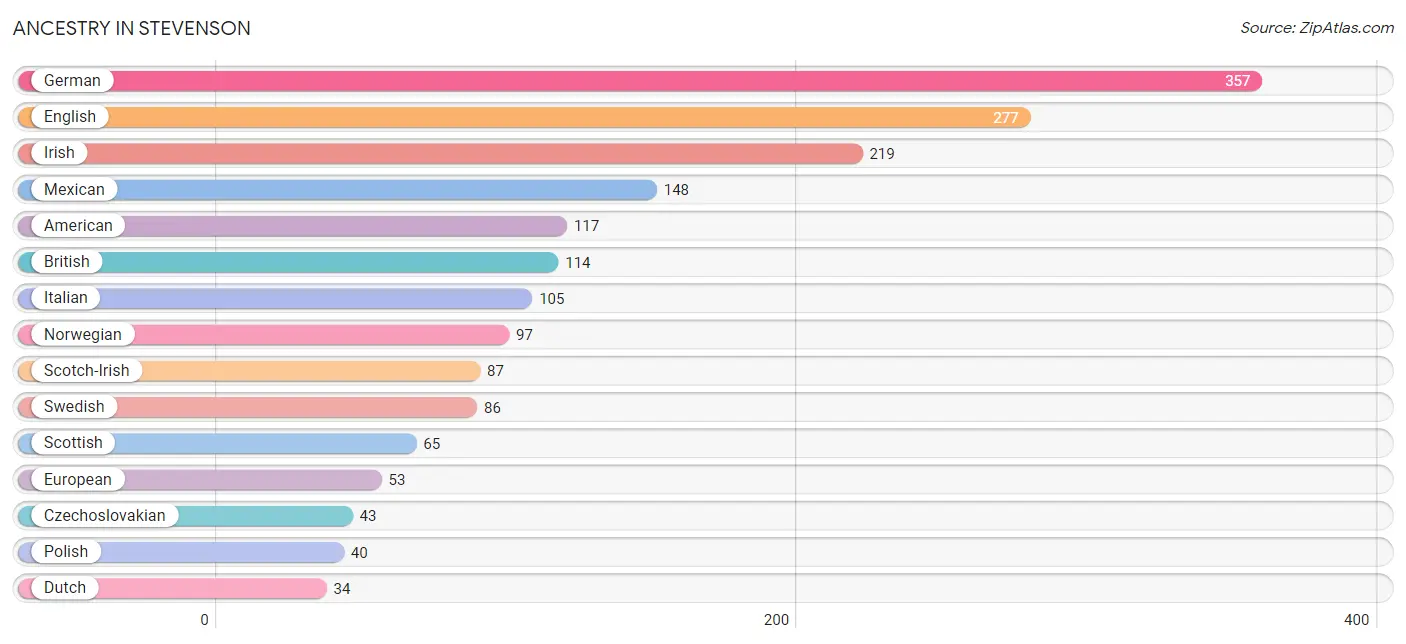
| Ancestry | # Population | % Population |
| American | 117 | 6.9% |
| Apache | 11 | 0.6% |
| Austrian | 14 | 0.8% |
| British | 114 | 6.7% |
| Cherokee | 18 | 1.1% |
| Cheyenne | 9 | 0.5% |
| Croatian | 19 | 1.1% |
| Czechoslovakian | 43 | 2.5% |
| Danish | 11 | 0.6% |
| Dutch | 34 | 2.0% |
| English | 277 | 16.3% |
| European | 53 | 3.1% |
| French | 20 | 1.2% |
| German | 357 | 21.0% |
| Hungarian | 6 | 0.4% |
| Irish | 219 | 12.9% |
| Italian | 105 | 6.2% |
| Lithuanian | 5 | 0.3% |
| Mexican | 148 | 8.7% |
| Mexican American Indian | 13 | 0.8% |
| Native Hawaiian | 9 | 0.5% |
| Northern European | 11 | 0.6% |
| Norwegian | 97 | 5.7% |
| Polish | 40 | 2.4% |
| Romanian | 16 | 0.9% |
| Scandinavian | 7 | 0.4% |
| Scotch-Irish | 87 | 5.1% |
| Scottish | 65 | 3.8% |
| Swedish | 86 | 5.1% |
| Swiss | 3 | 0.2% |
| Tlingit-Haida | 13 | 0.8% |
| Tongan | 14 | 0.8% |
| Ukrainian | 7 | 0.4% |
| Welsh | 6 | 0.4% |
| Yakama | 15 | 0.9% | View All 35 Rows |
Immigrants in Stevenson
The most numerous immigrant groups reported in Stevenson came from Central America (35 | 2.1%), Latin America (35 | 2.1%), Mexico (35 | 2.1%), Europe (14 | 0.8%), and Northern Europe (7 | 0.4%), together accounting for 7.4% of all Stevenson residents.
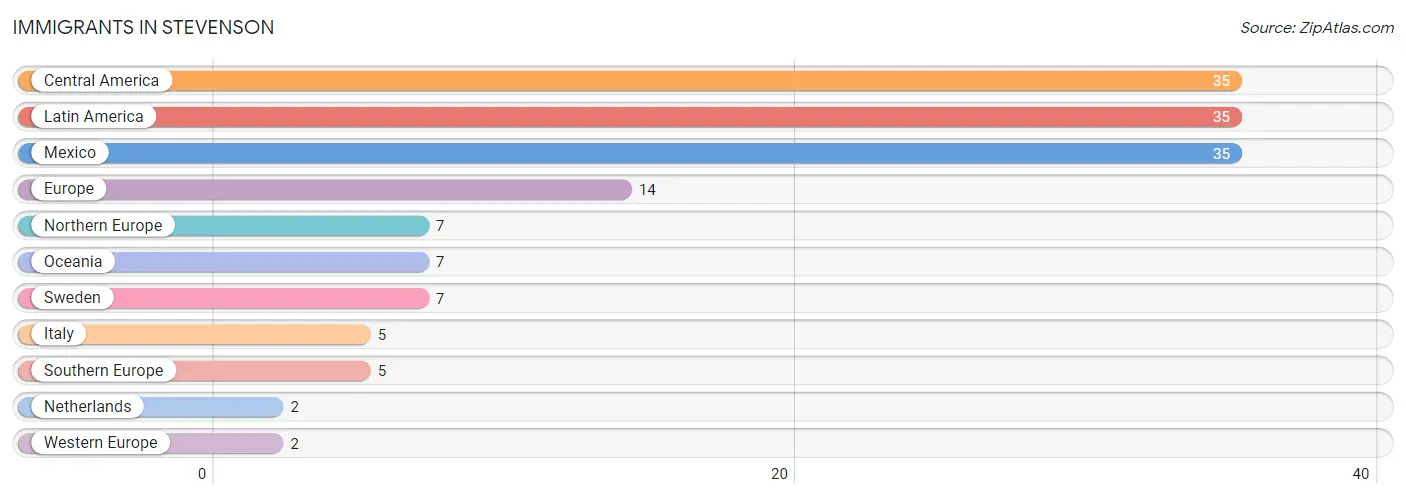
| Immigration Origin | # Population | % Population |
| Central America | 35 | 2.1% |
| Europe | 14 | 0.8% |
| Italy | 5 | 0.3% |
| Latin America | 35 | 2.1% |
| Mexico | 35 | 2.1% |
| Netherlands | 2 | 0.1% |
| Northern Europe | 7 | 0.4% |
| Oceania | 7 | 0.4% |
| Southern Europe | 5 | 0.3% |
| Sweden | 7 | 0.4% |
| Western Europe | 2 | 0.1% | View All 11 Rows |
Sex and Age in Stevenson
Sex and Age in Stevenson
The most populous age groups in Stevenson are 20 to 24 Years (82 | 9.7%) for men and 65 to 69 Years (126 | 14.7%) for women.
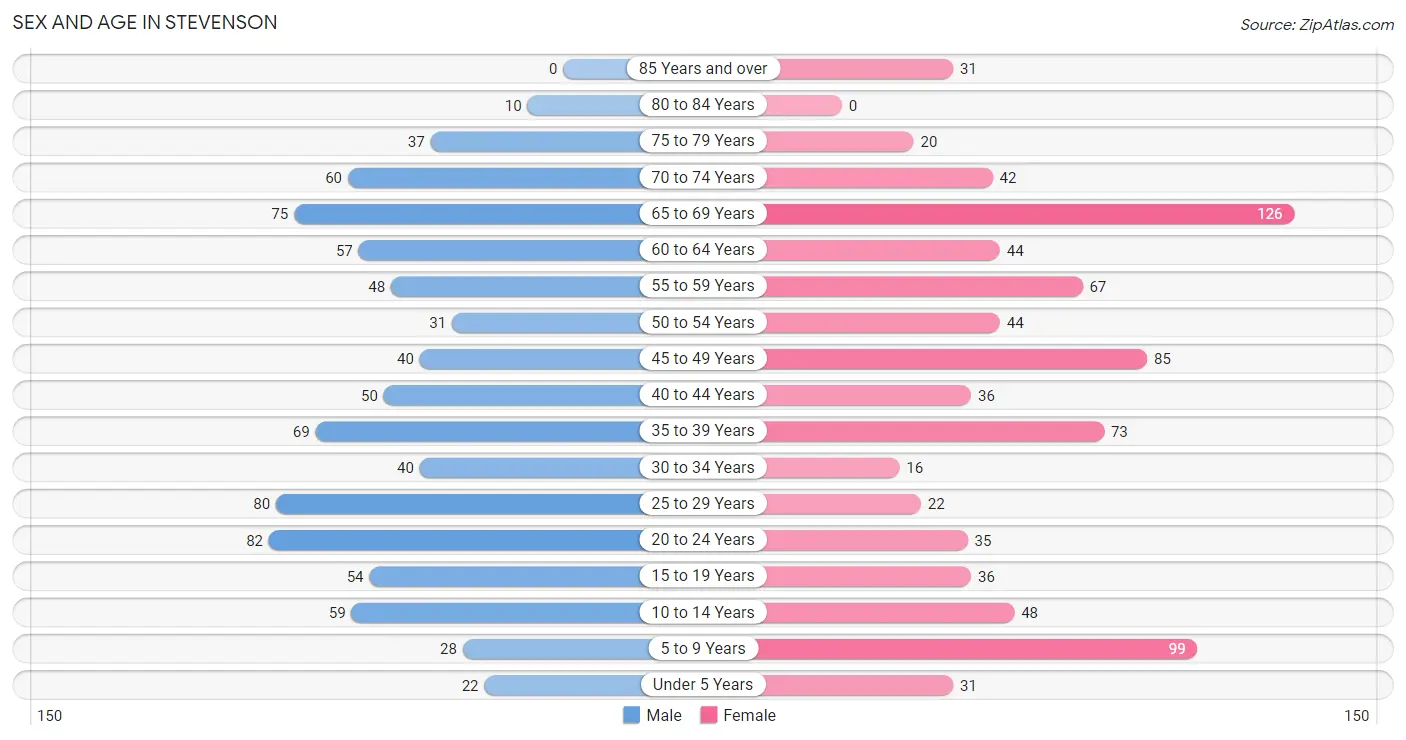
| Age Bracket | Male | Female |
| Under 5 Years | 22 (2.6%) | 31 (3.6%) |
| 5 to 9 Years | 28 (3.3%) | 99 (11.6%) |
| 10 to 14 Years | 59 (7.0%) | 48 (5.6%) |
| 15 to 19 Years | 54 (6.4%) | 36 (4.2%) |
| 20 to 24 Years | 82 (9.7%) | 35 (4.1%) |
| 25 to 29 Years | 80 (9.5%) | 22 (2.6%) |
| 30 to 34 Years | 40 (4.8%) | 16 (1.9%) |
| 35 to 39 Years | 69 (8.2%) | 73 (8.5%) |
| 40 to 44 Years | 50 (5.9%) | 36 (4.2%) |
| 45 to 49 Years | 40 (4.8%) | 85 (9.9%) |
| 50 to 54 Years | 31 (3.7%) | 44 (5.1%) |
| 55 to 59 Years | 48 (5.7%) | 67 (7.8%) |
| 60 to 64 Years | 57 (6.8%) | 44 (5.1%) |
| 65 to 69 Years | 75 (8.9%) | 126 (14.7%) |
| 70 to 74 Years | 60 (7.1%) | 42 (4.9%) |
| 75 to 79 Years | 37 (4.4%) | 20 (2.3%) |
| 80 to 84 Years | 10 (1.2%) | 0 (0.0%) |
| 85 Years and over | 0 (0.0%) | 31 (3.6%) |
| Total | 842 (100.0%) | 855 (100.0%) |
Families and Households in Stevenson
Median Family Size in Stevenson
The median family size in Stevenson is 2.97 persons per family, with married-couple families (321 | 73.1%) accounting for the largest median family size of 3.02 persons per family. On the other hand, single female/mother families (73 | 16.6%) represent the smallest median family size with 2.73 persons per family.
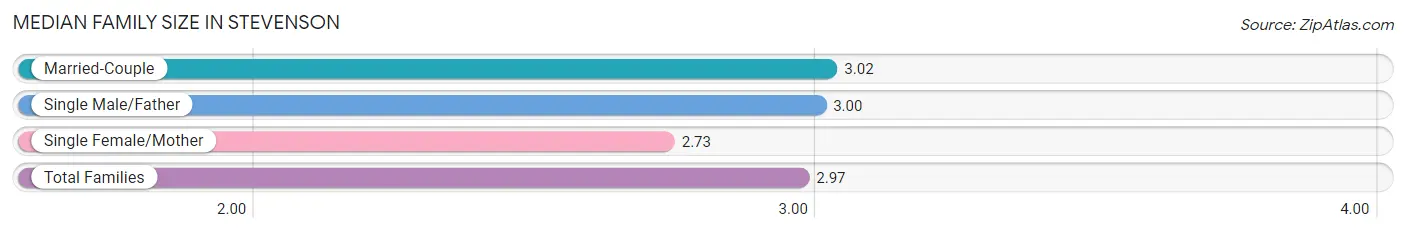
| Family Type | # Families | Family Size |
| Married-Couple | 321 (73.1%) | 3.02 |
| Single Male/Father | 45 (10.2%) | 3.00 |
| Single Female/Mother | 73 (16.6%) | 2.73 |
| Total Families | 439 (100.0%) | 2.97 |
Median Household Size in Stevenson
The median household size in Stevenson is 2.53 persons per household, with single female/mother households (73 | 11.3%) accounting for the largest median household size of 3.29 persons per household. non-family households (209 | 32.3%) represent the smallest median household size with 1.37 persons per household.
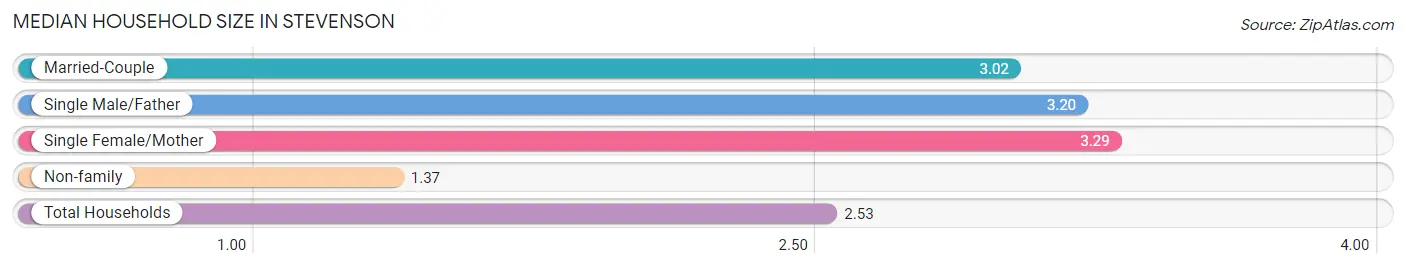
| Household Type | # Households | Household Size |
| Married-Couple | 321 (49.5%) | 3.02 |
| Single Male/Father | 45 (6.9%) | 3.20 |
| Single Female/Mother | 73 (11.3%) | 3.29 |
| Non-family | 209 (32.3%) | 1.37 |
| Total Households | 648 (100.0%) | 2.53 |
Household Size by Marriage Status in Stevenson
Out of a total of 648 households in Stevenson, 439 (67.7%) are family households, while 209 (32.3%) are nonfamily households. The most numerous type of family households are 2-person households, comprising 208, and the most common type of nonfamily households are 1-person households, comprising 150.
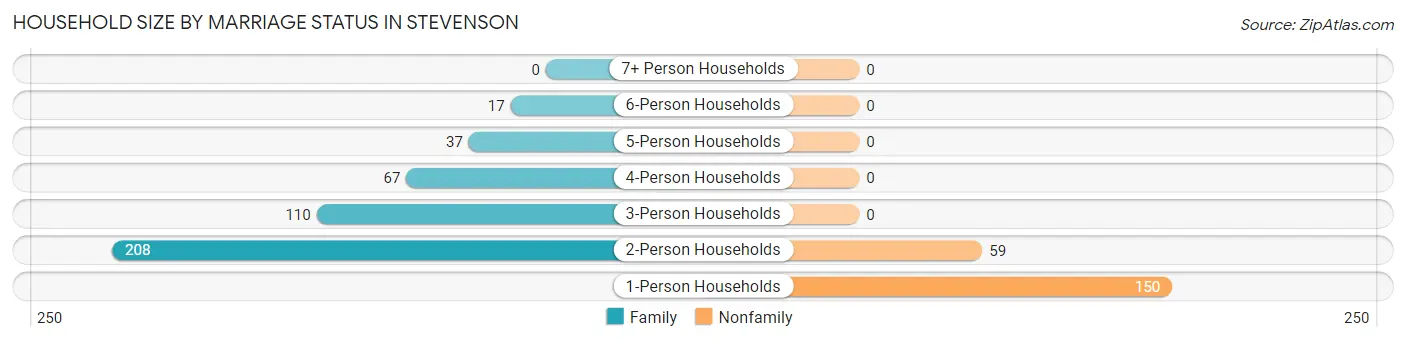
| Household Size | Family Households | Nonfamily Households |
| 1-Person Households | - | 150 (23.2%) |
| 2-Person Households | 208 (32.1%) | 59 (9.1%) |
| 3-Person Households | 110 (17.0%) | 0 (0.0%) |
| 4-Person Households | 67 (10.3%) | 0 (0.0%) |
| 5-Person Households | 37 (5.7%) | 0 (0.0%) |
| 6-Person Households | 17 (2.6%) | 0 (0.0%) |
| 7+ Person Households | 0 (0.0%) | 0 (0.0%) |
| Total | 439 (67.7%) | 209 (32.3%) |
Female Fertility in Stevenson
Fertility by Age in Stevenson
Average fertility rate in Stevenson is 10.0 births per 1,000 women. Women in the age bracket of 20 to 34 years have the highest fertility rate with 41.0 births per 1,000 women. Women in the age bracket of 20 to 34 years acount for 100.0% of all women with births.
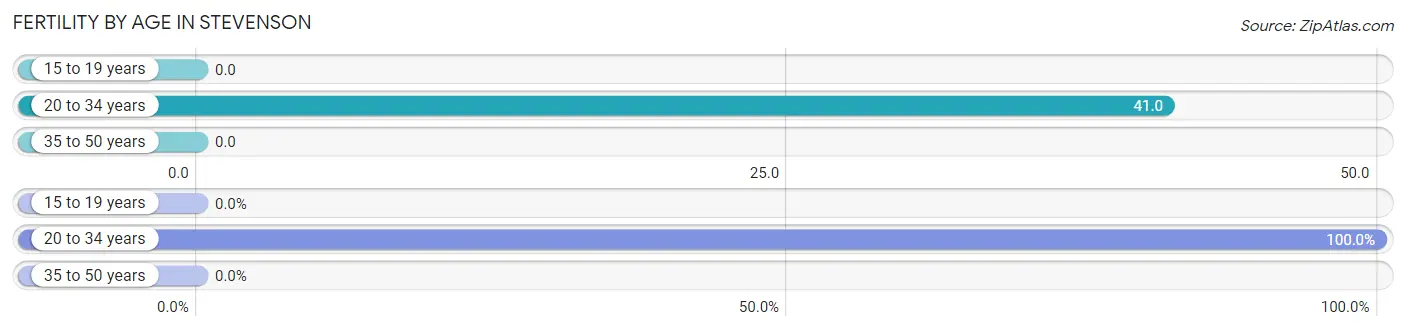
| Age Bracket | Women with Births | Births / 1,000 Women |
| 15 to 19 years | 0 (0.0%) | 0.0 |
| 20 to 34 years | 3 (100.0%) | 41.0 |
| 35 to 50 years | 0 (0.0%) | 0.0 |
| Total | 3 (100.0%) | 10.0 |
Fertility by Age by Marriage Status in Stevenson
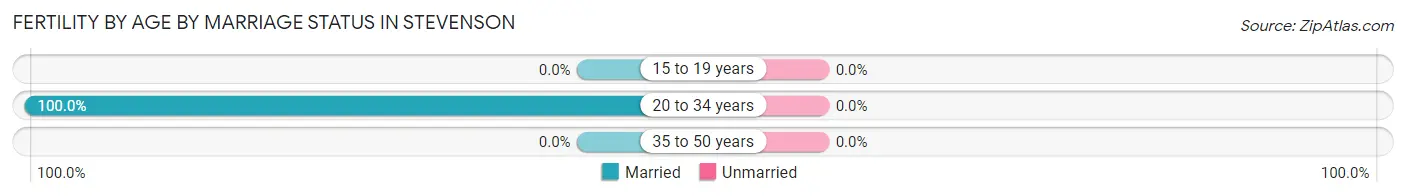
| Age Bracket | Married | Unmarried |
| 15 to 19 years | 0 (0.0%) | 0 (0.0%) |
| 20 to 34 years | 3 (100.0%) | 0 (0.0%) |
| 35 to 50 years | 0 (0.0%) | 0 (0.0%) |
| Total | 3 (100.0%) | 0 (0.0%) |
Fertility by Education in Stevenson
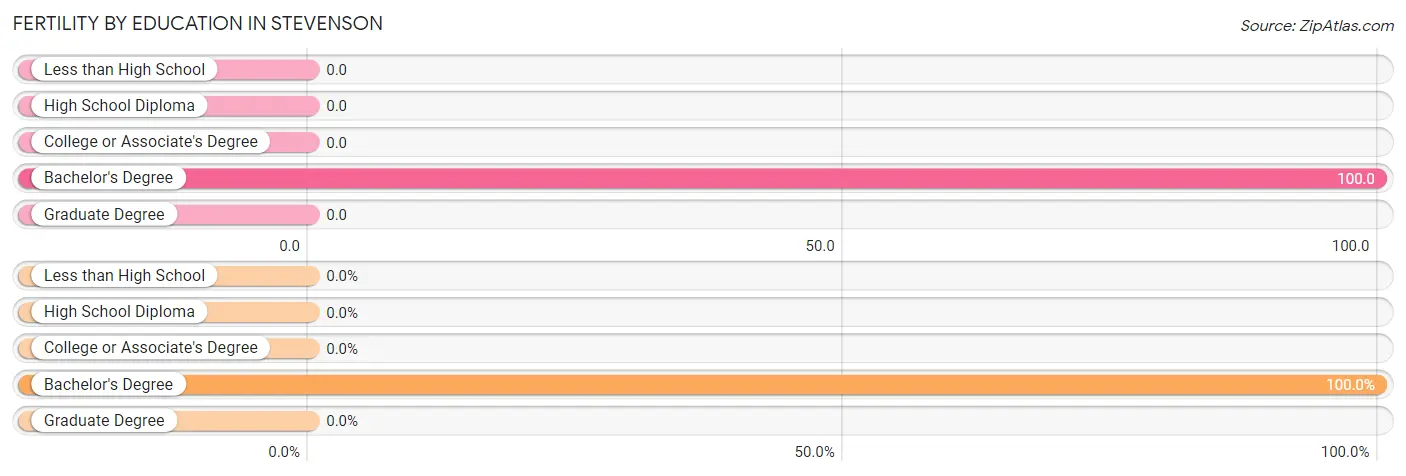
| Educational Attainment | Women with Births | Births / 1,000 Women |
| Less than High School | 0 (0.0%) | 0.0 |
| High School Diploma | 0 (0.0%) | 0.0 |
| College or Associate's Degree | 0 (0.0%) | 0.0 |
| Bachelor's Degree | 3 (100.0%) | 100.0 |
| Graduate Degree | 0 (0.0%) | 0.0 |
| Total | 3 (100.0%) | 10.0 |
Fertility by Education by Marriage Status in Stevenson
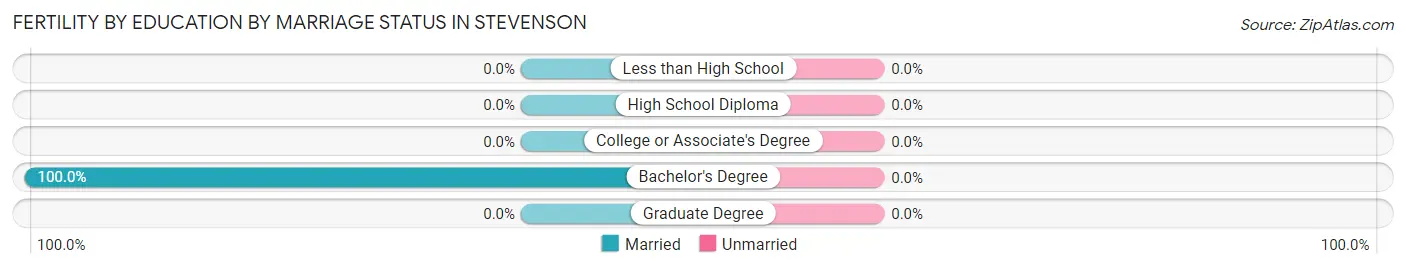
| Educational Attainment | Married | Unmarried |
| Less than High School | 0 (0.0%) | 0 (0.0%) |
| High School Diploma | 0 (0.0%) | 0 (0.0%) |
| College or Associate's Degree | 0 (0.0%) | 0 (0.0%) |
| Bachelor's Degree | 3 (100.0%) | 0 (0.0%) |
| Graduate Degree | 0 (0.0%) | 0 (0.0%) |
| Total | 3 (100.0%) | 0 (0.0%) |
Employment Characteristics in Stevenson
Employment by Class of Employer in Stevenson
Among the 720 employed individuals in Stevenson, private company employees (485 | 67.4%), not-for-profit organizations (62 | 8.6%), and local government employees (60 | 8.3%) make up the most common classes of employment.
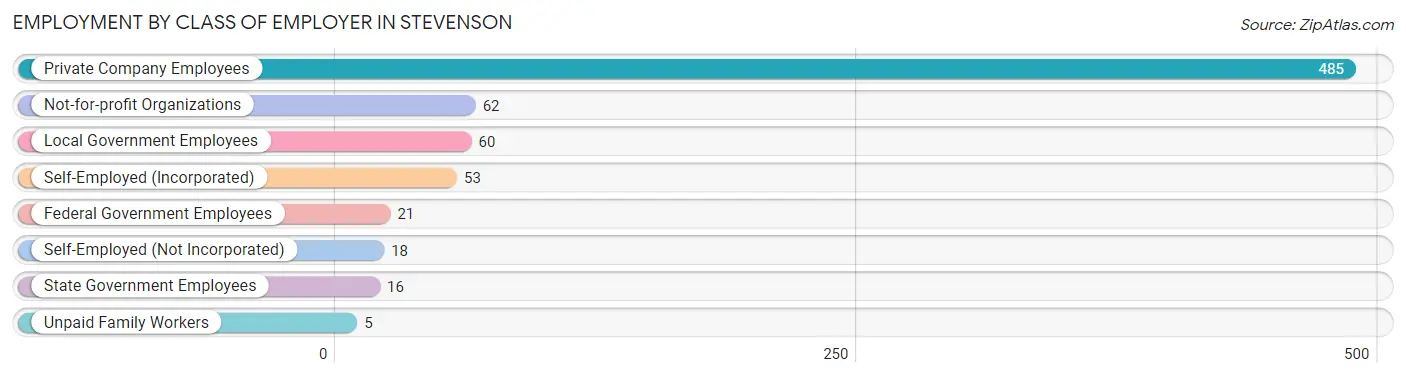
| Employer Class | # Employees | % Employees |
| Private Company Employees | 485 | 67.4% |
| Self-Employed (Incorporated) | 53 | 7.4% |
| Self-Employed (Not Incorporated) | 18 | 2.5% |
| Not-for-profit Organizations | 62 | 8.6% |
| Local Government Employees | 60 | 8.3% |
| State Government Employees | 16 | 2.2% |
| Federal Government Employees | 21 | 2.9% |
| Unpaid Family Workers | 5 | 0.7% |
| Total | 720 | 100.0% |
Employment Status by Age in Stevenson
According to the labor force statistics for Stevenson, out of the total population over 16 years of age (1,388), 53.3% or 740 individuals are in the labor force, with 2.7% or 20 of them unemployed. The age group with the highest labor force participation rate is 20 to 24 years, with 97.4% or 114 individuals in the labor force. Within the labor force, the 55 to 59 years age range has the highest percentage of unemployed individuals, with 12.9% or 8 of them being unemployed.
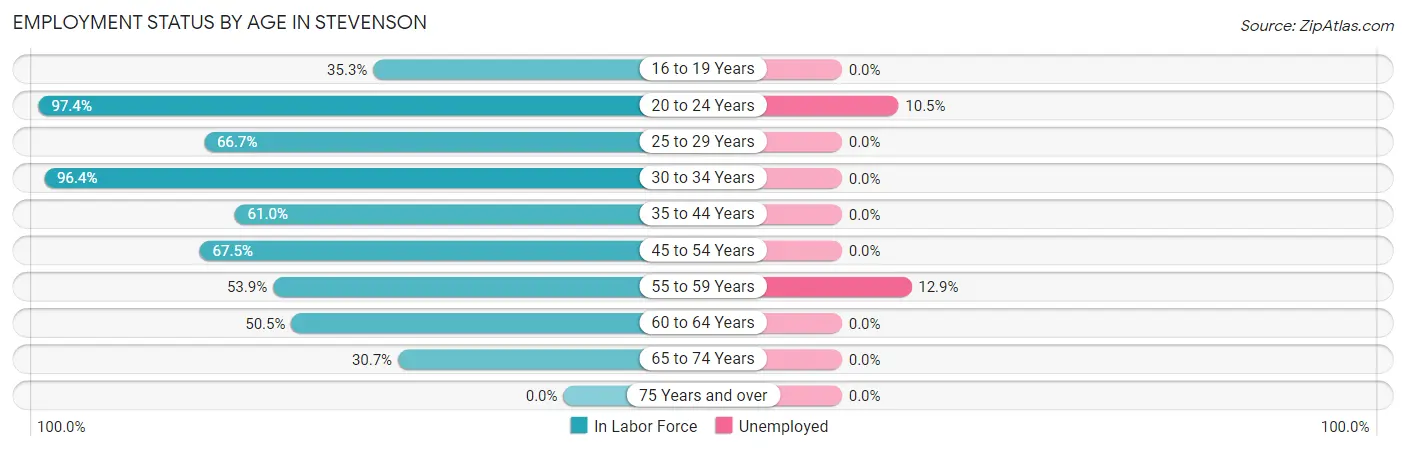
| Age Bracket | In Labor Force | Unemployed |
| 16 to 19 Years | 24 (35.3%) | 0 (0.0%) |
| 20 to 24 Years | 114 (97.4%) | 12 (10.5%) |
| 25 to 29 Years | 68 (66.7%) | 0 (0.0%) |
| 30 to 34 Years | 54 (96.4%) | 0 (0.0%) |
| 35 to 44 Years | 139 (61.0%) | 0 (0.0%) |
| 45 to 54 Years | 135 (67.5%) | 0 (0.0%) |
| 55 to 59 Years | 62 (53.9%) | 8 (12.9%) |
| 60 to 64 Years | 51 (50.5%) | 0 (0.0%) |
| 65 to 74 Years | 93 (30.7%) | 0 (0.0%) |
| 75 Years and over | 0 (0.0%) | 0 (0.0%) |
| Total | 740 (53.3%) | 20 (2.7%) |
Employment Status by Educational Attainment in Stevenson
According to labor force statistics for Stevenson, 63.5% of individuals (509) out of the total population between 25 and 64 years of age (802) are in the labor force, with 1.6% or 8 of them being unemployed. The group with the highest labor force participation rate are those with the educational attainment of bachelor's degree or higher, with 86.3% or 170 individuals in the labor force. Within the labor force, individuals with bachelor's degree or higher education have the highest percentage of unemployment, with 4.7% or 8 of them being unemployed.
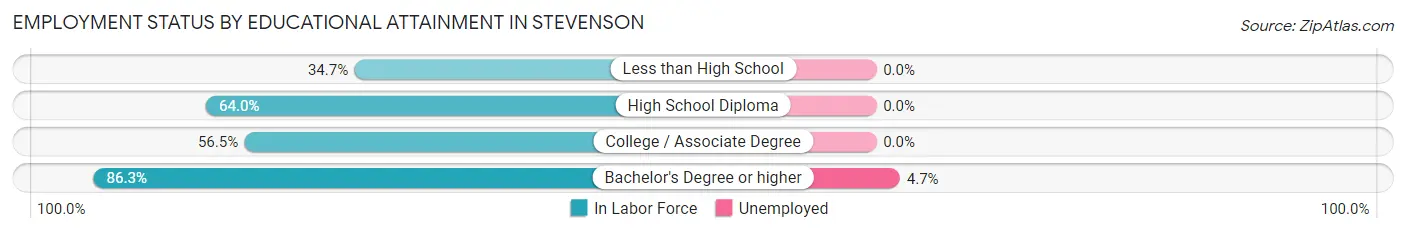
| Educational Attainment | In Labor Force | Unemployed |
| Less than High School | 34 (34.7%) | 0 (0.0%) |
| High School Diploma | 158 (64.0%) | 0 (0.0%) |
| College / Associate Degree | 147 (56.5%) | 0 (0.0%) |
| Bachelor's Degree or higher | 170 (86.3%) | 9 (4.7%) |
| Total | 509 (63.5%) | 13 (1.6%) |
Employment Occupations by Sex in Stevenson
Management, Business, Science and Arts Occupations
The most common Management, Business, Science and Arts occupations in Stevenson are Community & Social Service (89 | 12.4%), Management (81 | 11.3%), Education Instruction & Library (45 | 6.2%), Health Diagnosing & Treating (35 | 4.9%), and Computers, Engineering & Science (31 | 4.3%).
Management, Business, Science and Arts Occupations by Sex
Within the Management, Business, Science and Arts occupations in Stevenson, the most male-oriented occupations are Computers, Engineering & Science (100.0%), Computers & Mathematics (100.0%), and Architecture & Engineering (100.0%), while the most female-oriented occupations are Business & Financial (100.0%), Education Instruction & Library (88.9%), and Community & Social Service (67.4%).
| Occupation | Male | Female |
| Management | 47 (58.0%) | 34 (42.0%) |
| Business & Financial | 0 (0.0%) | 9 (100.0%) |
| Computers, Engineering & Science | 31 (100.0%) | 0 (0.0%) |
| Computers & Mathematics | 9 (100.0%) | 0 (0.0%) |
| Architecture & Engineering | 4 (100.0%) | 0 (0.0%) |
| Life, Physical & Social Science | 18 (100.0%) | 0 (0.0%) |
| Community & Social Service | 29 (32.6%) | 60 (67.4%) |
| Education, Arts & Media | 14 (56.0%) | 11 (44.0%) |
| Legal Services & Support | 0 (0.0%) | 0 (0.0%) |
| Education Instruction & Library | 5 (11.1%) | 40 (88.9%) |
| Arts, Media & Entertainment | 10 (52.6%) | 9 (47.4%) |
| Health Diagnosing & Treating | 20 (57.1%) | 15 (42.9%) |
| Health Technologists | 8 (34.8%) | 15 (65.2%) |
| Total (Category) | 127 (51.8%) | 118 (48.2%) |
| Total (Overall) | 419 (58.2%) | 301 (41.8%) |
Services Occupations
The most common Services occupations in Stevenson are Food Preparation & Serving (87 | 12.1%), Personal Care & Service (25 | 3.5%), Healthcare Support (16 | 2.2%), and Cleaning & Maintenance (15 | 2.1%).
Services Occupations by Sex
Within the Services occupations in Stevenson, the most male-oriented occupations are Food Preparation & Serving (80.5%), Cleaning & Maintenance (80.0%), and Healthcare Support (18.8%), while the most female-oriented occupations are Personal Care & Service (100.0%), Healthcare Support (81.2%), and Cleaning & Maintenance (20.0%).
| Occupation | Male | Female |
| Healthcare Support | 3 (18.8%) | 13 (81.2%) |
| Security & Protection | 0 (0.0%) | 0 (0.0%) |
| Firefighting & Prevention | 0 (0.0%) | 0 (0.0%) |
| Law Enforcement | 0 (0.0%) | 0 (0.0%) |
| Food Preparation & Serving | 70 (80.5%) | 17 (19.5%) |
| Cleaning & Maintenance | 12 (80.0%) | 3 (20.0%) |
| Personal Care & Service | 0 (0.0%) | 25 (100.0%) |
| Total (Category) | 85 (59.4%) | 58 (40.6%) |
| Total (Overall) | 419 (58.2%) | 301 (41.8%) |
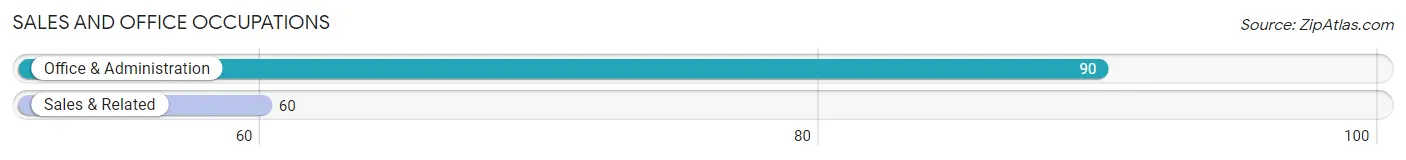
Sales and Office Occupations
The most common Sales and Office occupations in Stevenson are Office & Administration (90 | 12.5%), and Sales & Related (60 | 8.3%).
Sales and Office Occupations by Sex
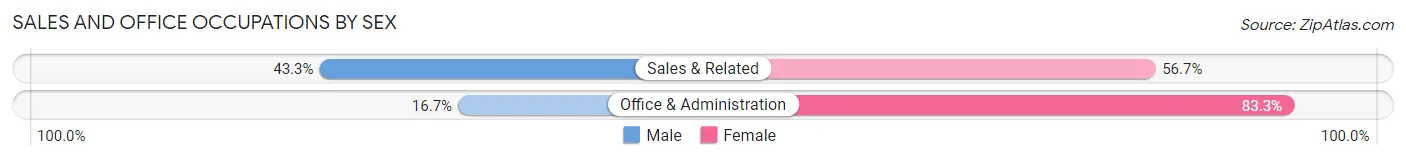
| Occupation | Male | Female |
| Sales & Related | 26 (43.3%) | 34 (56.7%) |
| Office & Administration | 15 (16.7%) | 75 (83.3%) |
| Total (Category) | 41 (27.3%) | 109 (72.7%) |
| Total (Overall) | 419 (58.2%) | 301 (41.8%) |
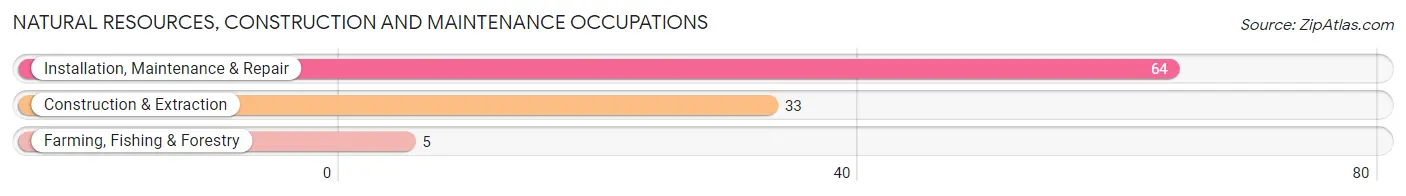
Natural Resources, Construction and Maintenance Occupations
The most common Natural Resources, Construction and Maintenance occupations in Stevenson are Installation, Maintenance & Repair (64 | 8.9%), Construction & Extraction (33 | 4.6%), and Farming, Fishing & Forestry (5 | 0.7%).
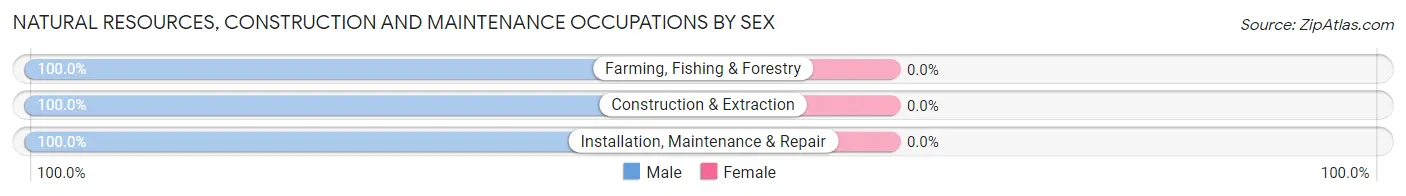
Natural Resources, Construction and Maintenance Occupations by Sex
| Occupation | Male | Female |
| Farming, Fishing & Forestry | 5 (100.0%) | 0 (0.0%) |
| Construction & Extraction | 33 (100.0%) | 0 (0.0%) |
| Installation, Maintenance & Repair | 64 (100.0%) | 0 (0.0%) |
| Total (Category) | 102 (100.0%) | 0 (0.0%) |
| Total (Overall) | 419 (58.2%) | 301 (41.8%) |
Production, Transportation and Moving Occupations
The most common Production, Transportation and Moving occupations in Stevenson are Production (55 | 7.6%), Material Moving (17 | 2.4%), and Transportation (8 | 1.1%).
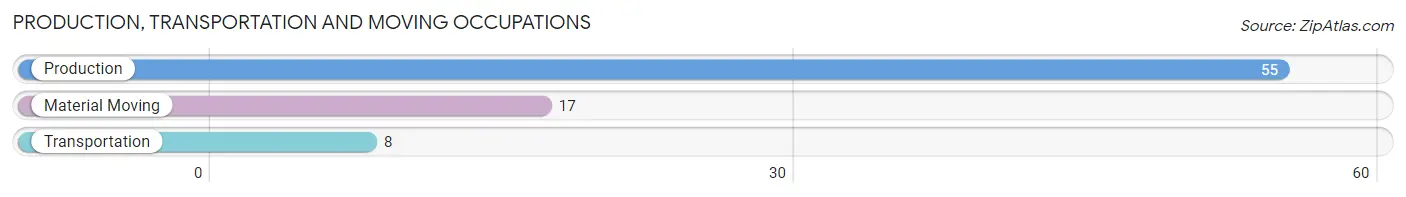
Production, Transportation and Moving Occupations by Sex
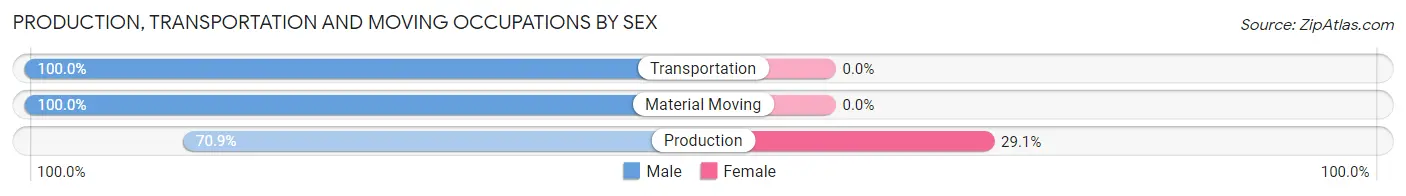
| Occupation | Male | Female |
| Production | 39 (70.9%) | 16 (29.1%) |
| Transportation | 8 (100.0%) | 0 (0.0%) |
| Material Moving | 17 (100.0%) | 0 (0.0%) |
| Total (Category) | 64 (80.0%) | 16 (20.0%) |
| Total (Overall) | 419 (58.2%) | 301 (41.8%) |
Employment Industries by Sex in Stevenson
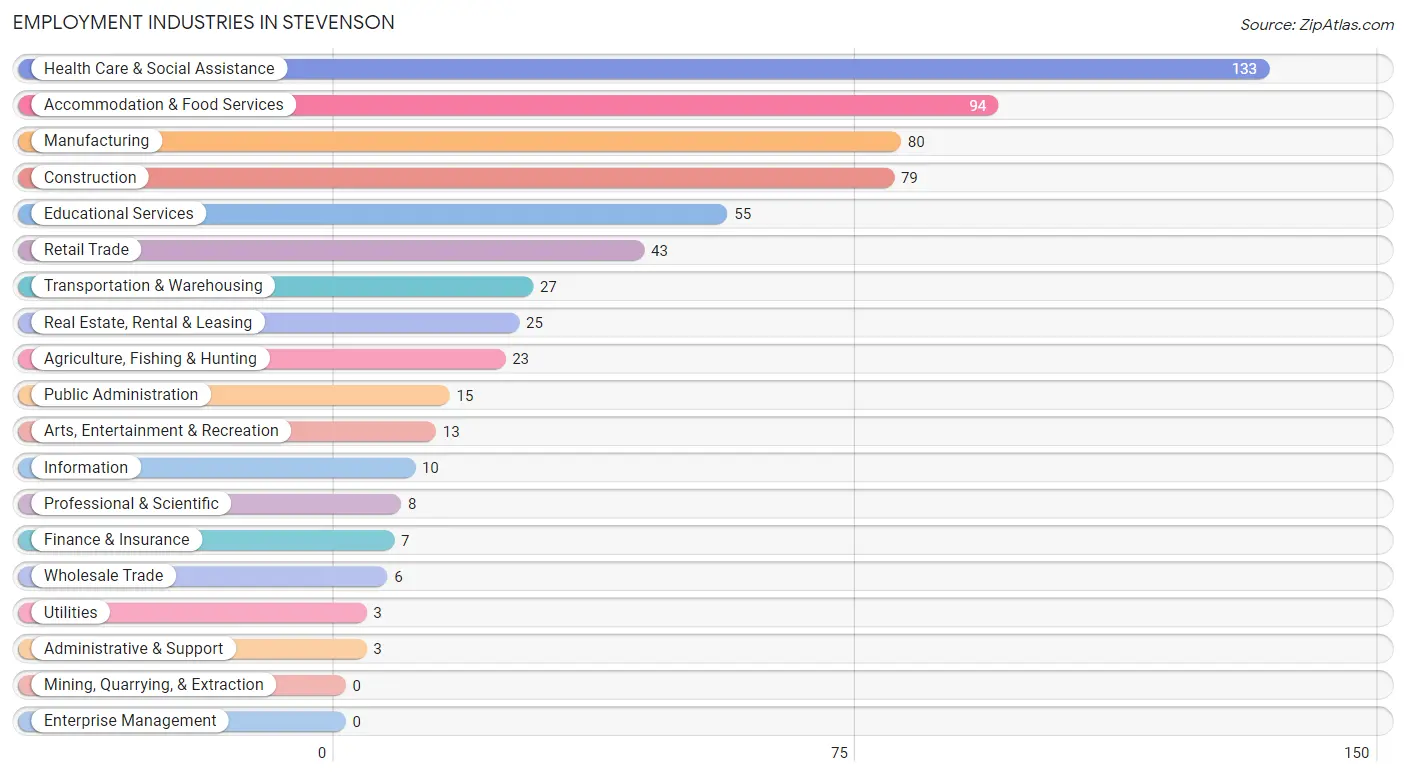
Employment Industries in Stevenson
The major employment industries in Stevenson include Health Care & Social Assistance (133 | 18.5%), Accommodation & Food Services (94 | 13.1%), Manufacturing (80 | 11.1%), Construction (79 | 11.0%), and Educational Services (55 | 7.6%).
Employment Industries by Sex in Stevenson
The Stevenson industries that see more men than women are Agriculture, Fishing & Hunting (100.0%), Wholesale Trade (100.0%), and Utilities (100.0%), whereas the industries that tend to have a higher number of women are Real Estate, Rental & Leasing (100.0%), Administrative & Support (100.0%), and Health Care & Social Assistance (85.0%).
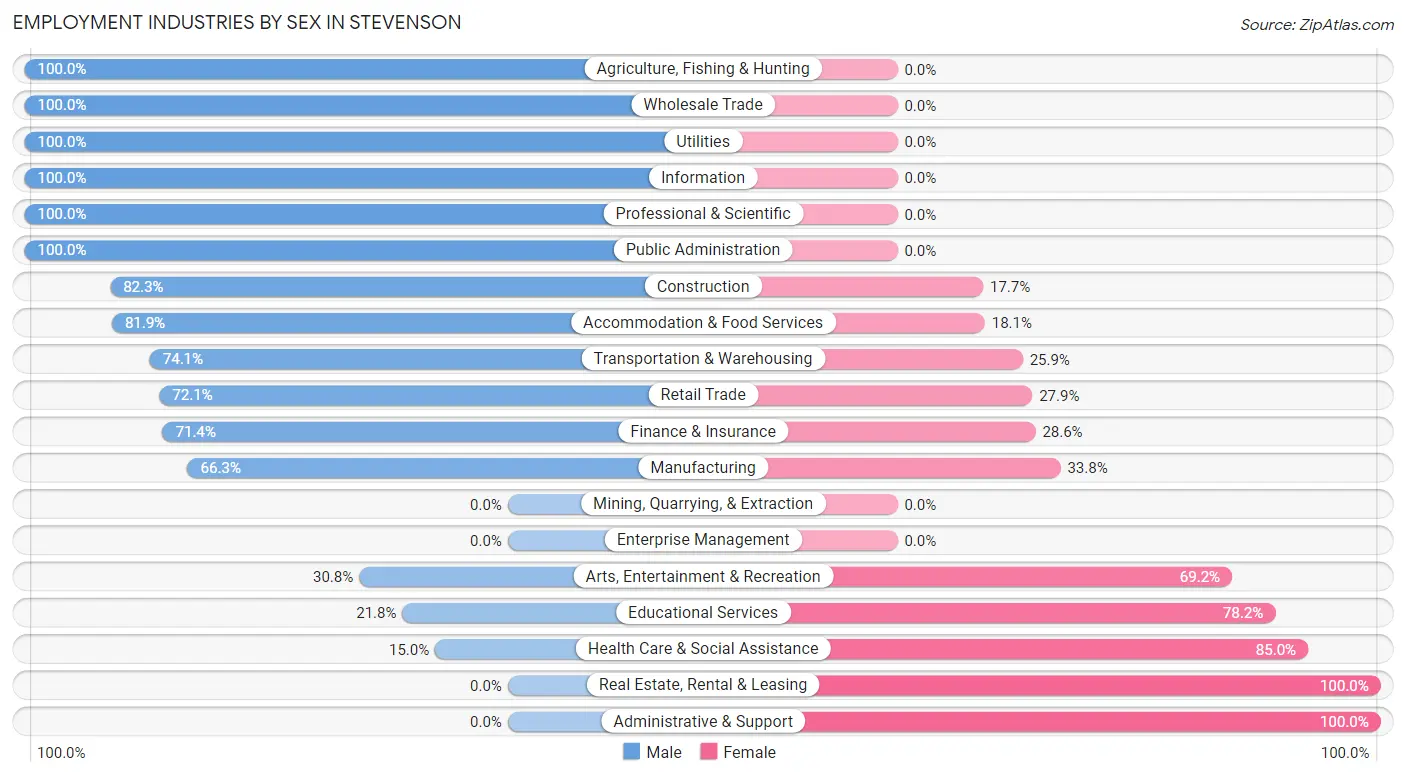
| Industry | Male | Female |
| Agriculture, Fishing & Hunting | 23 (100.0%) | 0 (0.0%) |
| Mining, Quarrying, & Extraction | 0 (0.0%) | 0 (0.0%) |
| Construction | 65 (82.3%) | 14 (17.7%) |
| Manufacturing | 53 (66.2%) | 27 (33.8%) |
| Wholesale Trade | 6 (100.0%) | 0 (0.0%) |
| Retail Trade | 31 (72.1%) | 12 (27.9%) |
| Transportation & Warehousing | 20 (74.1%) | 7 (25.9%) |
| Utilities | 3 (100.0%) | 0 (0.0%) |
| Information | 10 (100.0%) | 0 (0.0%) |
| Finance & Insurance | 5 (71.4%) | 2 (28.6%) |
| Real Estate, Rental & Leasing | 0 (0.0%) | 25 (100.0%) |
| Professional & Scientific | 8 (100.0%) | 0 (0.0%) |
| Enterprise Management | 0 (0.0%) | 0 (0.0%) |
| Administrative & Support | 0 (0.0%) | 3 (100.0%) |
| Educational Services | 12 (21.8%) | 43 (78.2%) |
| Health Care & Social Assistance | 20 (15.0%) | 113 (85.0%) |
| Arts, Entertainment & Recreation | 4 (30.8%) | 9 (69.2%) |
| Accommodation & Food Services | 77 (81.9%) | 17 (18.1%) |
| Public Administration | 15 (100.0%) | 0 (0.0%) |
| Total | 419 (58.2%) | 301 (41.8%) |
Education in Stevenson
School Enrollment in Stevenson
The most common levels of schooling among the 383 students in Stevenson are elementary school (127 | 33.2%), middle school (76 | 19.8%), and college / undergraduate (72 | 18.8%).
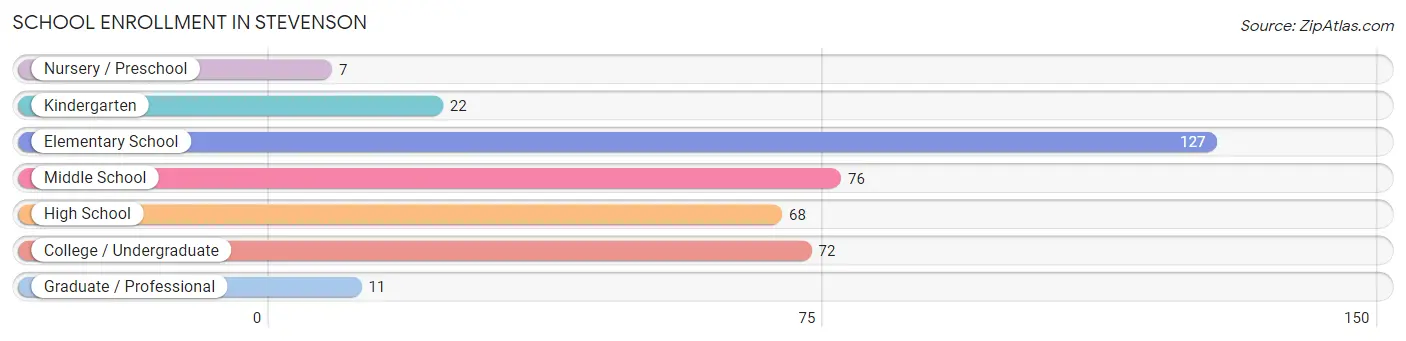
| School Level | # Students | % Students |
| Nursery / Preschool | 7 | 1.8% |
| Kindergarten | 22 | 5.7% |
| Elementary School | 127 | 33.2% |
| Middle School | 76 | 19.8% |
| High School | 68 | 17.7% |
| College / Undergraduate | 72 | 18.8% |
| Graduate / Professional | 11 | 2.9% |
| Total | 383 | 100.0% |
School Enrollment by Age by Funding Source in Stevenson
Out of a total of 383 students who are enrolled in schools in Stevenson, 26 (6.8%) attend a private institution, while the remaining 357 (93.2%) are enrolled in public schools. The age group of 18 to 19 year olds has the highest likelihood of being enrolled in private schools, with 3 (100.0% in the age bracket) enrolled. Conversely, the age group of 3 to 4 year olds has the lowest likelihood of being enrolled in a private school, with 7 (100.0% in the age bracket) attending a public institution.
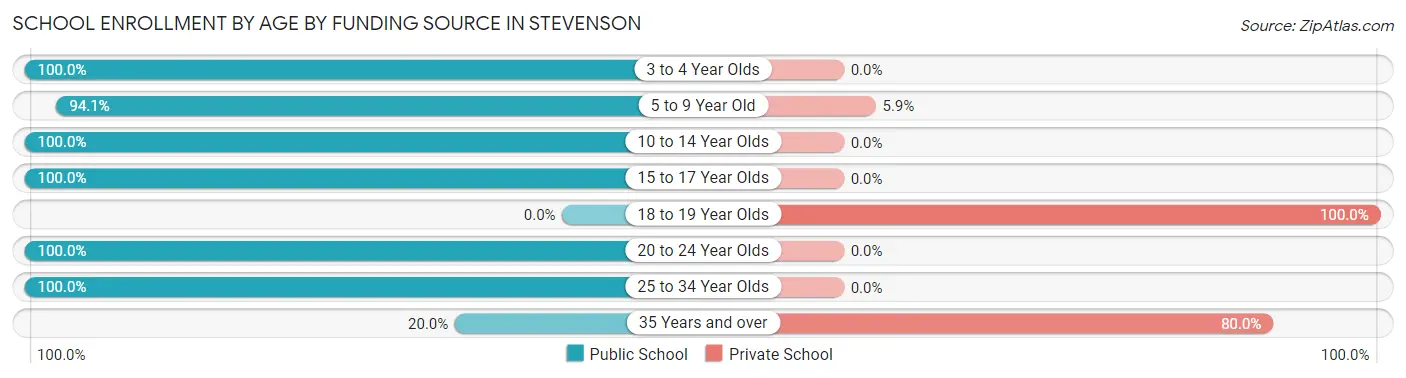
| Age Bracket | Public School | Private School |
| 3 to 4 Year Olds | 7 (100.0%) | 0 (0.0%) |
| 5 to 9 Year Old | 111 (94.1%) | 7 (5.9%) |
| 10 to 14 Year Olds | 107 (100.0%) | 0 (0.0%) |
| 15 to 17 Year Olds | 68 (100.0%) | 0 (0.0%) |
| 18 to 19 Year Olds | 0 (0.0%) | 3 (100.0%) |
| 20 to 24 Year Olds | 54 (100.0%) | 0 (0.0%) |
| 25 to 34 Year Olds | 6 (100.0%) | 0 (0.0%) |
| 35 Years and over | 4 (20.0%) | 16 (80.0%) |
| Total | 357 (93.2%) | 26 (6.8%) |
Educational Attainment by Field of Study in Stevenson
Education (55 | 14.6%), bio, nature & agricultural (51 | 13.6%), liberal arts & history (36 | 9.6%), social sciences (34 | 9.0%), and science & technology (33 | 8.8%) are the most common fields of study among 376 individuals in Stevenson who have obtained a bachelor's degree or higher.
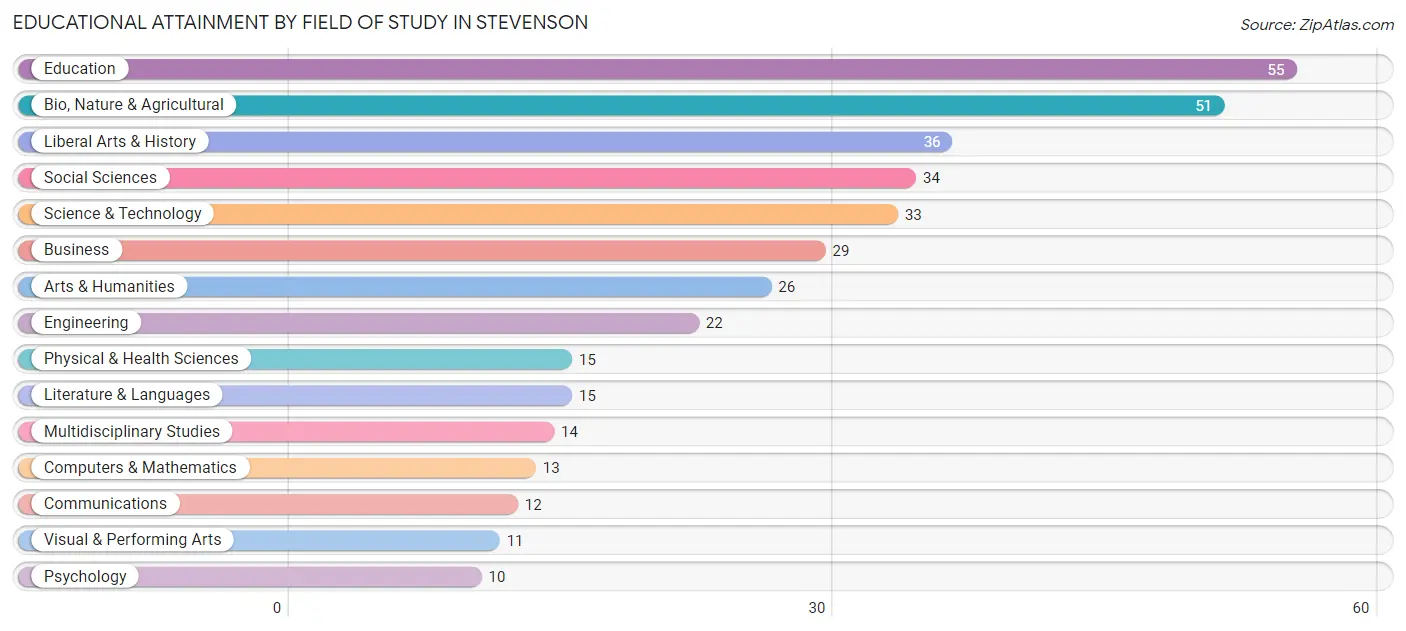
| Field of Study | # Graduates | % Graduates |
| Computers & Mathematics | 13 | 3.5% |
| Bio, Nature & Agricultural | 51 | 13.6% |
| Physical & Health Sciences | 15 | 4.0% |
| Psychology | 10 | 2.7% |
| Social Sciences | 34 | 9.0% |
| Engineering | 22 | 5.9% |
| Multidisciplinary Studies | 14 | 3.7% |
| Science & Technology | 33 | 8.8% |
| Business | 29 | 7.7% |
| Education | 55 | 14.6% |
| Literature & Languages | 15 | 4.0% |
| Liberal Arts & History | 36 | 9.6% |
| Visual & Performing Arts | 11 | 2.9% |
| Communications | 12 | 3.2% |
| Arts & Humanities | 26 | 6.9% |
| Total | 376 | 100.0% |
Transportation & Commute in Stevenson
Vehicle Availability by Sex in Stevenson
The most prevalent vehicle ownership categories in Stevenson are males with 2 vehicles (133, accounting for 31.7%) and females with 2 vehicles (153, making up 44.2%).
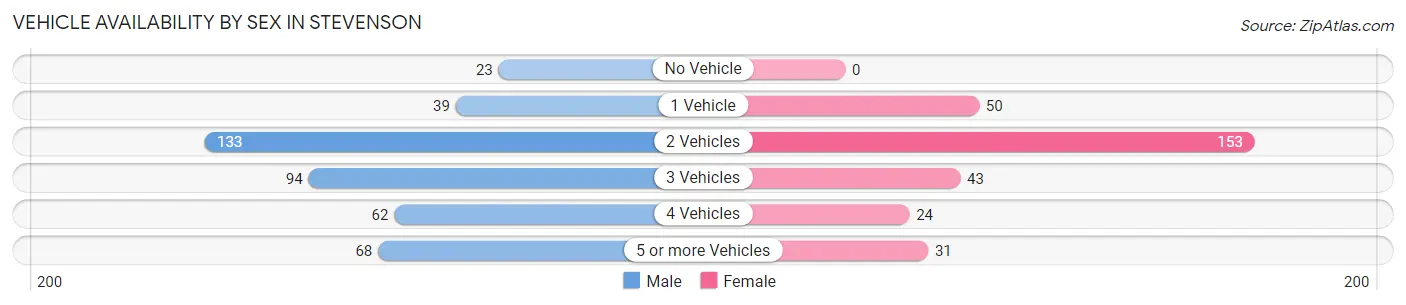
| Vehicles Available | Male | Female |
| No Vehicle | 23 (5.5%) | 0 (0.0%) |
| 1 Vehicle | 39 (9.3%) | 50 (16.6%) |
| 2 Vehicles | 133 (31.7%) | 153 (50.8%) |
| 3 Vehicles | 94 (22.4%) | 43 (14.3%) |
| 4 Vehicles | 62 (14.8%) | 24 (8.0%) |
| 5 or more Vehicles | 68 (16.2%) | 31 (10.3%) |
| Total | 419 (100.0%) | 301 (100.0%) |
Commute Time in Stevenson
The most frequently occuring commute durations in Stevenson are 5 to 9 minutes (188 commuters, 29.0%), less than 5 minutes (115 commuters, 17.7%), and 10 to 14 minutes (83 commuters, 12.8%).
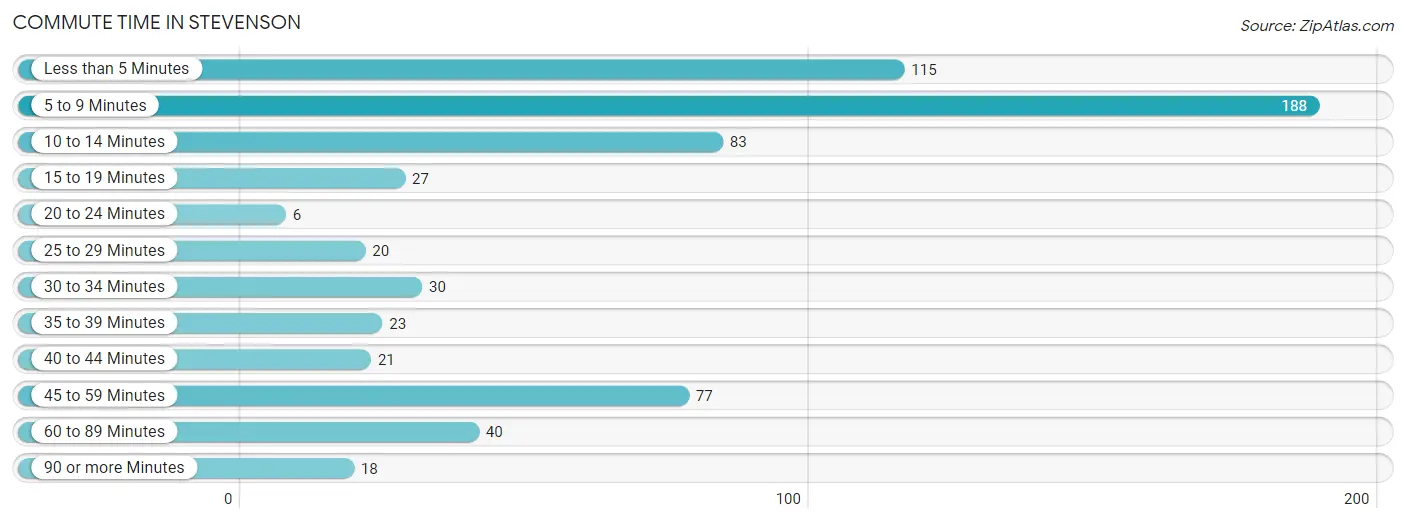
| Commute Time | # Commuters | % Commuters |
| Less than 5 Minutes | 115 | 17.7% |
| 5 to 9 Minutes | 188 | 29.0% |
| 10 to 14 Minutes | 83 | 12.8% |
| 15 to 19 Minutes | 27 | 4.2% |
| 20 to 24 Minutes | 6 | 0.9% |
| 25 to 29 Minutes | 20 | 3.1% |
| 30 to 34 Minutes | 30 | 4.6% |
| 35 to 39 Minutes | 23 | 3.5% |
| 40 to 44 Minutes | 21 | 3.2% |
| 45 to 59 Minutes | 77 | 11.9% |
| 60 to 89 Minutes | 40 | 6.2% |
| 90 or more Minutes | 18 | 2.8% |
Commute Time by Sex in Stevenson
The most common commute times in Stevenson are 5 to 9 minutes (90 commuters, 23.1%) for males and 5 to 9 minutes (98 commuters, 38.0%) for females.
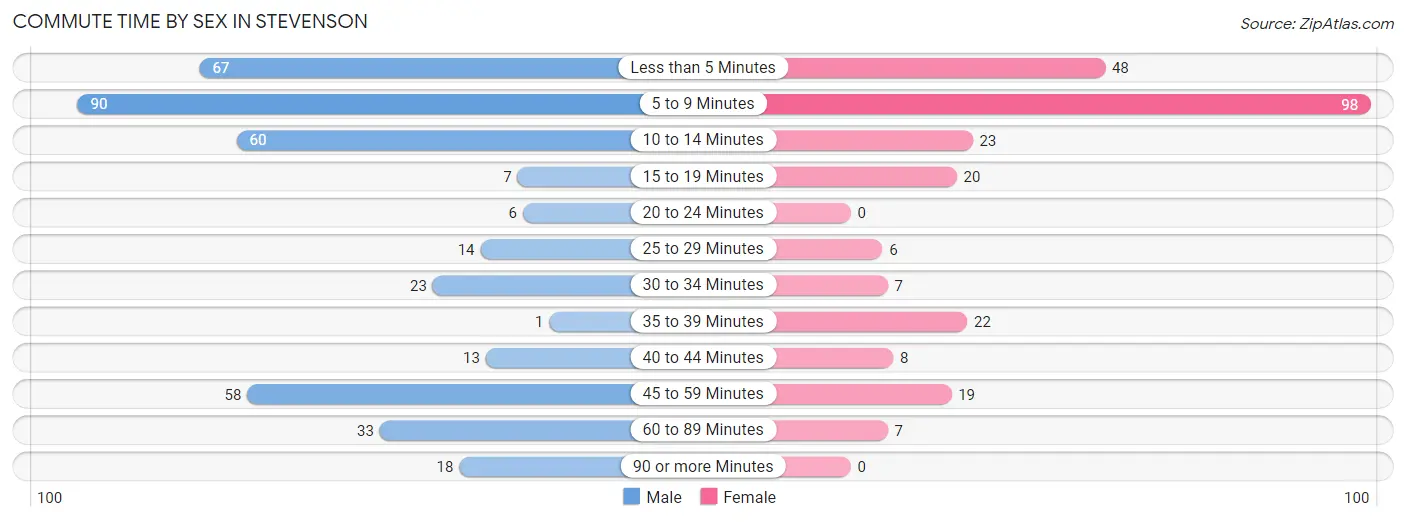
| Commute Time | Male | Female |
| Less than 5 Minutes | 67 (17.2%) | 48 (18.6%) |
| 5 to 9 Minutes | 90 (23.1%) | 98 (38.0%) |
| 10 to 14 Minutes | 60 (15.4%) | 23 (8.9%) |
| 15 to 19 Minutes | 7 (1.8%) | 20 (7.7%) |
| 20 to 24 Minutes | 6 (1.5%) | 0 (0.0%) |
| 25 to 29 Minutes | 14 (3.6%) | 6 (2.3%) |
| 30 to 34 Minutes | 23 (5.9%) | 7 (2.7%) |
| 35 to 39 Minutes | 1 (0.3%) | 22 (8.5%) |
| 40 to 44 Minutes | 13 (3.3%) | 8 (3.1%) |
| 45 to 59 Minutes | 58 (14.9%) | 19 (7.4%) |
| 60 to 89 Minutes | 33 (8.5%) | 7 (2.7%) |
| 90 or more Minutes | 18 (4.6%) | 0 (0.0%) |
Time of Departure to Work by Sex in Stevenson
The most frequent times of departure to work in Stevenson are 6:30 AM to 6:59 AM (59, 15.1%) for males and 7:00 AM to 7:29 AM (87, 33.7%) for females.
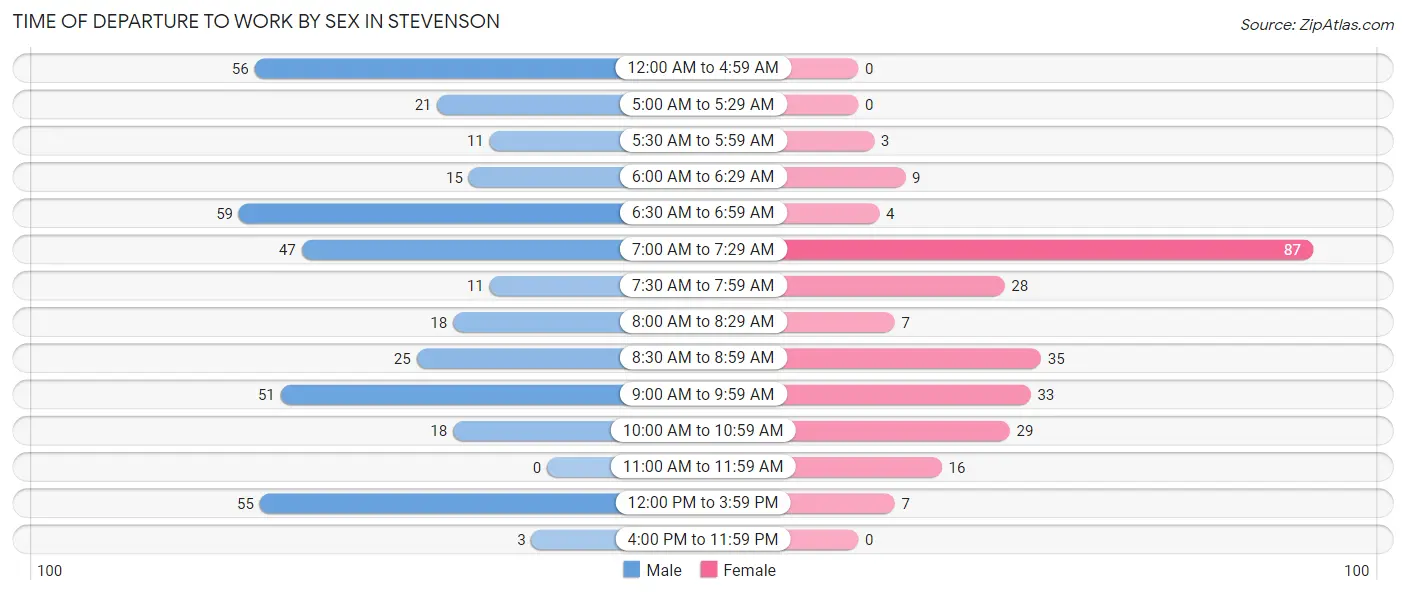
| Time of Departure | Male | Female |
| 12:00 AM to 4:59 AM | 56 (14.4%) | 0 (0.0%) |
| 5:00 AM to 5:29 AM | 21 (5.4%) | 0 (0.0%) |
| 5:30 AM to 5:59 AM | 11 (2.8%) | 3 (1.2%) |
| 6:00 AM to 6:29 AM | 15 (3.8%) | 9 (3.5%) |
| 6:30 AM to 6:59 AM | 59 (15.1%) | 4 (1.5%) |
| 7:00 AM to 7:29 AM | 47 (12.0%) | 87 (33.7%) |
| 7:30 AM to 7:59 AM | 11 (2.8%) | 28 (10.8%) |
| 8:00 AM to 8:29 AM | 18 (4.6%) | 7 (2.7%) |
| 8:30 AM to 8:59 AM | 25 (6.4%) | 35 (13.6%) |
| 9:00 AM to 9:59 AM | 51 (13.1%) | 33 (12.8%) |
| 10:00 AM to 10:59 AM | 18 (4.6%) | 29 (11.2%) |
| 11:00 AM to 11:59 AM | 0 (0.0%) | 16 (6.2%) |
| 12:00 PM to 3:59 PM | 55 (14.1%) | 7 (2.7%) |
| 4:00 PM to 11:59 PM | 3 (0.8%) | 0 (0.0%) |
| Total | 390 (100.0%) | 258 (100.0%) |
Housing Occupancy in Stevenson
Occupancy by Ownership in Stevenson
Of the total 648 dwellings in Stevenson, owner-occupied units account for 443 (68.4%), while renter-occupied units make up 205 (31.6%).
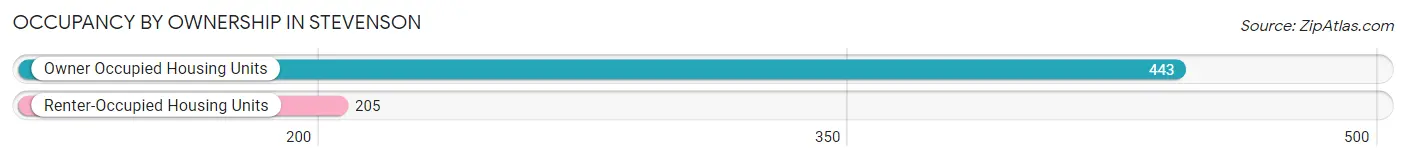
| Occupancy | # Housing Units | % Housing Units |
| Owner Occupied Housing Units | 443 | 68.4% |
| Renter-Occupied Housing Units | 205 | 31.6% |
| Total Occupied Housing Units | 648 | 100.0% |
Occupancy by Household Size in Stevenson
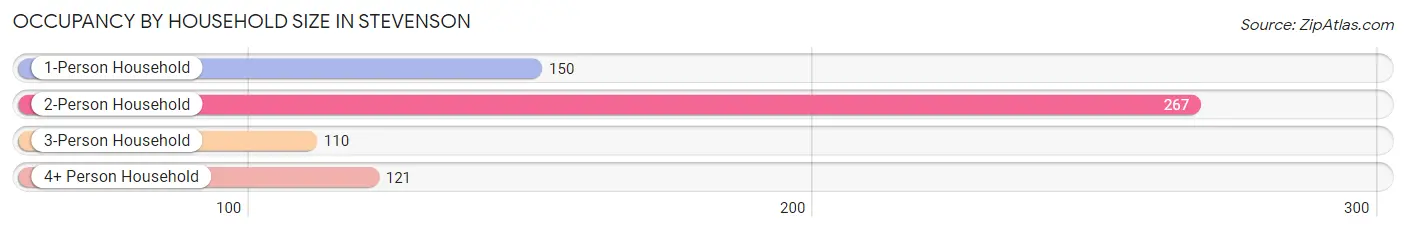
| Household Size | # Housing Units | % Housing Units |
| 1-Person Household | 150 | 23.2% |
| 2-Person Household | 267 | 41.2% |
| 3-Person Household | 110 | 17.0% |
| 4+ Person Household | 121 | 18.7% |
| Total Housing Units | 648 | 100.0% |
Occupancy by Ownership by Household Size in Stevenson
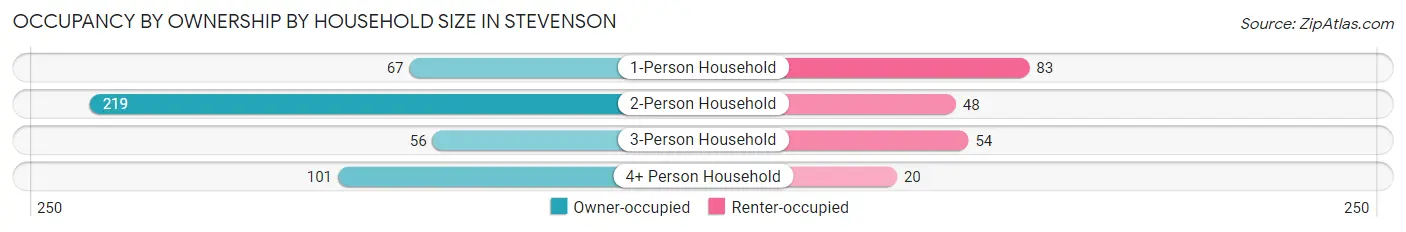
| Household Size | Owner-occupied | Renter-occupied |
| 1-Person Household | 67 (44.7%) | 83 (55.3%) |
| 2-Person Household | 219 (82.0%) | 48 (18.0%) |
| 3-Person Household | 56 (50.9%) | 54 (49.1%) |
| 4+ Person Household | 101 (83.5%) | 20 (16.5%) |
| Total Housing Units | 443 (68.4%) | 205 (31.6%) |
Occupancy by Educational Attainment in Stevenson
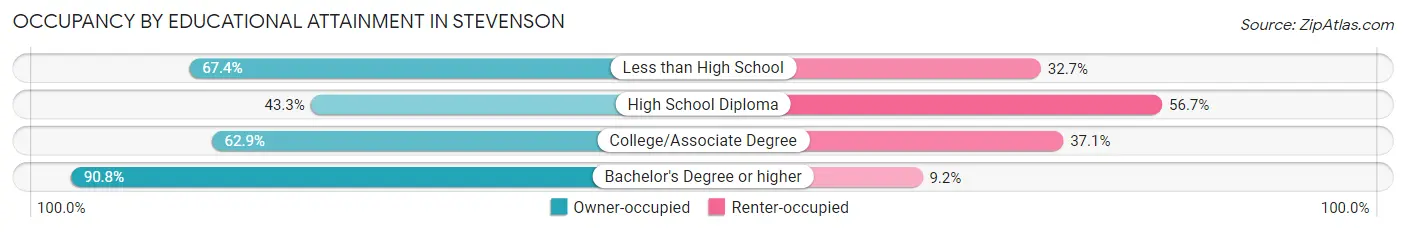
| Household Size | Owner-occupied | Renter-occupied |
| Less than High School | 33 (67.3%) | 16 (32.7%) |
| High School Diploma | 68 (43.3%) | 89 (56.7%) |
| College/Associate Degree | 134 (62.9%) | 79 (37.1%) |
| Bachelor's Degree or higher | 208 (90.8%) | 21 (9.2%) |
Occupancy by Age of Householder in Stevenson
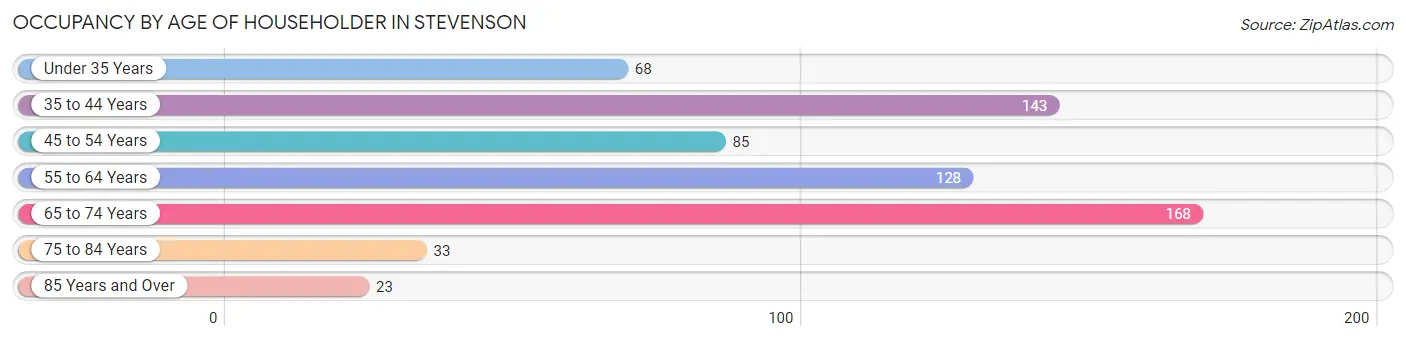
| Age Bracket | # Households | % Households |
| Under 35 Years | 68 | 10.5% |
| 35 to 44 Years | 143 | 22.1% |
| 45 to 54 Years | 85 | 13.1% |
| 55 to 64 Years | 128 | 19.8% |
| 65 to 74 Years | 168 | 25.9% |
| 75 to 84 Years | 33 | 5.1% |
| 85 Years and Over | 23 | 3.5% |
| Total | 648 | 100.0% |
Housing Finances in Stevenson
Median Income by Occupancy in Stevenson
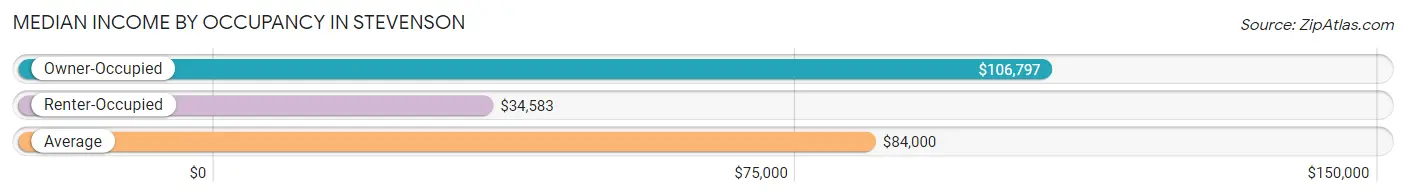
| Occupancy Type | # Households | Median Income |
| Owner-Occupied | 443 (68.4%) | $106,797 |
| Renter-Occupied | 205 (31.6%) | $34,583 |
| Average | 648 (100.0%) | $84,000 |
Occupancy by Householder Income Bracket in Stevenson
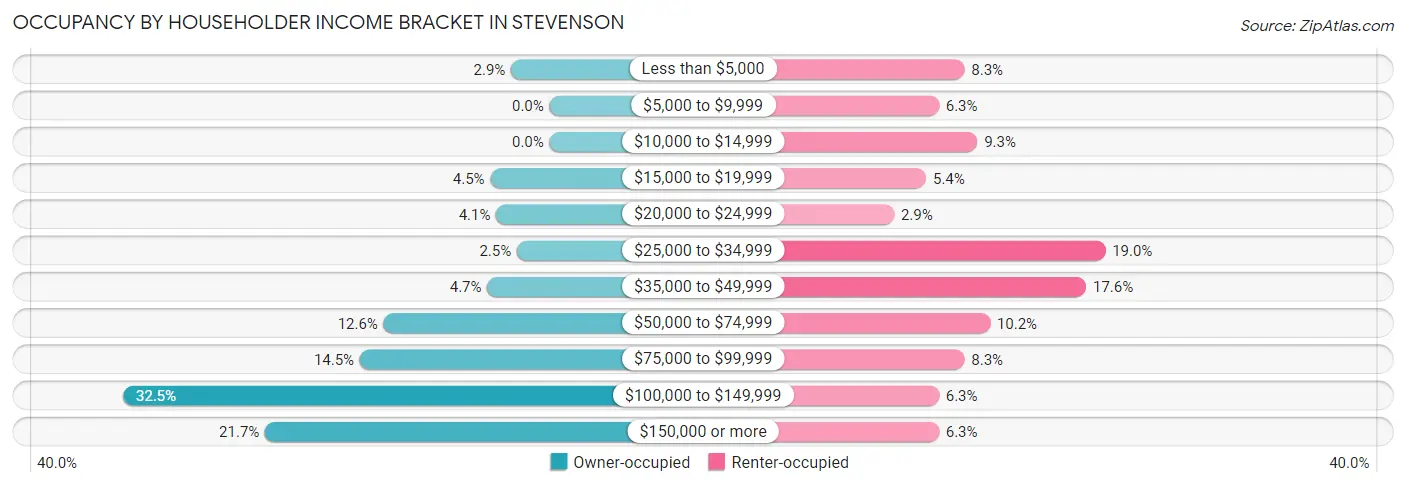
| Income Bracket | Owner-occupied | Renter-occupied |
| Less than $5,000 | 13 (2.9%) | 17 (8.3%) |
| $5,000 to $9,999 | 0 (0.0%) | 13 (6.3%) |
| $10,000 to $14,999 | 0 (0.0%) | 19 (9.3%) |
| $15,000 to $19,999 | 20 (4.5%) | 11 (5.4%) |
| $20,000 to $24,999 | 18 (4.1%) | 6 (2.9%) |
| $25,000 to $34,999 | 11 (2.5%) | 39 (19.0%) |
| $35,000 to $49,999 | 21 (4.7%) | 36 (17.6%) |
| $50,000 to $74,999 | 56 (12.6%) | 21 (10.2%) |
| $75,000 to $99,999 | 64 (14.4%) | 17 (8.3%) |
| $100,000 to $149,999 | 144 (32.5%) | 13 (6.3%) |
| $150,000 or more | 96 (21.7%) | 13 (6.3%) |
| Total | 443 (100.0%) | 205 (100.0%) |
Monthly Housing Cost Tiers in Stevenson
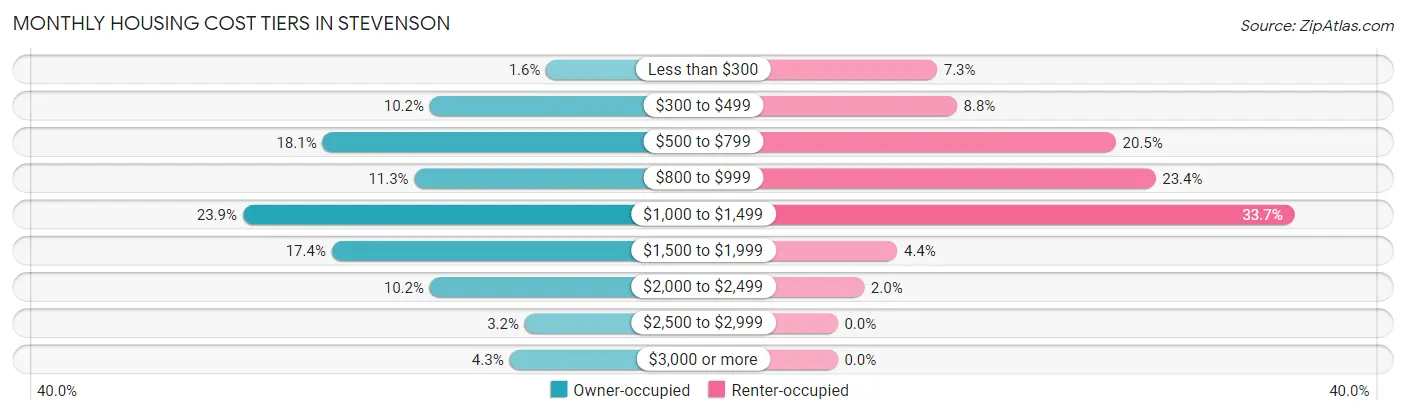
| Monthly Cost | Owner-occupied | Renter-occupied |
| Less than $300 | 7 (1.6%) | 15 (7.3%) |
| $300 to $499 | 45 (10.2%) | 18 (8.8%) |
| $500 to $799 | 80 (18.1%) | 42 (20.5%) |
| $800 to $999 | 50 (11.3%) | 48 (23.4%) |
| $1,000 to $1,499 | 106 (23.9%) | 69 (33.7%) |
| $1,500 to $1,999 | 77 (17.4%) | 9 (4.4%) |
| $2,000 to $2,499 | 45 (10.2%) | 4 (1.9%) |
| $2,500 to $2,999 | 14 (3.2%) | 0 (0.0%) |
| $3,000 or more | 19 (4.3%) | 0 (0.0%) |
| Total | 443 (100.0%) | 205 (100.0%) |
Physical Housing Characteristics in Stevenson
Housing Structures in Stevenson
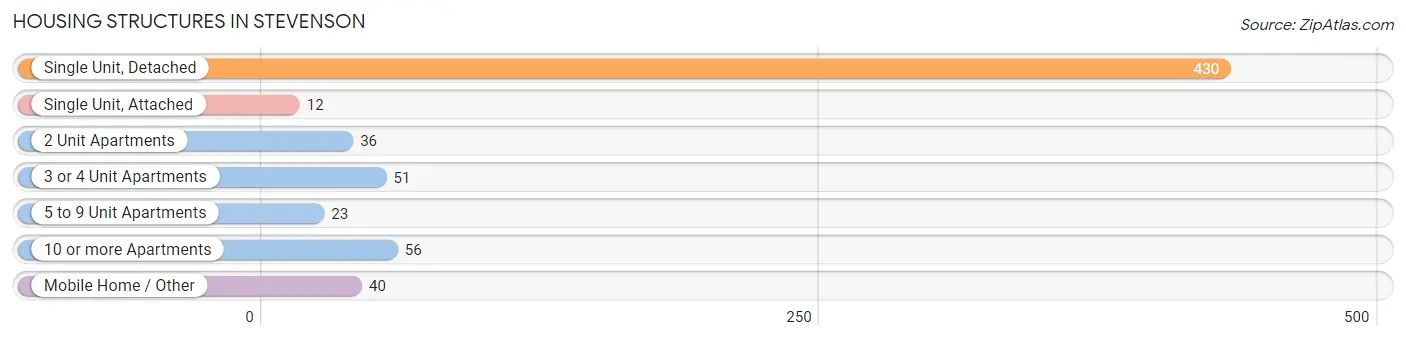
| Structure Type | # Housing Units | % Housing Units |
| Single Unit, Detached | 430 | 66.4% |
| Single Unit, Attached | 12 | 1.8% |
| 2 Unit Apartments | 36 | 5.6% |
| 3 or 4 Unit Apartments | 51 | 7.9% |
| 5 to 9 Unit Apartments | 23 | 3.5% |
| 10 or more Apartments | 56 | 8.6% |
| Mobile Home / Other | 40 | 6.2% |
| Total | 648 | 100.0% |
Housing Structures by Occupancy in Stevenson
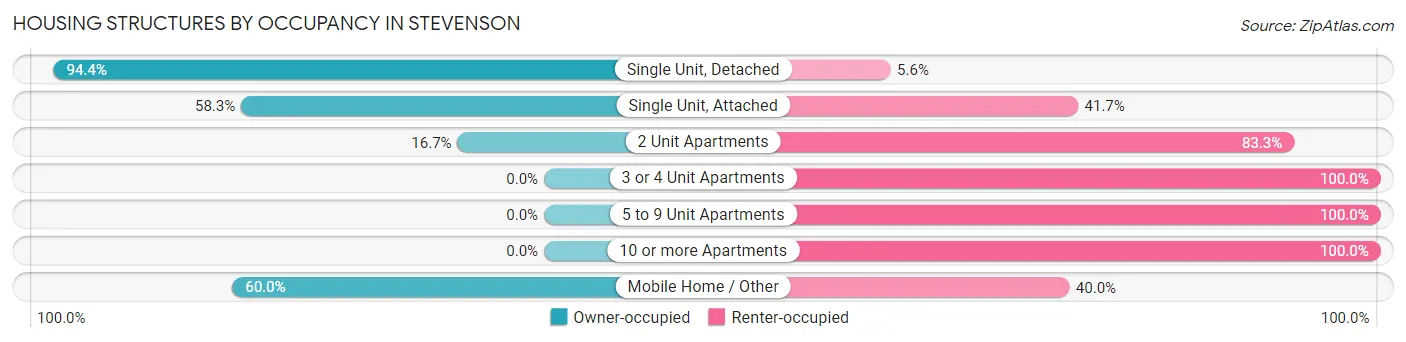
| Structure Type | Owner-occupied | Renter-occupied |
| Single Unit, Detached | 406 (94.4%) | 24 (5.6%) |
| Single Unit, Attached | 7 (58.3%) | 5 (41.7%) |
| 2 Unit Apartments | 6 (16.7%) | 30 (83.3%) |
| 3 or 4 Unit Apartments | 0 (0.0%) | 51 (100.0%) |
| 5 to 9 Unit Apartments | 0 (0.0%) | 23 (100.0%) |
| 10 or more Apartments | 0 (0.0%) | 56 (100.0%) |
| Mobile Home / Other | 24 (60.0%) | 16 (40.0%) |
| Total | 443 (68.4%) | 205 (31.6%) |
Housing Structures by Number of Rooms in Stevenson
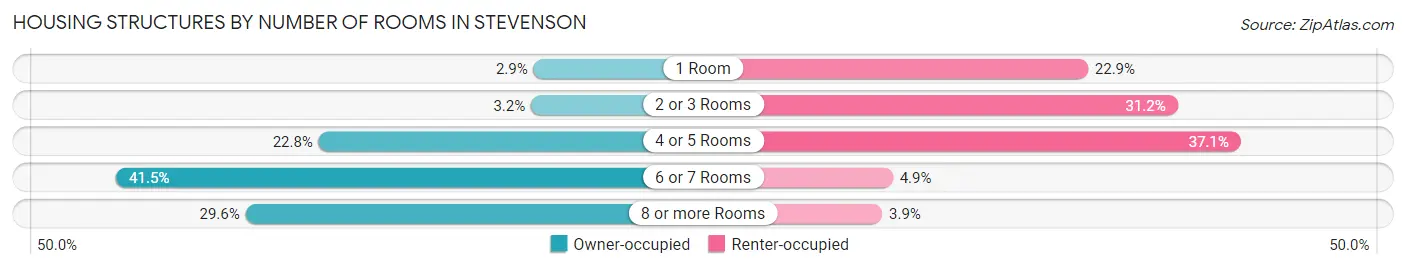
| Number of Rooms | Owner-occupied | Renter-occupied |
| 1 Room | 13 (2.9%) | 47 (22.9%) |
| 2 or 3 Rooms | 14 (3.2%) | 64 (31.2%) |
| 4 or 5 Rooms | 101 (22.8%) | 76 (37.1%) |
| 6 or 7 Rooms | 184 (41.5%) | 10 (4.9%) |
| 8 or more Rooms | 131 (29.6%) | 8 (3.9%) |
| Total | 443 (100.0%) | 205 (100.0%) |
Housing Structure by Heating Type in Stevenson
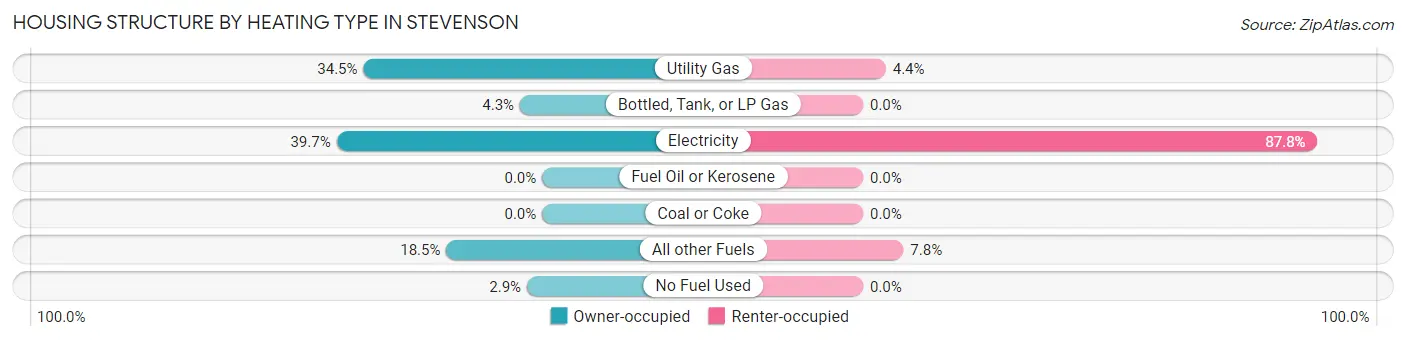
| Heating Type | Owner-occupied | Renter-occupied |
| Utility Gas | 153 (34.5%) | 9 (4.4%) |
| Bottled, Tank, or LP Gas | 19 (4.3%) | 0 (0.0%) |
| Electricity | 176 (39.7%) | 180 (87.8%) |
| Fuel Oil or Kerosene | 0 (0.0%) | 0 (0.0%) |
| Coal or Coke | 0 (0.0%) | 0 (0.0%) |
| All other Fuels | 82 (18.5%) | 16 (7.8%) |
| No Fuel Used | 13 (2.9%) | 0 (0.0%) |
| Total | 443 (100.0%) | 205 (100.0%) |
Household Vehicle Usage in Stevenson
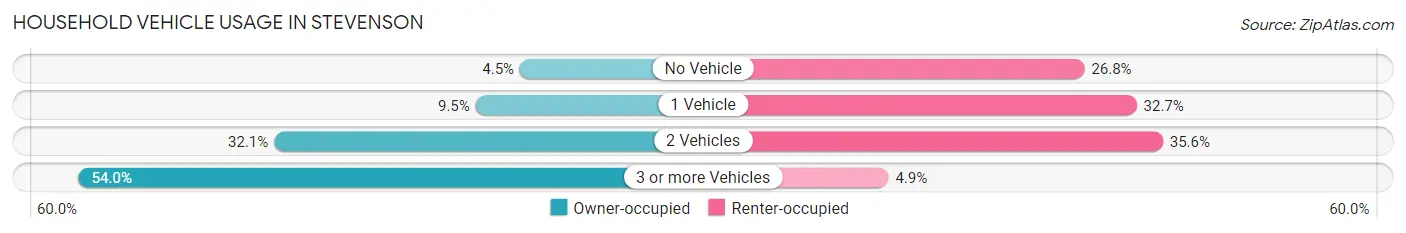
| Vehicles per Household | Owner-occupied | Renter-occupied |
| No Vehicle | 20 (4.5%) | 55 (26.8%) |
| 1 Vehicle | 42 (9.5%) | 67 (32.7%) |
| 2 Vehicles | 142 (32.1%) | 73 (35.6%) |
| 3 or more Vehicles | 239 (53.9%) | 10 (4.9%) |
| Total | 443 (100.0%) | 205 (100.0%) |
Real Estate & Mortgages in Stevenson
Real Estate and Mortgage Overview in Stevenson
| Characteristic | Without Mortgage | With Mortgage |
| Housing Units | 204 | 239 |
| Median Property Value | $431,600 | $449,400 |
| Median Household Income | $85,000 | $52 |
| Monthly Housing Costs | $719 | $19 |
| Real Estate Taxes | $3,536 | $13 |
Property Value by Mortgage Status in Stevenson
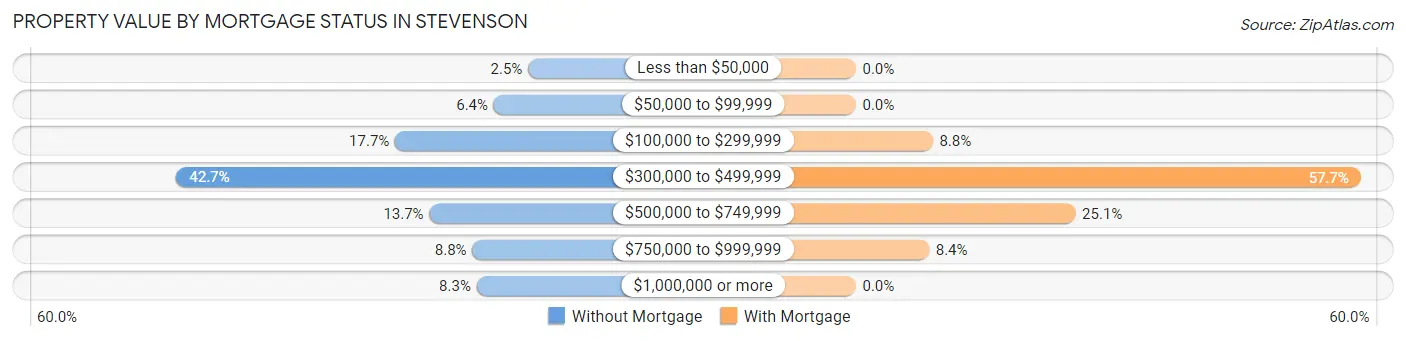
| Property Value | Without Mortgage | With Mortgage |
| Less than $50,000 | 5 (2.5%) | 0 (0.0%) |
| $50,000 to $99,999 | 13 (6.4%) | 0 (0.0%) |
| $100,000 to $299,999 | 36 (17.6%) | 21 (8.8%) |
| $300,000 to $499,999 | 87 (42.6%) | 138 (57.7%) |
| $500,000 to $749,999 | 28 (13.7%) | 60 (25.1%) |
| $750,000 to $999,999 | 18 (8.8%) | 20 (8.4%) |
| $1,000,000 or more | 17 (8.3%) | 0 (0.0%) |
| Total | 204 (100.0%) | 239 (100.0%) |
Household Income by Mortgage Status in Stevenson
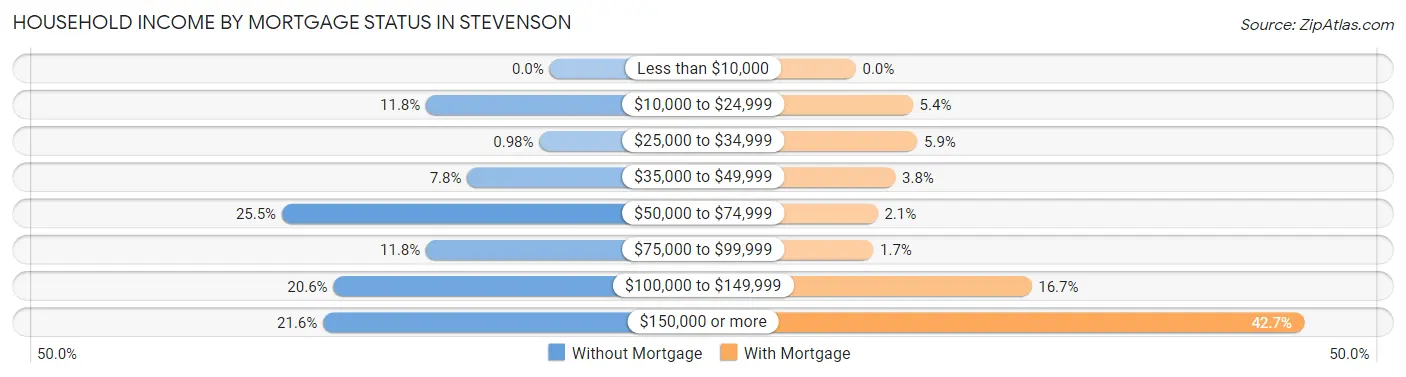
| Household Income | Without Mortgage | With Mortgage |
| Less than $10,000 | 0 (0.0%) | 0 (0.0%) |
| $10,000 to $24,999 | 24 (11.8%) | 13 (5.4%) |
| $25,000 to $34,999 | 2 (1.0%) | 14 (5.9%) |
| $35,000 to $49,999 | 16 (7.8%) | 9 (3.8%) |
| $50,000 to $74,999 | 52 (25.5%) | 5 (2.1%) |
| $75,000 to $99,999 | 24 (11.8%) | 4 (1.7%) |
| $100,000 to $149,999 | 42 (20.6%) | 40 (16.7%) |
| $150,000 or more | 44 (21.6%) | 102 (42.7%) |
| Total | 204 (100.0%) | 239 (100.0%) |
Property Value to Household Income Ratio in Stevenson
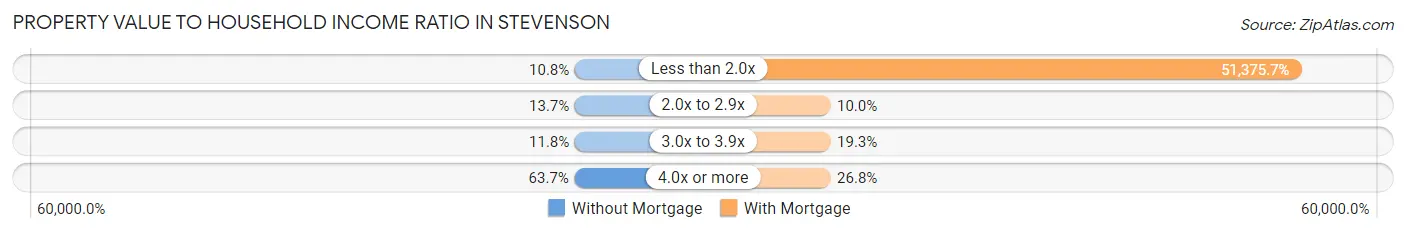
| Value-to-Income Ratio | Without Mortgage | With Mortgage |
| Less than 2.0x | 22 (10.8%) | 122,788 (51,375.7%) |
| 2.0x to 2.9x | 28 (13.7%) | 24 (10.0%) |
| 3.0x to 3.9x | 24 (11.8%) | 46 (19.3%) |
| 4.0x or more | 130 (63.7%) | 64 (26.8%) |
| Total | 204 (100.0%) | 239 (100.0%) |
Real Estate Taxes by Mortgage Status in Stevenson
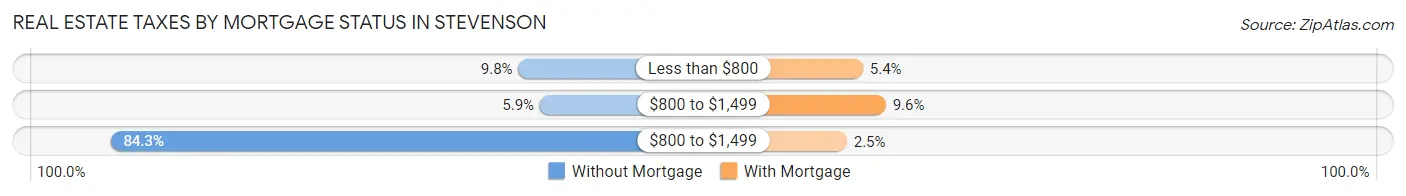
| Property Taxes | Without Mortgage | With Mortgage |
| Less than $800 | 20 (9.8%) | 13 (5.4%) |
| $800 to $1,499 | 12 (5.9%) | 23 (9.6%) |
| $800 to $1,499 | 172 (84.3%) | 6 (2.5%) |
| Total | 204 (100.0%) | 239 (100.0%) |
Health & Disability in Stevenson
Health Insurance Coverage by Age in Stevenson
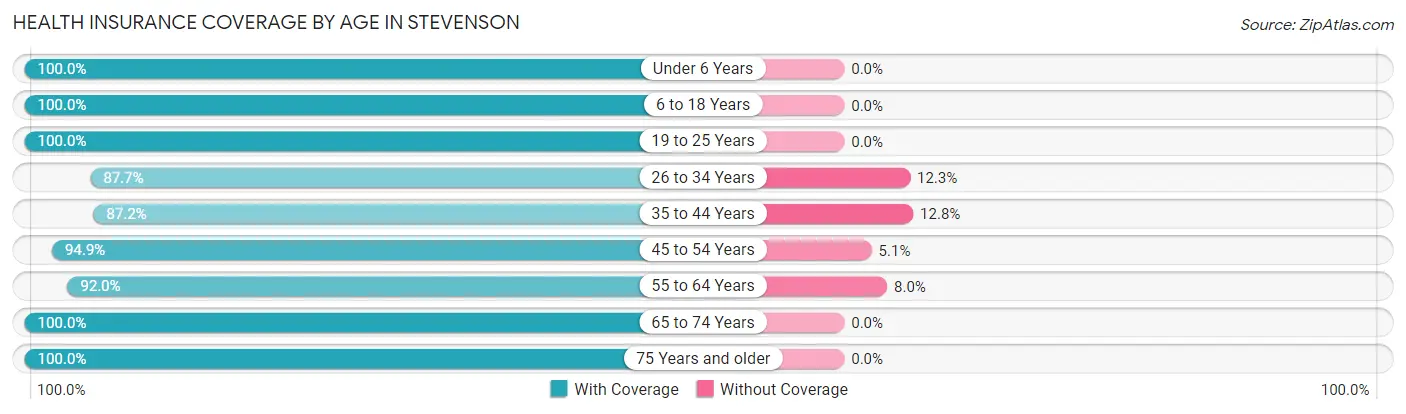
| Age Bracket | With Coverage | Without Coverage |
| Under 6 Years | 75 (100.0%) | 0 (0.0%) |
| 6 to 18 Years | 297 (100.0%) | 0 (0.0%) |
| 19 to 25 Years | 146 (100.0%) | 0 (0.0%) |
| 26 to 34 Years | 93 (87.7%) | 13 (12.3%) |
| 35 to 44 Years | 190 (87.2%) | 28 (12.8%) |
| 45 to 54 Years | 186 (94.9%) | 10 (5.1%) |
| 55 to 64 Years | 196 (92.0%) | 17 (8.0%) |
| 65 to 74 Years | 303 (100.0%) | 0 (0.0%) |
| 75 Years and older | 98 (100.0%) | 0 (0.0%) |
| Total | 1,584 (95.9%) | 68 (4.1%) |
Health Insurance Coverage by Citizenship Status in Stevenson
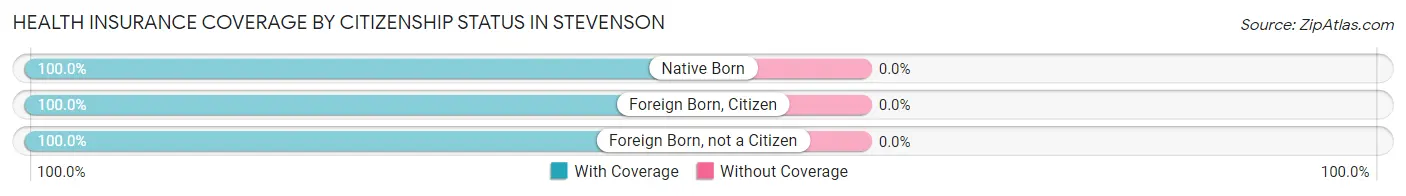
| Citizenship Status | With Coverage | Without Coverage |
| Native Born | 75 (100.0%) | 0 (0.0%) |
| Foreign Born, Citizen | 297 (100.0%) | 0 (0.0%) |
| Foreign Born, not a Citizen | 146 (100.0%) | 0 (0.0%) |
Health Insurance Coverage by Household Income in Stevenson
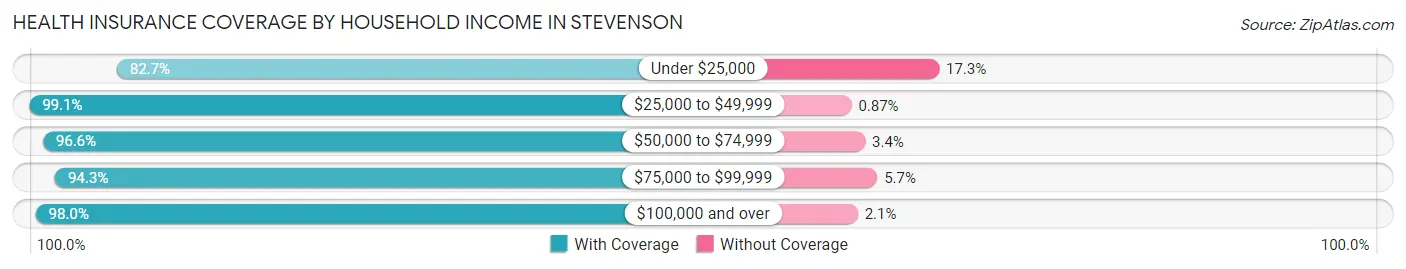
| Household Income | With Coverage | Without Coverage |
| Under $25,000 | 134 (82.7%) | 28 (17.3%) |
| $25,000 to $49,999 | 228 (99.1%) | 2 (0.9%) |
| $50,000 to $74,999 | 197 (96.6%) | 7 (3.4%) |
| $75,000 to $99,999 | 248 (94.3%) | 15 (5.7%) |
| $100,000 and over | 765 (98.0%) | 16 (2.1%) |
Public vs Private Health Insurance Coverage by Age in Stevenson
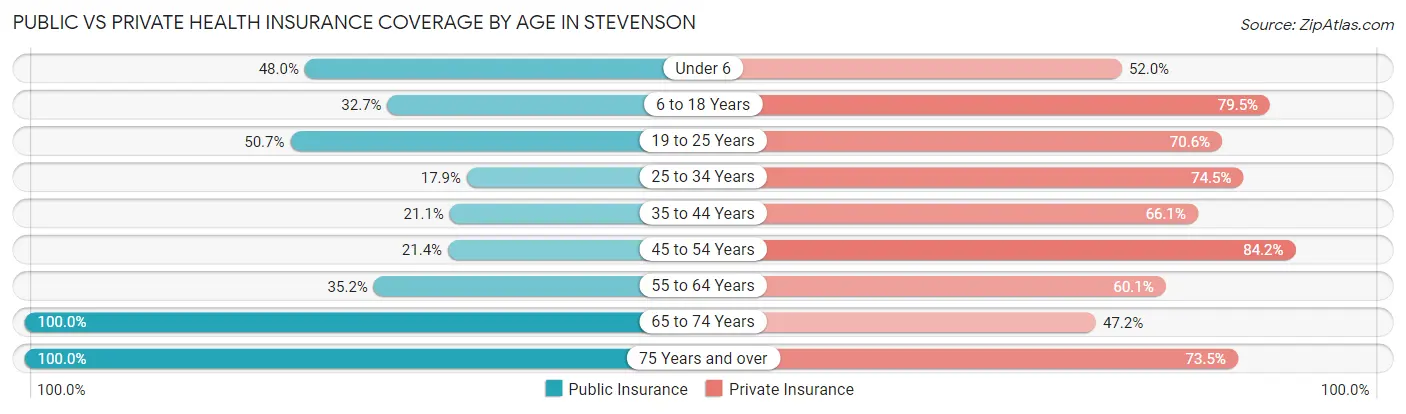
| Age Bracket | Public Insurance | Private Insurance |
| Under 6 | 36 (48.0%) | 39 (52.0%) |
| 6 to 18 Years | 97 (32.7%) | 236 (79.5%) |
| 19 to 25 Years | 74 (50.7%) | 103 (70.6%) |
| 25 to 34 Years | 19 (17.9%) | 79 (74.5%) |
| 35 to 44 Years | 46 (21.1%) | 144 (66.1%) |
| 45 to 54 Years | 42 (21.4%) | 165 (84.2%) |
| 55 to 64 Years | 75 (35.2%) | 128 (60.1%) |
| 65 to 74 Years | 303 (100.0%) | 143 (47.2%) |
| 75 Years and over | 98 (100.0%) | 72 (73.5%) |
| Total | 790 (47.8%) | 1,109 (67.1%) |
Disability Status by Sex by Age in Stevenson
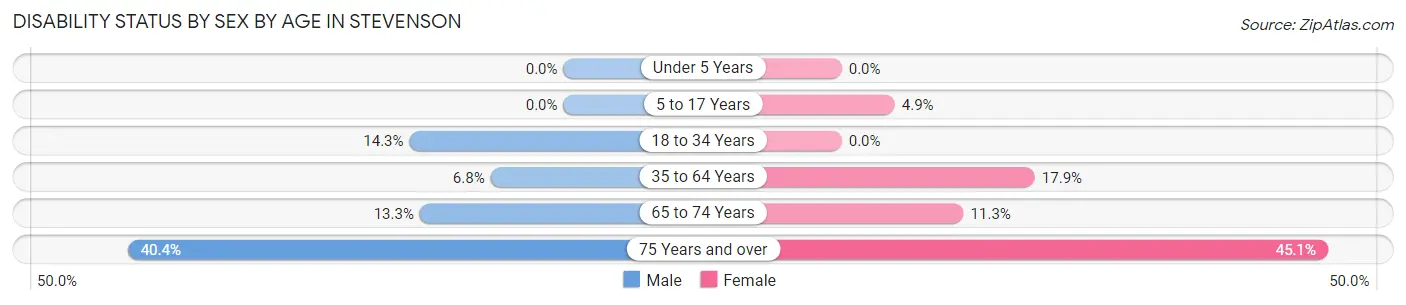
| Age Bracket | Male | Female |
| Under 5 Years | 0 (0.0%) | 0 (0.0%) |
| 5 to 17 Years | 0 (0.0%) | 9 (4.9%) |
| 18 to 34 Years | 27 (14.3%) | 0 (0.0%) |
| 35 to 64 Years | 19 (6.8%) | 62 (17.9%) |
| 65 to 74 Years | 18 (13.3%) | 19 (11.3%) |
| 75 Years and over | 19 (40.4%) | 23 (45.1%) |
Disability Class by Sex by Age in Stevenson
Disability Class: Hearing Difficulty
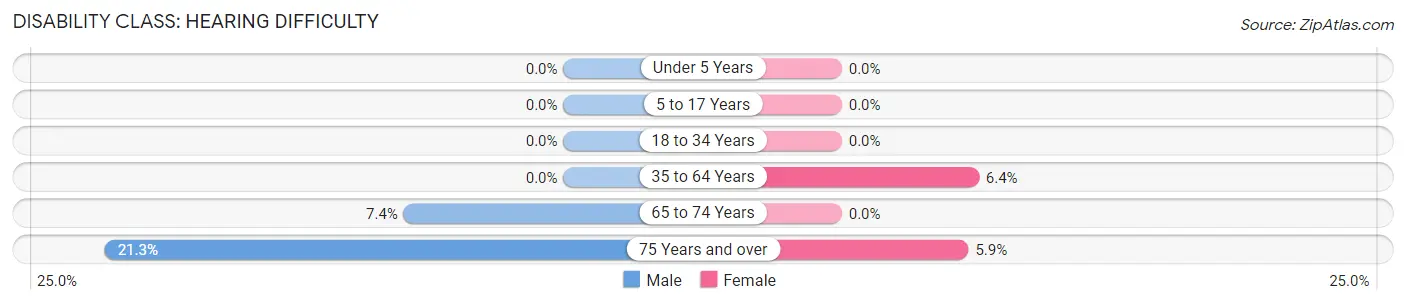
| Age Bracket | Male | Female |
| Under 5 Years | 0 (0.0%) | 0 (0.0%) |
| 5 to 17 Years | 0 (0.0%) | 0 (0.0%) |
| 18 to 34 Years | 0 (0.0%) | 0 (0.0%) |
| 35 to 64 Years | 0 (0.0%) | 22 (6.4%) |
| 65 to 74 Years | 10 (7.4%) | 0 (0.0%) |
| 75 Years and over | 10 (21.3%) | 3 (5.9%) |
Disability Class: Vision Difficulty
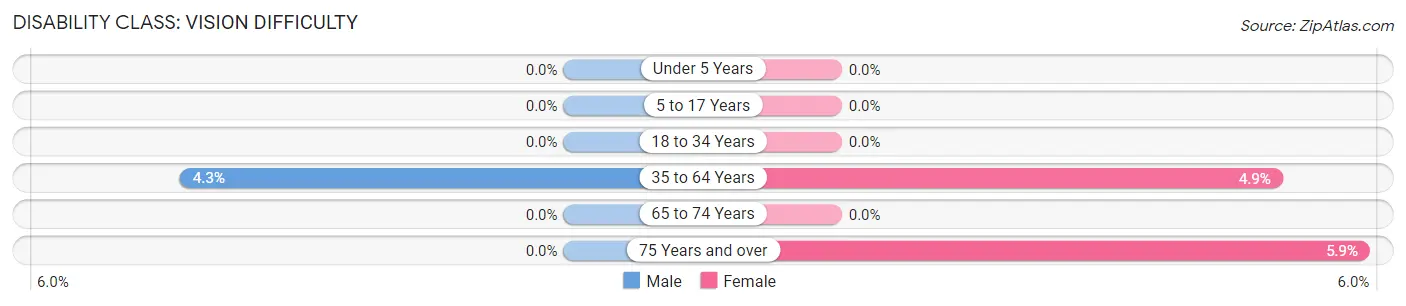
| Age Bracket | Male | Female |
| Under 5 Years | 0 (0.0%) | 0 (0.0%) |
| 5 to 17 Years | 0 (0.0%) | 0 (0.0%) |
| 18 to 34 Years | 0 (0.0%) | 0 (0.0%) |
| 35 to 64 Years | 12 (4.3%) | 17 (4.9%) |
| 65 to 74 Years | 0 (0.0%) | 0 (0.0%) |
| 75 Years and over | 0 (0.0%) | 3 (5.9%) |
Disability Class: Cognitive Difficulty
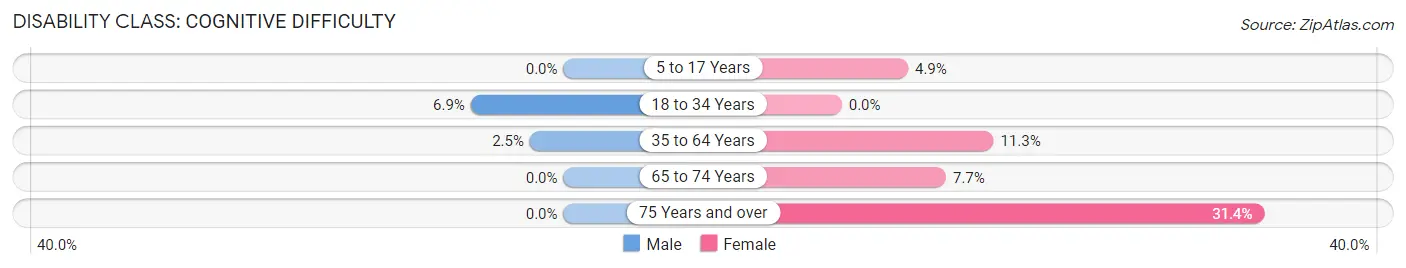
| Age Bracket | Male | Female |
| 5 to 17 Years | 0 (0.0%) | 9 (4.9%) |
| 18 to 34 Years | 13 (6.9%) | 0 (0.0%) |
| 35 to 64 Years | 7 (2.5%) | 39 (11.3%) |
| 65 to 74 Years | 0 (0.0%) | 13 (7.7%) |
| 75 Years and over | 0 (0.0%) | 16 (31.4%) |
Disability Class: Ambulatory Difficulty
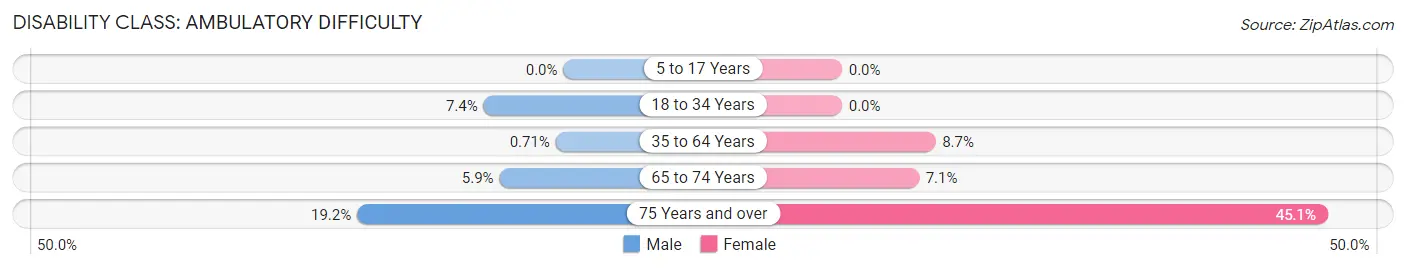
| Age Bracket | Male | Female |
| 5 to 17 Years | 0 (0.0%) | 0 (0.0%) |
| 18 to 34 Years | 14 (7.4%) | 0 (0.0%) |
| 35 to 64 Years | 2 (0.7%) | 30 (8.7%) |
| 65 to 74 Years | 8 (5.9%) | 12 (7.1%) |
| 75 Years and over | 9 (19.2%) | 23 (45.1%) |
Disability Class: Self-Care Difficulty
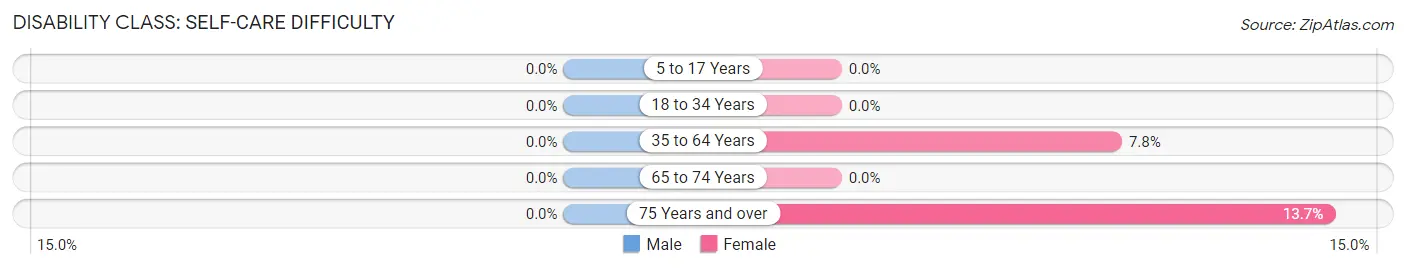
| Age Bracket | Male | Female |
| 5 to 17 Years | 0 (0.0%) | 0 (0.0%) |
| 18 to 34 Years | 0 (0.0%) | 0 (0.0%) |
| 35 to 64 Years | 0 (0.0%) | 27 (7.8%) |
| 65 to 74 Years | 0 (0.0%) | 0 (0.0%) |
| 75 Years and over | 0 (0.0%) | 7 (13.7%) |
Technology Access in Stevenson
Computing Device Access in Stevenson
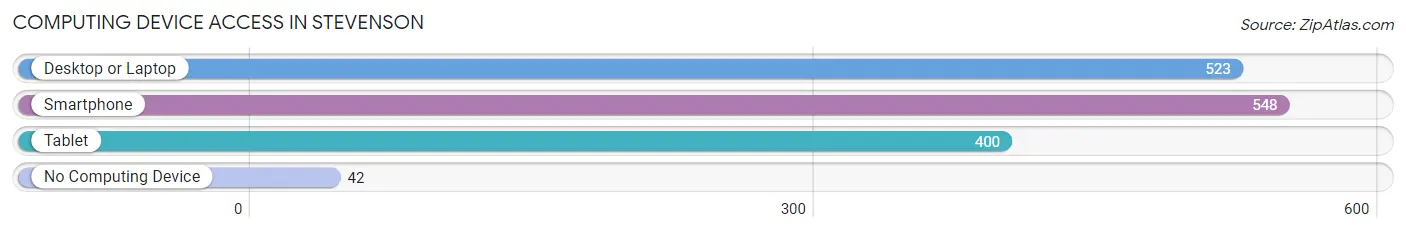
| Device Type | # Households | % Households |
| Desktop or Laptop | 523 | 80.7% |
| Smartphone | 548 | 84.6% |
| Tablet | 400 | 61.7% |
| No Computing Device | 42 | 6.5% |
| Total | 648 | 100.0% |
Internet Access in Stevenson
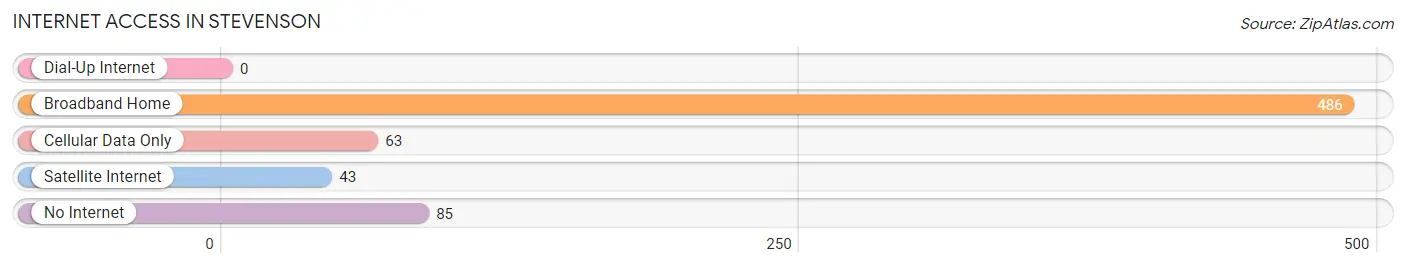
| Internet Type | # Households | % Households |
| Dial-Up Internet | 0 | 0.0% |
| Broadband Home | 486 | 75.0% |
| Cellular Data Only | 63 | 9.7% |
| Satellite Internet | 43 | 6.6% |
| No Internet | 85 | 13.1% |
| Total | 648 | 100.0% |
Stevenson Summary
Stevenson, Washington is a small town located in the Columbia River Gorge in Skamania County, Washington. It is situated on the north bank of the Columbia River, just east of the Cascade Mountains. The town is located about 30 miles east of Vancouver, Washington and about 70 miles east of Portland, Oregon. The population of Stevenson was 1,719 at the 2010 census.
History
The area around Stevenson was first inhabited by Native American tribes, including the Klickitat, Yakama, and Chinook. The first European settlers arrived in the area in the late 1800s, and the town of Stevenson was officially incorporated in 1891. The town was named after the Stevenson family, who were among the first settlers in the area.
The town of Stevenson was originally a logging and fishing community, and the Columbia River was an important transportation route for the lumber industry. In the early 1900s, the town became a popular tourist destination, and the Columbia River Gorge Scenic Highway was built in 1915, connecting Stevenson to Portland and Vancouver.
Geography
Stevenson is located in the Columbia River Gorge, a deep canyon carved by the Columbia River. The town is situated on the north bank of the river, just east of the Cascade Mountains. The town is surrounded by lush forests and is home to several parks, including Beacon Rock State Park and the Columbia Gorge National Scenic Area.
The climate in Stevenson is mild and temperate, with warm summers and cool winters. The average annual temperature is around 50 degrees Fahrenheit, and the average annual precipitation is around 30 inches.
Economy
The economy of Stevenson is largely based on tourism and recreation. The town is a popular destination for outdoor activities, such as fishing, hiking, and camping. The Columbia River Gorge Scenic Highway is a popular tourist attraction, and the town is home to several wineries and breweries.
The town is also home to several businesses, including restaurants, retail stores, and hotels. The town is also home to several manufacturing companies, including a paper mill and a wood products plant.
Demographics
As of the 2010 census, the population of Stevenson was 1,719. The racial makeup of the town was 94.3% White, 0.7% African American, 0.7% Native American, 0.7% Asian, 0.2% Pacific Islander, and 2.6% from other races. The median household income was $41,250, and the median family income was $50,000.
The town is home to several churches, including the First Presbyterian Church, the Church of Jesus Christ of Latter-day Saints, and the United Methodist Church. The town is also home to several schools, including Stevenson Elementary School, Stevenson Middle School, and Stevenson High School.
Common Questions
What is Per Capita Income in Stevenson?
Per Capita income in Stevenson is $35,508.
What is the Median Family Income in Stevenson?
Median Family Income in Stevenson is $96,979.
What is the Median Household income in Stevenson?
Median Household Income in Stevenson is $84,000.
What is Income or Wage Gap in Stevenson?
Income or Wage Gap in Stevenson is 38.0%.
Women in Stevenson earn 62.0 cents for every dollar earned by a man.
What is Inequality or Gini Index in Stevenson?
Inequality or Gini Index in Stevenson is 0.40.
What is the Total Population of Stevenson?
Total Population of Stevenson is 1,697.
What is the Total Male Population of Stevenson?
Total Male Population of Stevenson is 842.
What is the Total Female Population of Stevenson?
Total Female Population of Stevenson is 855.
What is the Ratio of Males per 100 Females in Stevenson?
There are 98.48 Males per 100 Females in Stevenson.
What is the Ratio of Females per 100 Males in Stevenson?
There are 101.54 Females per 100 Males in Stevenson.
What is the Median Population Age in Stevenson?
Median Population Age in Stevenson is 42.6 Years.
What is the Average Family Size in Stevenson
Average Family Size in Stevenson is 3.0 People.
What is the Average Household Size in Stevenson
Average Household Size in Stevenson is 2.5 People.
How Large is the Labor Force in Stevenson?
There are 740 People in the Labor Forcein in Stevenson.
What is the Percentage of People in the Labor Force in Stevenson?
53.3% of People are in the Labor Force in Stevenson.
What is the Unemployment Rate in Stevenson?
Unemployment Rate in Stevenson is 2.7%.