Cities with the Most Immigrants from El Salvador in Washington
RELATED REPORTS & OPTIONS
El Salvador
Washington
Compare Cities
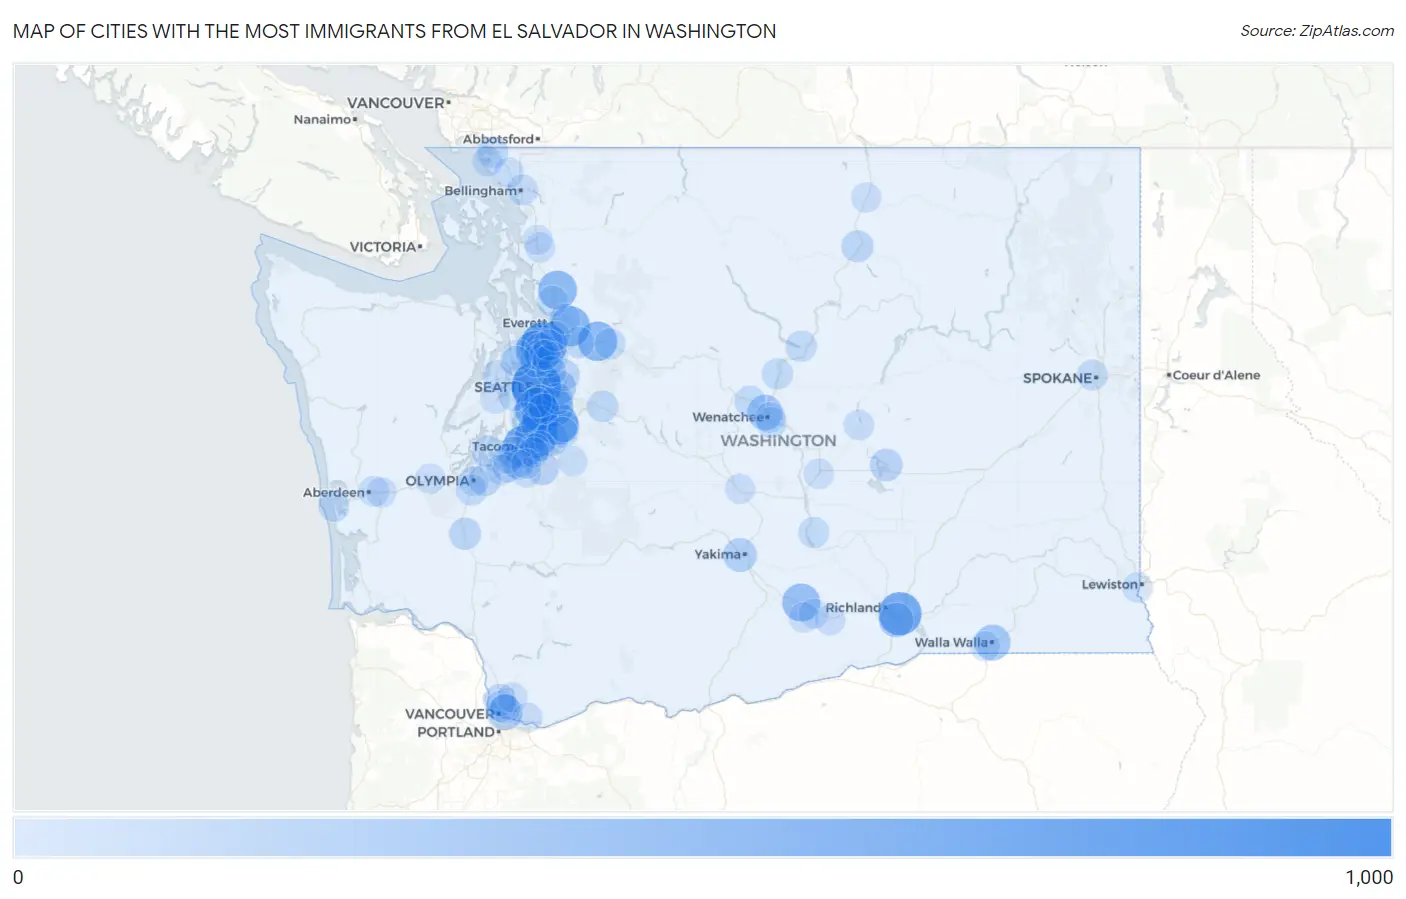
Map of Cities with the Most Immigrants from El Salvador in Washington
0
1,000
Cities with the Most Immigrants from El Salvador in Washington
| City | El Salvador | vs State | vs National | |
| 1. | Seattle | 925 | 13,745(6.73%)#1 | 1,408,349(0.07%)#242 |
| 2. | North Lynnwood | 753 | 13,745(5.48%)#2 | 1,408,349(0.05%)#286 |
| 3. | Pasco | 618 | 13,745(4.50%)#3 | 1,408,349(0.04%)#331 |
| 4. | Federal Way | 574 | 13,745(4.18%)#4 | 1,408,349(0.04%)#354 |
| 5. | Burien | 570 | 13,745(4.15%)#5 | 1,408,349(0.04%)#356 |
| 6. | Kent | 541 | 13,745(3.94%)#6 | 1,408,349(0.04%)#374 |
| 7. | Tacoma | 537 | 13,745(3.91%)#7 | 1,408,349(0.04%)#381 |
| 8. | Everett | 474 | 13,745(3.45%)#8 | 1,408,349(0.03%)#418 |
| 9. | Sultan | 437 | 13,745(3.18%)#9 | 1,408,349(0.03%)#448 |
| 10. | Seatac | 431 | 13,745(3.14%)#10 | 1,408,349(0.03%)#454 |
| 11. | Renton | 417 | 13,745(3.03%)#11 | 1,408,349(0.03%)#463 |
| 12. | Arlington | 412 | 13,745(3.00%)#12 | 1,408,349(0.03%)#470 |
| 13. | Edmonds | 408 | 13,745(2.97%)#13 | 1,408,349(0.03%)#481 |
| 14. | Sunnyside | 373 | 13,745(2.71%)#14 | 1,408,349(0.03%)#530 |
| 15. | Des Moines | 355 | 13,745(2.58%)#15 | 1,408,349(0.03%)#552 |
| 16. | Walla Walla | 276 | 13,745(2.01%)#16 | 1,408,349(0.02%)#690 |
| 17. | Wenatchee | 250 | 13,745(1.82%)#17 | 1,408,349(0.02%)#736 |
| 18. | Vancouver | 246 | 13,745(1.79%)#18 | 1,408,349(0.02%)#745 |
| 19. | Bellevue | 224 | 13,745(1.63%)#19 | 1,408,349(0.02%)#795 |
| 20. | Kennewick | 215 | 13,745(1.56%)#20 | 1,408,349(0.02%)#816 |
| 21. | Auburn | 194 | 13,745(1.41%)#21 | 1,408,349(0.01%)#863 |
| 22. | Yakima | 175 | 13,745(1.27%)#22 | 1,408,349(0.01%)#927 |
| 23. | Lakewood | 127 | 13,745(0.92%)#23 | 1,408,349(0.01%)#1,138 |
| 24. | Moses Lake | 125 | 13,745(0.91%)#24 | 1,408,349(0.01%)#1,149 |
| 25. | Boulevard Park | 122 | 13,745(0.89%)#25 | 1,408,349(0.01%)#1,162 |
| 26. | South Hill | 121 | 13,745(0.88%)#26 | 1,408,349(0.01%)#1,165 |
| 27. | Lynnwood | 119 | 13,745(0.87%)#27 | 1,408,349(0.01%)#1,181 |
| 28. | Lacey | 104 | 13,745(0.76%)#28 | 1,408,349(0.01%)#1,270 |
| 29. | Shoreline | 102 | 13,745(0.74%)#29 | 1,408,349(0.01%)#1,283 |
| 30. | Omak | 99 | 13,745(0.72%)#30 | 1,408,349(0.01%)#1,312 |
| 31. | Centralia | 96 | 13,745(0.70%)#31 | 1,408,349(0.01%)#1,334 |
| 32. | Salmon Creek | 95 | 13,745(0.69%)#32 | 1,408,349(0.01%)#1,344 |
| 33. | University Place | 94 | 13,745(0.68%)#33 | 1,408,349(0.01%)#1,350 |
| 34. | Redmond | 86 | 13,745(0.63%)#34 | 1,408,349(0.01%)#1,419 |
| 35. | Mountlake Terrace | 82 | 13,745(0.60%)#35 | 1,408,349(0.01%)#1,455 |
| 36. | Blaine | 80 | 13,745(0.58%)#36 | 1,408,349(0.01%)#1,481 |
| 37. | Hazel Dell | 77 | 13,745(0.56%)#37 | 1,408,349(0.01%)#1,505 |
| 38. | Covington | 73 | 13,745(0.53%)#38 | 1,408,349(0.01%)#1,541 |
| 39. | Monroe | 72 | 13,745(0.52%)#39 | 1,408,349(0.01%)#1,555 |
| 40. | North Bend | 72 | 13,745(0.52%)#40 | 1,408,349(0.01%)#1,558 |
| 41. | Newcastle | 71 | 13,745(0.52%)#41 | 1,408,349(0.01%)#1,573 |
| 42. | Longbranch | 69 | 13,745(0.50%)#42 | 1,408,349(0.00%)#1,595 |
| 43. | Chelan | 68 | 13,745(0.49%)#43 | 1,408,349(0.00%)#1,610 |
| 44. | Cashmere | 66 | 13,745(0.48%)#44 | 1,408,349(0.00%)#1,641 |
| 45. | Kenmore | 65 | 13,745(0.47%)#45 | 1,408,349(0.00%)#1,651 |
| 46. | Gold Bar | 61 | 13,745(0.44%)#46 | 1,408,349(0.00%)#1,720 |
| 47. | Entiat | 56 | 13,745(0.41%)#47 | 1,408,349(0.00%)#1,794 |
| 48. | Bothell | 54 | 13,745(0.39%)#48 | 1,408,349(0.00%)#1,815 |
| 49. | Tumwater | 54 | 13,745(0.39%)#49 | 1,408,349(0.00%)#1,819 |
| 50. | Lake Morton Berrydale | 54 | 13,745(0.39%)#50 | 1,408,349(0.00%)#1,822 |
| 51. | Mattawa | 54 | 13,745(0.39%)#51 | 1,408,349(0.00%)#1,829 |
| 52. | Marysville | 53 | 13,745(0.39%)#52 | 1,408,349(0.00%)#1,831 |
| 53. | Martha Lake | 52 | 13,745(0.38%)#53 | 1,408,349(0.00%)#1,852 |
| 54. | Kingston | 52 | 13,745(0.38%)#54 | 1,408,349(0.00%)#1,859 |
| 55. | South Wenatchee | 52 | 13,745(0.38%)#55 | 1,408,349(0.00%)#1,861 |
| 56. | Westport | 51 | 13,745(0.37%)#56 | 1,408,349(0.00%)#1,877 |
| 57. | East Wenatchee | 45 | 13,745(0.33%)#57 | 1,408,349(0.00%)#1,977 |
| 58. | Spokane | 41 | 13,745(0.30%)#58 | 1,408,349(0.00%)#2,035 |
| 59. | Bellingham | 41 | 13,745(0.30%)#59 | 1,408,349(0.00%)#2,036 |
| 60. | White Center | 35 | 13,745(0.25%)#60 | 1,408,349(0.00%)#2,185 |
| 61. | Dupont | 35 | 13,745(0.25%)#61 | 1,408,349(0.00%)#2,187 |
| 62. | Lakeview | 33 | 13,745(0.24%)#62 | 1,408,349(0.00%)#2,235 |
| 63. | Birch Bay | 32 | 13,745(0.23%)#63 | 1,408,349(0.00%)#2,247 |
| 64. | Silverdale | 29 | 13,745(0.21%)#64 | 1,408,349(0.00%)#2,331 |
| 65. | Aberdeen | 29 | 13,745(0.21%)#65 | 1,408,349(0.00%)#2,334 |
| 66. | West Clarkston Highland | 27 | 13,745(0.20%)#66 | 1,408,349(0.00%)#2,393 |
| 67. | Kirkland | 26 | 13,745(0.19%)#67 | 1,408,349(0.00%)#2,402 |
| 68. | Fife | 25 | 13,745(0.18%)#68 | 1,408,349(0.00%)#2,453 |
| 69. | Indianola | 25 | 13,745(0.18%)#69 | 1,408,349(0.00%)#2,461 |
| 70. | Tukwila | 24 | 13,745(0.17%)#70 | 1,408,349(0.00%)#2,476 |
| 71. | Lake Stevens | 23 | 13,745(0.17%)#71 | 1,408,349(0.00%)#2,514 |
| 72. | George | 23 | 13,745(0.17%)#72 | 1,408,349(0.00%)#2,548 |
| 73. | Central Park | 22 | 13,745(0.16%)#73 | 1,408,349(0.00%)#2,579 |
| 74. | Bremerton | 20 | 13,745(0.15%)#74 | 1,408,349(0.00%)#2,639 |
| 75. | College Place | 20 | 13,745(0.15%)#75 | 1,408,349(0.00%)#2,658 |
| 76. | Milton | 20 | 13,745(0.15%)#76 | 1,408,349(0.00%)#2,660 |
| 77. | Ferndale | 19 | 13,745(0.14%)#77 | 1,408,349(0.00%)#2,701 |
| 78. | Mccleary | 19 | 13,745(0.14%)#78 | 1,408,349(0.00%)#2,714 |
| 79. | Spanaway | 18 | 13,745(0.13%)#79 | 1,408,349(0.00%)#2,739 |
| 80. | Ellensburg | 18 | 13,745(0.13%)#80 | 1,408,349(0.00%)#2,748 |
| 81. | Mabton | 18 | 13,745(0.13%)#81 | 1,408,349(0.00%)#2,761 |
| 82. | Buckley | 17 | 13,745(0.12%)#82 | 1,408,349(0.00%)#2,798 |
| 83. | Brush Prairie | 17 | 13,745(0.12%)#83 | 1,408,349(0.00%)#2,802 |
| 84. | Prosser | 16 | 13,745(0.12%)#84 | 1,408,349(0.00%)#2,837 |
| 85. | Mount Vernon | 15 | 13,745(0.11%)#85 | 1,408,349(0.00%)#2,863 |
| 86. | Grandview | 15 | 13,745(0.11%)#86 | 1,408,349(0.00%)#2,886 |
| 87. | Waller | 15 | 13,745(0.11%)#87 | 1,408,349(0.00%)#2,893 |
| 88. | Mcchord Afb | 15 | 13,745(0.11%)#88 | 1,408,349(0.00%)#2,910 |
| 89. | Tonasket | 15 | 13,745(0.11%)#89 | 1,408,349(0.00%)#2,919 |
| 90. | Eastmont | 14 | 13,745(0.10%)#90 | 1,408,349(0.00%)#2,935 |
| 91. | Burlington | 14 | 13,745(0.10%)#91 | 1,408,349(0.00%)#2,947 |
| 92. | North Fort Lewis | 14 | 13,745(0.10%)#92 | 1,408,349(0.00%)#2,953 |
| 93. | Camas | 12 | 13,745(0.09%)#93 | 1,408,349(0.00%)#3,058 |
| 94. | Minnehaha | 11 | 13,745(0.08%)#94 | 1,408,349(0.00%)#3,124 |
| 95. | Vashon | 11 | 13,745(0.08%)#95 | 1,408,349(0.00%)#3,127 |
| 96. | Steilacoom | 11 | 13,745(0.08%)#96 | 1,408,349(0.00%)#3,135 |
| 97. | Brier | 11 | 13,745(0.08%)#97 | 1,408,349(0.00%)#3,136 |
| 98. | Manchester | 11 | 13,745(0.08%)#98 | 1,408,349(0.00%)#3,137 |
| 99. | Olympia | 10 | 13,745(0.07%)#99 | 1,408,349(0.00%)#3,170 |
| 100. | Parkland | 10 | 13,745(0.07%)#100 | 1,408,349(0.00%)#3,173 |
Common Questions
What are the Top 10 Cities with the Most Immigrants from El Salvador in Washington?
Top 10 Cities with the Most Immigrants from El Salvador in Washington are:
#1
925
#2
753
#3
618
#4
574
#5
570
#6
541
#7
537
#8
474
#9
437
#10
431
What city has the Most Immigrants from El Salvador in Washington?
Seattle has the Most Immigrants from El Salvador in Washington with 925.
What is the Total Immigrants from El Salvador in the State of Washington?
Total Immigrants from El Salvador in Washington is 13,745.
What is the Total Immigrants from El Salvador in the United States?
Total Immigrants from El Salvador in the United States is 1,408,349.