Cities with the Highest Percentage of Immigrants from Ethiopia in Washington
RELATED REPORTS & OPTIONS
Ethiopia
Washington
Compare Cities
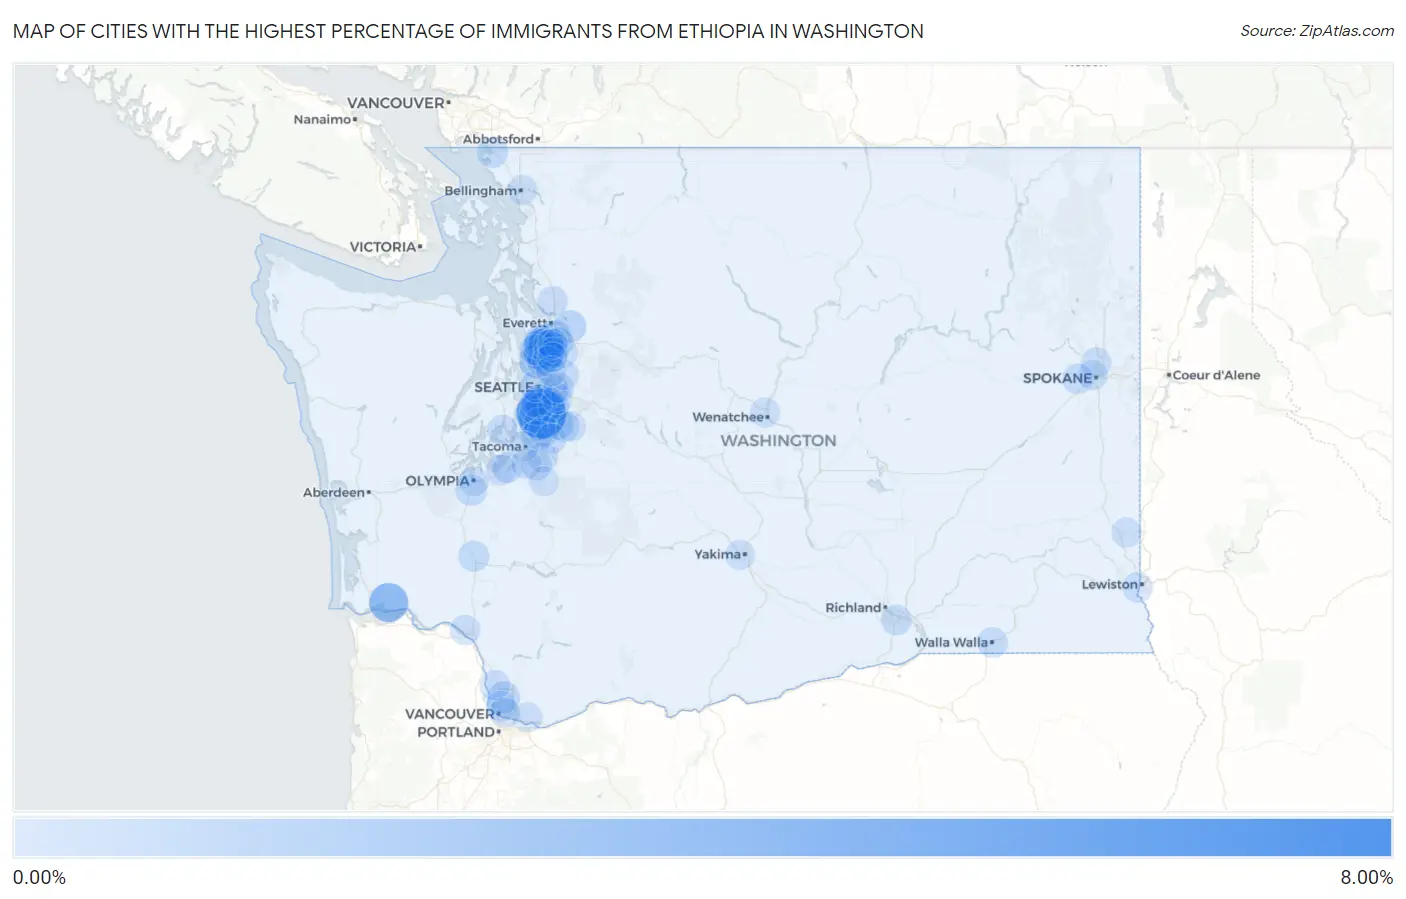
Map of Cities with the Highest Percentage of Immigrants from Ethiopia in Washington
0.00%
8.00%
Cities with the Highest Percentage of Immigrants from Ethiopia in Washington
| City | Ethiopia | vs State | vs National | |
| 1. | Seatac | 7.28% | 0.23%(+7.05)#-1 | 0.083%(+7.20)#0 |
| 2. | Rosburg | 3.26% | 0.23%(+3.03)#0 | 0.083%(+3.18)#1 |
| 3. | Alderwood Manor | 3.13% | 0.23%(+2.89)#1 | 0.083%(+3.04)#2 |
| 4. | Lynnwood | 2.53% | 0.23%(+2.30)#2 | 0.083%(+2.45)#3 |
| 5. | Larch Way | 2.21% | 0.23%(+1.97)#3 | 0.083%(+2.12)#4 |
| 6. | Brier | 2.06% | 0.23%(+1.83)#4 | 0.083%(+1.98)#5 |
| 7. | Tukwila | 1.93% | 0.23%(+1.70)#5 | 0.083%(+1.85)#6 |
| 8. | Bryn Mawr Skyway | 1.75% | 0.23%(+1.51)#6 | 0.083%(+1.66)#7 |
| 9. | Shoreline | 1.52% | 0.23%(+1.29)#18 | 0.083%(+1.44)#658 |
| 10. | Lake Stickney | 1.44% | 0.23%(+1.21)#19 | 0.083%(+1.36)#659 |
| 11. | Boulevard Park | 1.18% | 0.23%(+0.946)#20 | 0.083%(+1.10)#660 |
| 12. | Normandy Park | 1.06% | 0.23%(+0.827)#21 | 0.083%(+0.977)#661 |
| 13. | North Lynnwood | 1.03% | 0.23%(+0.794)#22 | 0.083%(+0.944)#662 |
| 14. | Des Moines | 0.88% | 0.23%(+0.642)#23 | 0.083%(+0.792)#663 |
| 15. | Mountlake Terrace | 0.87% | 0.23%(+0.638)#24 | 0.083%(+0.788)#664 |
| 16. | Eastmont | 0.83% | 0.23%(+0.595)#25 | 0.083%(+0.745)#665 |
| 17. | Burien | 0.83% | 0.23%(+0.594)#26 | 0.083%(+0.744)#666 |
| 18. | Everett | 0.80% | 0.23%(+0.571)#27 | 0.083%(+0.722)#667 |
| 19. | Mount Vista | 0.79% | 0.23%(+0.555)#28 | 0.083%(+0.705)#668 |
| 20. | Seattle | 0.73% | 0.23%(+0.493)#29 | 0.083%(+0.643)#894 |
| 21. | Kent | 0.51% | 0.23%(+0.274)#30 | 0.083%(+0.424)#895 |
| 22. | Tumwater | 0.50% | 0.23%(+0.262)#31 | 0.083%(+0.413)#896 |
| 23. | Federal Way | 0.46% | 0.23%(+0.228)#32 | 0.083%(+0.379)#897 |
| 24. | Renton | 0.45% | 0.23%(+0.218)#33 | 0.083%(+0.369)#898 |
| 25. | Beaux Arts Village | 0.39% | 0.23%(+0.154)#34 | 0.083%(+0.304)#899 |
| 26. | Fairwood Cdp King County | 0.39% | 0.23%(+0.154)#35 | 0.083%(+0.304)#900 |
| 27. | Blaine | 0.36% | 0.23%(+0.125)#36 | 0.083%(+0.275)#901 |
| 28. | Napavine | 0.35% | 0.23%(+0.120)#37 | 0.083%(+0.270)#902 |
| 29. | Lakeland North | 0.34% | 0.23%(+0.108)#38 | 0.083%(+0.258)#903 |
| 30. | Covington | 0.34% | 0.23%(+0.103)#39 | 0.083%(+0.253)#904 |
| 31. | Lake Forest Park | 0.33% | 0.23%(+0.101)#40 | 0.083%(+0.251)#905 |
| 32. | Picnic Point | 0.31% | 0.23%(+0.078)#41 | 0.083%(+0.228)#906 |
| 33. | Rosedale | 0.28% | 0.23%(+0.048)#42 | 0.083%(+0.198)#907 |
| 34. | Edmonds | 0.26% | 0.23%(+0.031)#43 | 0.083%(+0.181)#908 |
| 35. | Walla Walla | 0.26% | 0.23%(+0.030)#44 | 0.083%(+0.180)#909 |
| 36. | Maltby | 0.25% | 0.23%(+0.013)#45 | 0.083%(+0.164)#910 |
| 37. | Hazel Dell | 0.24% | 0.23%(+0.004)#46 | 0.083%(+0.155)#911 |
| 38. | North Fort Lewis | 0.22% | 0.23%(-0.017)#47 | 0.083%(+0.133)#912 |
| 39. | Kennewick | 0.21% | 0.23%(-0.025)#48 | 0.083%(+0.126)#913 |
| 40. | Summit View | 0.21% | 0.23%(-0.028)#49 | 0.083%(+0.123)#914 |
| 41. | Meadowdale | 0.20% | 0.23%(-0.033)#50 | 0.083%(+0.117)#915 |
| 42. | Airway Heights | 0.19% | 0.23%(-0.044)#51 | 0.083%(+0.106)#916 |
| 43. | White Center | 0.17% | 0.23%(-0.059)#52 | 0.083%(+0.091)#917 |
| 44. | Bothell West | 0.17% | 0.23%(-0.068)#53 | 0.083%(+0.082)#918 |
| 45. | Mill Creek East | 0.15% | 0.23%(-0.083)#54 | 0.083%(+0.067)#919 |
| 46. | Marysville | 0.15% | 0.23%(-0.085)#55 | 0.083%(+0.065)#920 |
| 47. | Newcastle | 0.15% | 0.23%(-0.086)#56 | 0.083%(+0.064)#921 |
| 48. | Redmond | 0.14% | 0.23%(-0.092)#57 | 0.083%(+0.058)#922 |
| 49. | Dupont | 0.14% | 0.23%(-0.093)#58 | 0.083%(+0.057)#923 |
| 50. | Bellevue | 0.14% | 0.23%(-0.098)#59 | 0.083%(+0.052)#924 |
| 51. | Country Homes | 0.13% | 0.23%(-0.105)#60 | 0.083%(+0.045)#925 |
| 52. | Ridgefield | 0.12% | 0.23%(-0.111)#61 | 0.083%(+0.039)#926 |
| 53. | Spokane | 0.12% | 0.23%(-0.113)#62 | 0.083%(+0.037)#927 |
| 54. | Auburn | 0.12% | 0.23%(-0.117)#63 | 0.083%(+0.034)#928 |
| 55. | West Clarkston Highland | 0.12% | 0.23%(-0.118)#64 | 0.083%(+0.032)#929 |
| 56. | Longview | 0.098% | 0.23%(-0.135)#65 | 0.083%(+0.015)#930 |
| 57. | Martha Lake | 0.086% | 0.23%(-0.147)#66 | 0.083%(+0.003)#931 |
| 58. | Puyallup | 0.075% | 0.23%(-0.158)#67 | 0.083%(-0.008)#932 |
| 59. | Silver Firs | 0.063% | 0.23%(-0.170)#68 | 0.083%(-0.020)#933 |
| 60. | Vancouver | 0.061% | 0.23%(-0.172)#69 | 0.083%(-0.022)#934 |
| 61. | Kenmore | 0.059% | 0.23%(-0.174)#70 | 0.083%(-0.024)#935 |
| 62. | Tacoma | 0.059% | 0.23%(-0.174)#71 | 0.083%(-0.024)#936 |
| 63. | Maple Valley | 0.047% | 0.23%(-0.187)#72 | 0.083%(-0.037)#937 |
| 64. | Parkland | 0.046% | 0.23%(-0.188)#73 | 0.083%(-0.038)#938 |
| 65. | Bothell East | 0.043% | 0.23%(-0.190)#74 | 0.083%(-0.040)#939 |
| 66. | Wenatchee | 0.042% | 0.23%(-0.191)#75 | 0.083%(-0.041)#940 |
| 67. | Mill Creek | 0.038% | 0.23%(-0.195)#76 | 0.083%(-0.045)#941 |
| 68. | Pullman | 0.034% | 0.23%(-0.199)#77 | 0.083%(-0.049)#942 |
| 69. | Olympia | 0.029% | 0.23%(-0.204)#78 | 0.083%(-0.054)#943 |
| 70. | Camas | 0.027% | 0.23%(-0.207)#79 | 0.083%(-0.057)#944 |
| 71. | Graham | 0.026% | 0.23%(-0.207)#80 | 0.083%(-0.057)#945 |
| 72. | Kirkland | 0.025% | 0.23%(-0.208)#81 | 0.083%(-0.058)#946 |
| 73. | Bellingham | 0.013% | 0.23%(-0.220)#82 | 0.083%(-0.070)#947 |
| 74. | Bothell | 0.0083% | 0.23%(-0.225)#83 | 0.083%(-0.075)#948 |
| 75. | Yakima | 0.0072% | 0.23%(-0.226)#84 | 0.083%(-0.076)#949 |
Common Questions
What are the Top 10 Cities with the Highest Percentage of Immigrants from Ethiopia in Washington?
Top 10 Cities with the Highest Percentage of Immigrants from Ethiopia in Washington are:
#1
7.28%
#2
3.26%
#3
3.13%
#4
2.53%
#5
2.21%
#6
2.06%
#7
1.93%
#8
1.75%
#9
1.52%
#10
1.44%
What city has the Highest Percentage of Immigrants from Ethiopia in Washington?
SeaTac has the Highest Percentage of Immigrants from Ethiopia in Washington with 7.28%.
What is the Percentage of Immigrants from Ethiopia in the State of Washington?
Percentage of Immigrants from Ethiopia in Washington is 0.23%.
What is the Percentage of Immigrants from Ethiopia in the United States?
Percentage of Immigrants from Ethiopia in the United States is 0.083%.