Ellensburg, WA Map & Demographics
Ellensburg Map
Ellensburg Overview
$30,474
PER CAPITA INCOME
$91,229
AVG FAMILY INCOME
$53,730
AVG HOUSEHOLD INCOME
26.7%
WAGE / INCOME GAP [ % ]
73.3¢/ $1
WAGE / INCOME GAP [ $ ]
$8,992
FAMILY INCOME DEFICIT
0.45
INEQUALITY / GINI INDEX
19,003
TOTAL POPULATION
9,408
MALE POPULATION
9,595
FEMALE POPULATION
98.05
MALES / 100 FEMALES
101.99
FEMALES / 100 MALES
24.9
MEDIAN AGE
2.7
AVG FAMILY SIZE
2.0
AVG HOUSEHOLD SIZE
11,063
LABOR FORCE [ PEOPLE ]
67.6%
PERCENT IN LABOR FORCE
9.0%
UNEMPLOYMENT RATE
Ellensburg Zip Codes
Ellensburg Area Codes
Income in Ellensburg
Income Overview in Ellensburg
Per Capita Income in Ellensburg is $30,474, while median incomes of families and households are $91,229 and $53,730 respectively.
| Characteristic | Number | Measure |
| Per Capita Income | 19,003 | $30,474 |
| Median Family Income | 3,559 | $91,229 |
| Mean Family Income | 3,559 | $99,354 |
| Median Household Income | 8,324 | $53,730 |
| Mean Household Income | 8,324 | $70,199 |
| Income Deficit | 3,559 | $8,992 |
| Wage / Income Gap (%) | 19,003 | 26.65% |
| Wage / Income Gap ($) | 19,003 | 73.35¢ per $1 |
| Gini / Inequality Index | 19,003 | 0.45 |
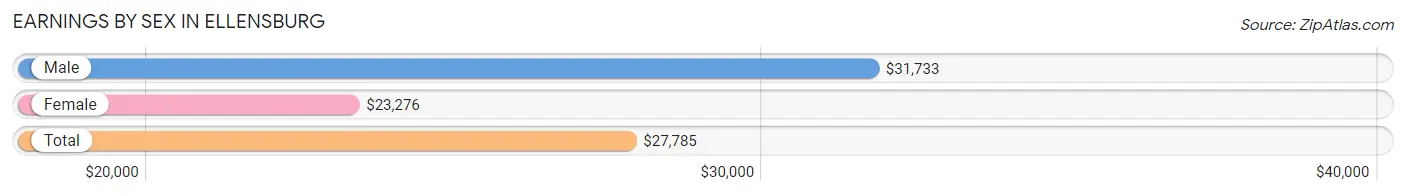
Earnings by Sex in Ellensburg
Average Earnings in Ellensburg are $27,785, $31,733 for men and $23,276 for women, a difference of 26.7%.
| Sex | Number | Average Earnings |
| Male | 6,288 (52.2%) | $31,733 |
| Female | 5,757 (47.8%) | $23,276 |
| Total | 12,045 (100.0%) | $27,785 |
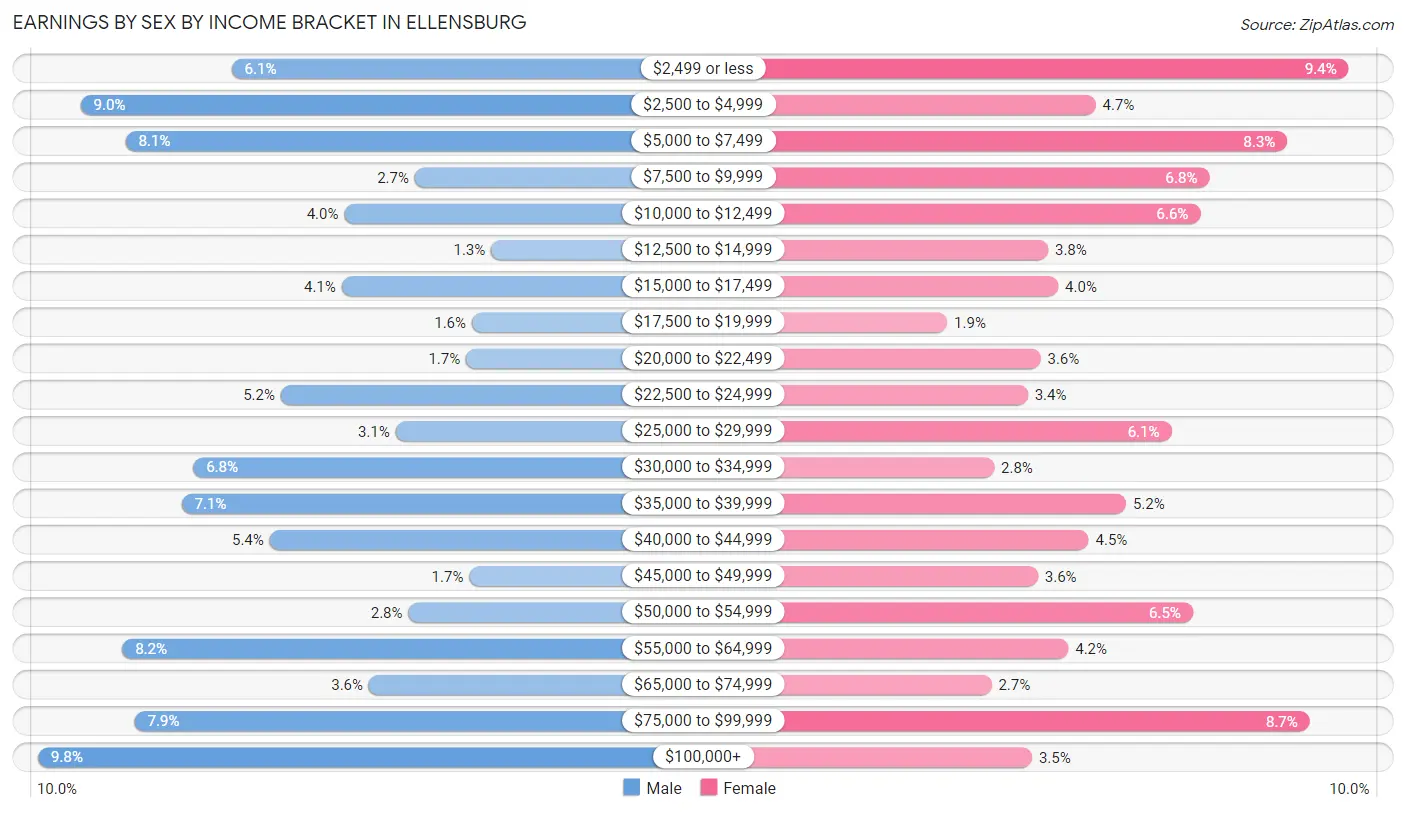
Earnings by Sex by Income Bracket in Ellensburg
The most common earnings brackets in Ellensburg are $100,000+ for men (613 | 9.8%) and $2,499 or less for women (541 | 9.4%).
| Income | Male | Female |
| $2,499 or less | 385 (6.1%) | 541 (9.4%) |
| $2,500 to $4,999 | 563 (8.9%) | 268 (4.7%) |
| $5,000 to $7,499 | 510 (8.1%) | 475 (8.3%) |
| $7,500 to $9,999 | 169 (2.7%) | 391 (6.8%) |
| $10,000 to $12,499 | 252 (4.0%) | 381 (6.6%) |
| $12,500 to $14,999 | 79 (1.3%) | 217 (3.8%) |
| $15,000 to $17,499 | 255 (4.1%) | 228 (4.0%) |
| $17,500 to $19,999 | 102 (1.6%) | 108 (1.9%) |
| $20,000 to $22,499 | 109 (1.7%) | 209 (3.6%) |
| $22,500 to $24,999 | 327 (5.2%) | 195 (3.4%) |
| $25,000 to $29,999 | 192 (3.0%) | 350 (6.1%) |
| $30,000 to $34,999 | 430 (6.8%) | 159 (2.8%) |
| $35,000 to $39,999 | 444 (7.1%) | 301 (5.2%) |
| $40,000 to $44,999 | 340 (5.4%) | 261 (4.5%) |
| $45,000 to $49,999 | 105 (1.7%) | 206 (3.6%) |
| $50,000 to $54,999 | 177 (2.8%) | 373 (6.5%) |
| $55,000 to $64,999 | 514 (8.2%) | 239 (4.2%) |
| $65,000 to $74,999 | 223 (3.5%) | 156 (2.7%) |
| $75,000 to $99,999 | 499 (7.9%) | 499 (8.7%) |
| $100,000+ | 613 (9.8%) | 200 (3.5%) |
| Total | 6,288 (100.0%) | 5,757 (100.0%) |
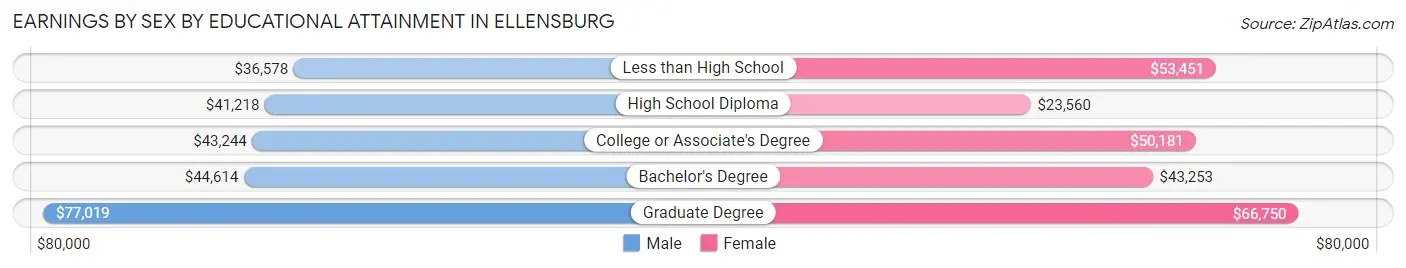
Earnings by Sex by Educational Attainment in Ellensburg
Average earnings in Ellensburg are $51,048 for men and $47,008 for women, a difference of 7.9%. Men with an educational attainment of graduate degree enjoy the highest average annual earnings of $77,019, while those with less than high school education earn the least with $36,578. Women with an educational attainment of graduate degree earn the most with the average annual earnings of $66,750, while those with high school diploma education have the smallest earnings of $23,560.
| Educational Attainment | Male Income | Female Income |
| Less than High School | $36,578 | $53,451 |
| High School Diploma | $41,218 | $23,560 |
| College or Associate's Degree | $43,244 | $50,181 |
| Bachelor's Degree | $44,614 | $43,253 |
| Graduate Degree | $77,019 | $66,750 |
| Total | $51,048 | $47,008 |
Family Income in Ellensburg
Family Income Brackets in Ellensburg
According to the Ellensburg family income data, there are 1,082 families falling into the $100,000 to $149,999 income range, which is the most common income bracket and makes up 30.4% of all families. Conversely, the less than $10,000 income bracket is the least frequent group with only 103 families (2.9%) belonging to this category.
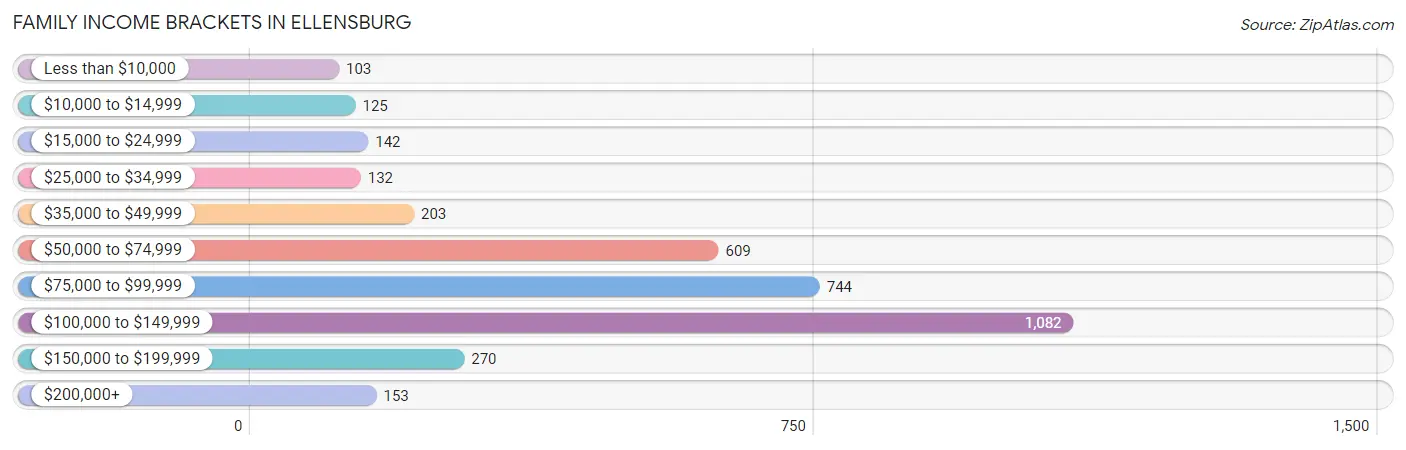
| Income Bracket | # Families | % Families |
| Less than $10,000 | 103 | 2.9% |
| $10,000 to $14,999 | 125 | 3.5% |
| $15,000 to $24,999 | 142 | 4.0% |
| $25,000 to $34,999 | 132 | 3.7% |
| $35,000 to $49,999 | 203 | 5.7% |
| $50,000 to $74,999 | 609 | 17.1% |
| $75,000 to $99,999 | 744 | 20.9% |
| $100,000 to $149,999 | 1,082 | 30.4% |
| $150,000 to $199,999 | 270 | 7.6% |
| $200,000+ | 153 | 4.3% |
Family Income by Famaliy Size in Ellensburg
4-person families (574 | 16.1%) account for the highest median family income in Ellensburg with $117,031 per family, while 2-person families (1,662 | 46.7%) have the highest median income of $38,318 per family member.
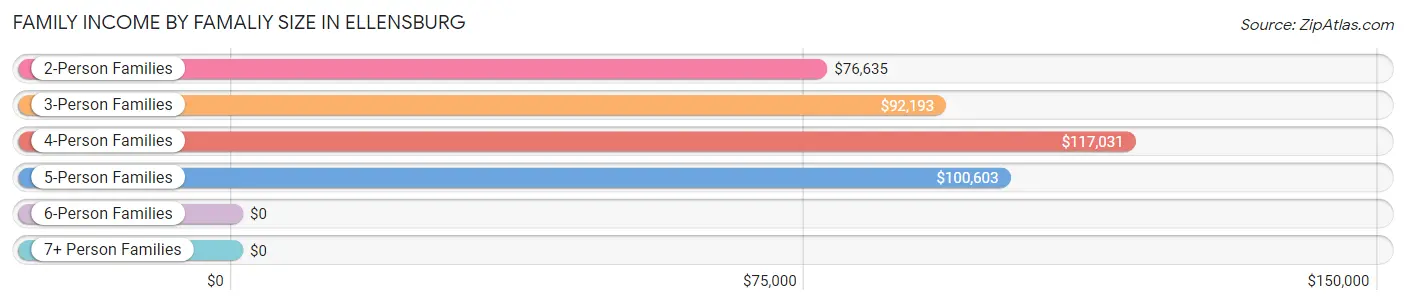
| Income Bracket | # Families | Median Income |
| 2-Person Families | 1,662 (46.7%) | $76,635 |
| 3-Person Families | 1,014 (28.5%) | $92,193 |
| 4-Person Families | 574 (16.1%) | $117,031 |
| 5-Person Families | 174 (4.9%) | $100,603 |
| 6-Person Families | 57 (1.6%) | $0 |
| 7+ Person Families | 78 (2.2%) | $0 |
| Total | 3,559 (100.0%) | $91,229 |
Family Income by Number of Earners in Ellensburg
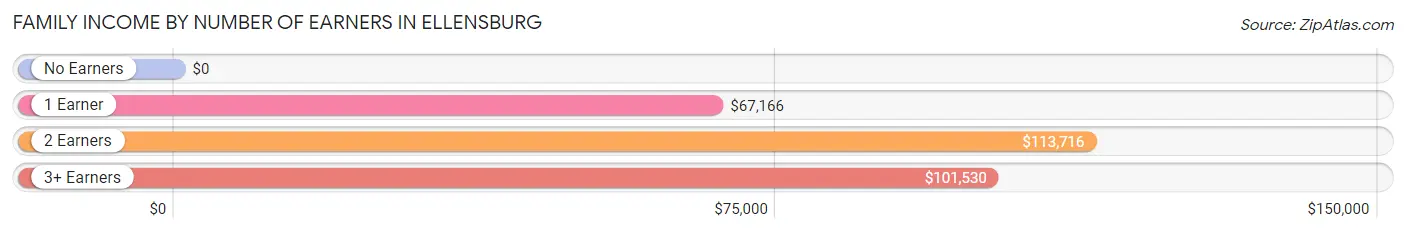
| Number of Earners | # Families | Median Income |
| No Earners | 368 (10.3%) | $0 |
| 1 Earner | 1,235 (34.7%) | $67,166 |
| 2 Earners | 1,565 (44.0%) | $113,716 |
| 3+ Earners | 391 (11.0%) | $101,530 |
| Total | 3,559 (100.0%) | $91,229 |
Household Income in Ellensburg
Household Income Brackets in Ellensburg
With 1,432 households falling in the category, the $100,000 to $149,999 income range is the most frequent in Ellensburg, accounting for 17.2% of all households. In contrast, only 216 households (2.6%) fall into the $200,000+ income bracket, making it the least populous group.
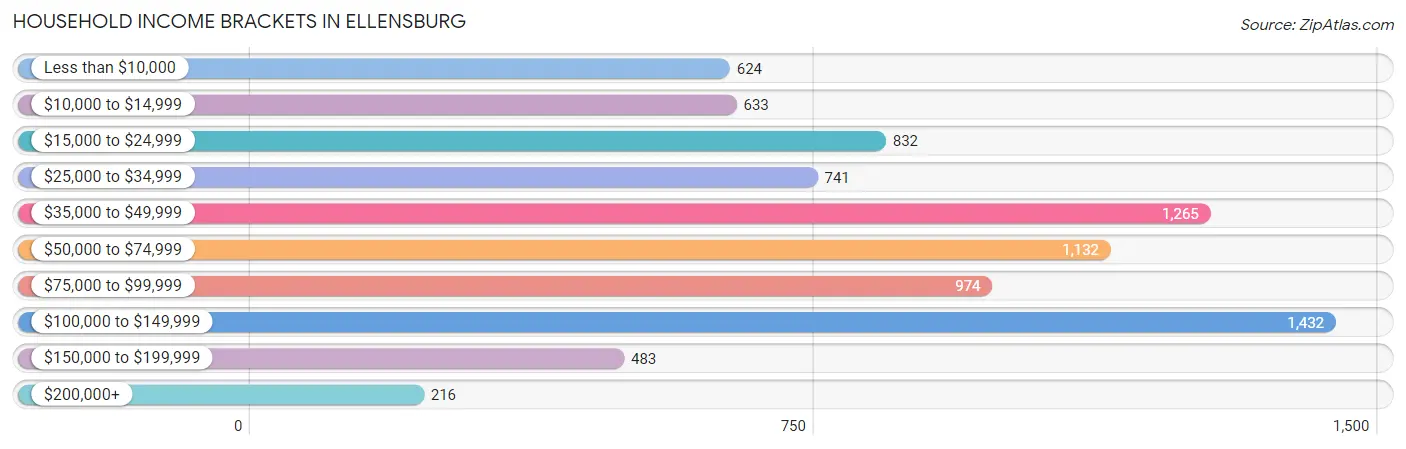
| Income Bracket | # Households | % Households |
| Less than $10,000 | 624 | 7.5% |
| $10,000 to $14,999 | 633 | 7.6% |
| $15,000 to $24,999 | 832 | 10.0% |
| $25,000 to $34,999 | 741 | 8.9% |
| $35,000 to $49,999 | 1,265 | 15.2% |
| $50,000 to $74,999 | 1,132 | 13.6% |
| $75,000 to $99,999 | 974 | 11.7% |
| $100,000 to $149,999 | 1,432 | 17.2% |
| $150,000 to $199,999 | 483 | 5.8% |
| $200,000+ | 216 | 2.6% |
Household Income by Householder Age in Ellensburg
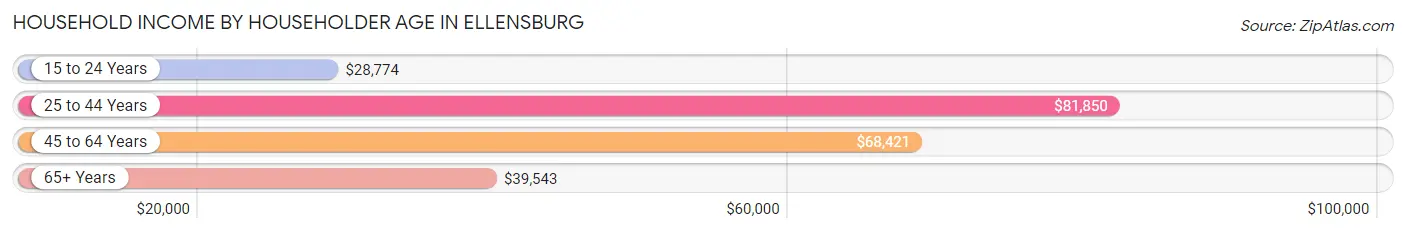
The median household income in Ellensburg is $53,730, with the highest median household income of $81,850 found in the 25 to 44 years age bracket for the primary householder. A total of 2,563 households (30.8%) fall into this category. Meanwhile, the 15 to 24 years age bracket for the primary householder has the lowest median household income of $28,774, with 2,282 households (27.4%) in this group.
| Income Bracket | # Households | Median Income |
| 15 to 24 Years | 2,282 (27.4%) | $28,774 |
| 25 to 44 Years | 2,563 (30.8%) | $81,850 |
| 45 to 64 Years | 1,978 (23.8%) | $68,421 |
| 65+ Years | 1,501 (18.0%) | $39,543 |
| Total | 8,324 (100.0%) | $53,730 |
Poverty in Ellensburg
Income Below Poverty by Sex and Age in Ellensburg
With 16.5% poverty level for males and 25.1% for females among the residents of Ellensburg, 18 to 24 year old males and 16 and 17 year old females are the most vulnerable to poverty, with 756 males (32.7%) and 94 females (55.6%) in their respective age groups living below the poverty level.
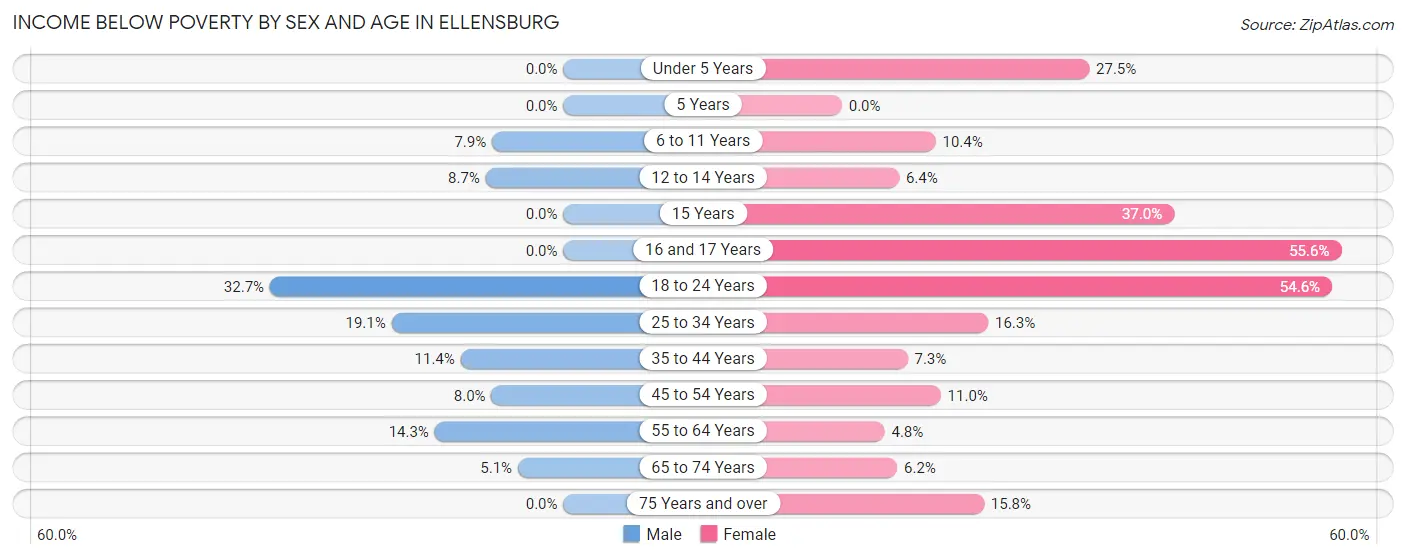
| Age Bracket | Male | Female |
| Under 5 Years | 0 (0.0%) | 84 (27.5%) |
| 5 Years | 0 (0.0%) | 0 (0.0%) |
| 6 to 11 Years | 46 (7.9%) | 40 (10.4%) |
| 12 to 14 Years | 16 (8.6%) | 24 (6.4%) |
| 15 Years | 0 (0.0%) | 27 (37.0%) |
| 16 and 17 Years | 0 (0.0%) | 94 (55.6%) |
| 18 to 24 Years | 756 (32.7%) | 1,407 (54.6%) |
| 25 to 34 Years | 251 (19.1%) | 188 (16.3%) |
| 35 to 44 Years | 122 (11.4%) | 72 (7.3%) |
| 45 to 54 Years | 59 (8.0%) | 76 (11.0%) |
| 55 to 64 Years | 93 (14.3%) | 32 (4.8%) |
| 65 to 74 Years | 18 (5.1%) | 45 (6.2%) |
| 75 Years and over | 0 (0.0%) | 75 (15.8%) |
| Total | 1,361 (16.5%) | 2,164 (25.1%) |
Income Above Poverty by Sex and Age in Ellensburg
According to the poverty statistics in Ellensburg, males aged under 5 years and females aged 5 years are the age groups that are most secure financially, with 100.0% of males and 100.0% of females in these age groups living above the poverty line.
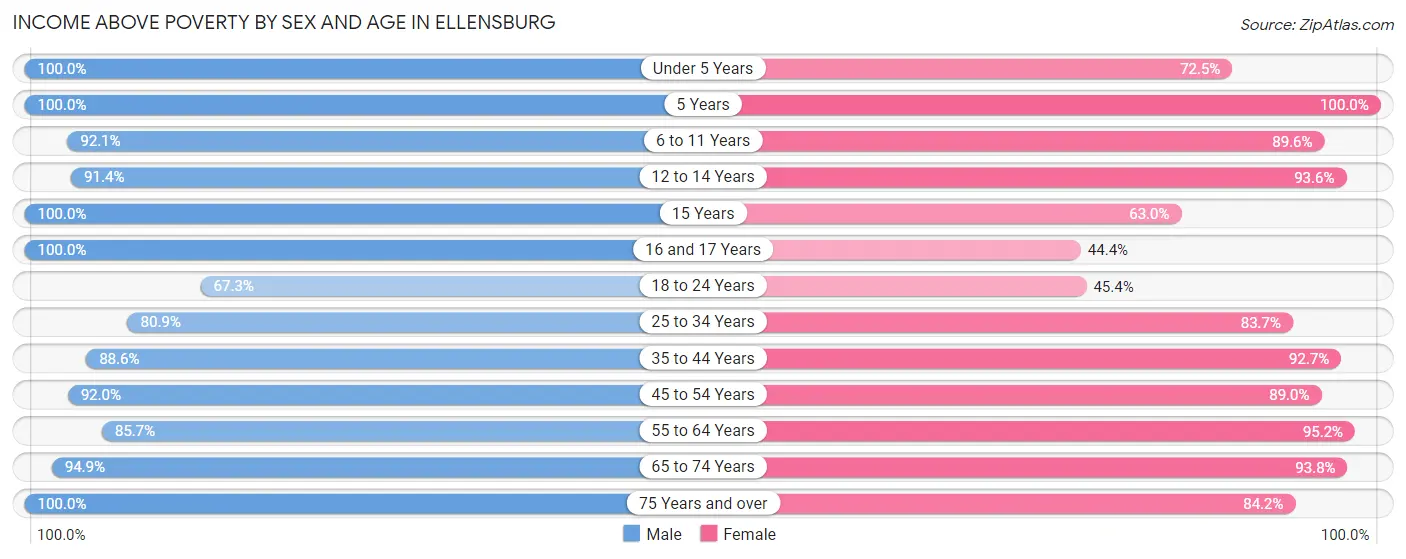
| Age Bracket | Male | Female |
| Under 5 Years | 484 (100.0%) | 221 (72.5%) |
| 5 Years | 89 (100.0%) | 29 (100.0%) |
| 6 to 11 Years | 533 (92.1%) | 343 (89.6%) |
| 12 to 14 Years | 169 (91.3%) | 353 (93.6%) |
| 15 Years | 9 (100.0%) | 46 (63.0%) |
| 16 and 17 Years | 123 (100.0%) | 75 (44.4%) |
| 18 to 24 Years | 1,557 (67.3%) | 1,171 (45.4%) |
| 25 to 34 Years | 1,061 (80.9%) | 966 (83.7%) |
| 35 to 44 Years | 944 (88.6%) | 912 (92.7%) |
| 45 to 54 Years | 678 (92.0%) | 614 (89.0%) |
| 55 to 64 Years | 556 (85.7%) | 640 (95.2%) |
| 65 to 74 Years | 338 (94.9%) | 685 (93.8%) |
| 75 Years and over | 361 (100.0%) | 399 (84.2%) |
| Total | 6,902 (83.5%) | 6,454 (74.9%) |
Income Below Poverty Among Married-Couple Families in Ellensburg
The poverty statistics for married-couple families in Ellensburg show that 4.5% or 102 of the total 2,257 families live below the poverty line. Families with no children have the highest poverty rate of 7.4%, comprising of 94 families. On the other hand, families with 3 or 4 children have the lowest poverty rate of 0.0%, which includes 0 families.
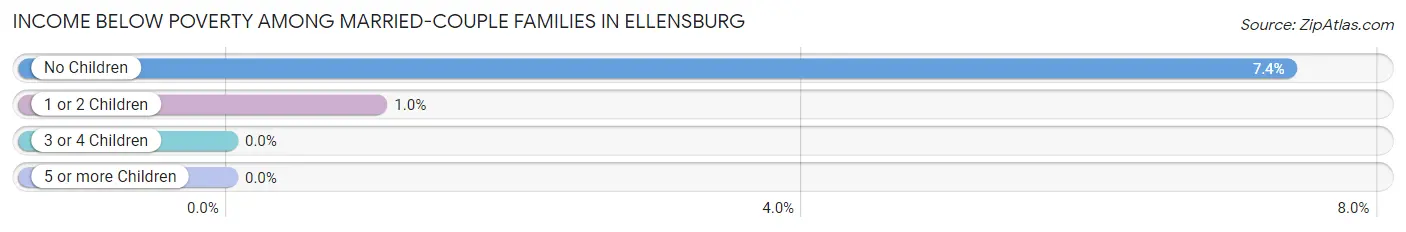
| Children | Above Poverty | Below Poverty |
| No Children | 1,181 (92.6%) | 94 (7.4%) |
| 1 or 2 Children | 762 (99.0%) | 8 (1.0%) |
| 3 or 4 Children | 212 (100.0%) | 0 (0.0%) |
| 5 or more Children | 0 (0.0%) | 0 (0.0%) |
| Total | 2,155 (95.5%) | 102 (4.5%) |
Income Below Poverty Among Single-Parent Households in Ellensburg
According to the poverty data in Ellensburg, 22.4% or 96 single-father households and 13.5% or 118 single-mother households are living below the poverty line. Among single-father households, those with 5 or more children have the highest poverty rate, with 27 households (100.0%) experiencing poverty. Likewise, among single-mother households, those with 1 or 2 children have the highest poverty rate, with 75 households (14.6%) falling below the poverty line.
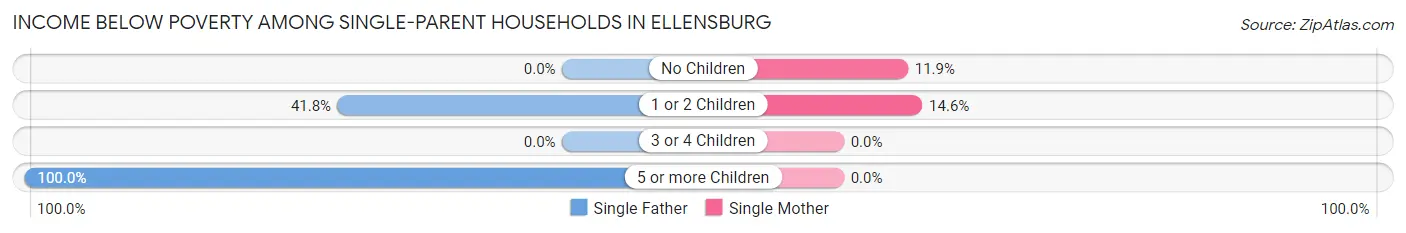
| Children | Single Father | Single Mother |
| No Children | 0 (0.0%) | 43 (11.9%) |
| 1 or 2 Children | 69 (41.8%) | 75 (14.6%) |
| 3 or 4 Children | 0 (0.0%) | 0 (0.0%) |
| 5 or more Children | 27 (100.0%) | 0 (0.0%) |
| Total | 96 (22.4%) | 118 (13.5%) |
Income Below Poverty Among Married-Couple vs Single-Parent Households in Ellensburg
The poverty data for Ellensburg shows that 102 of the married-couple family households (4.5%) and 214 of the single-parent households (16.4%) are living below the poverty level. Within the married-couple family households, those with no children have the highest poverty rate, with 94 households (7.4%) falling below the poverty line. Among the single-parent households, those with 5 or more children have the highest poverty rate, with 27 household (100.0%) living below poverty.
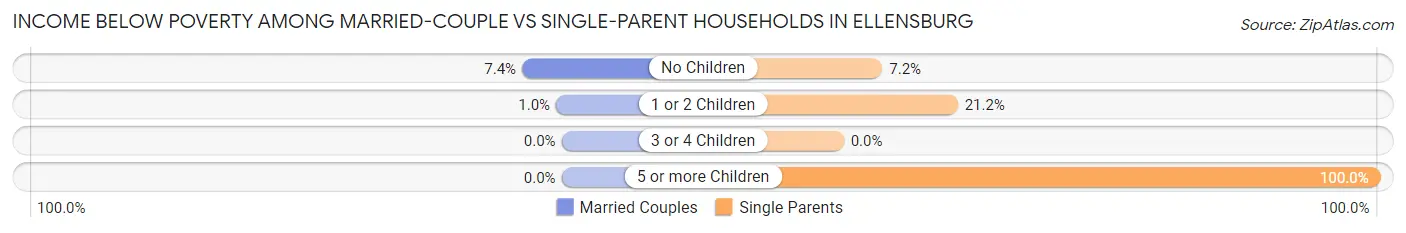
| Children | Married-Couple Families | Single-Parent Households |
| No Children | 94 (7.4%) | 43 (7.2%) |
| 1 or 2 Children | 8 (1.0%) | 144 (21.2%) |
| 3 or 4 Children | 0 (0.0%) | 0 (0.0%) |
| 5 or more Children | 0 (0.0%) | 27 (100.0%) |
| Total | 102 (4.5%) | 214 (16.4%) |
Race in Ellensburg
The most populous races in Ellensburg are White / Caucasian (15,177 | 79.9%), Hispanic or Latino (2,282 | 12.0%), and Two or more Races (1,860 | 9.8%).
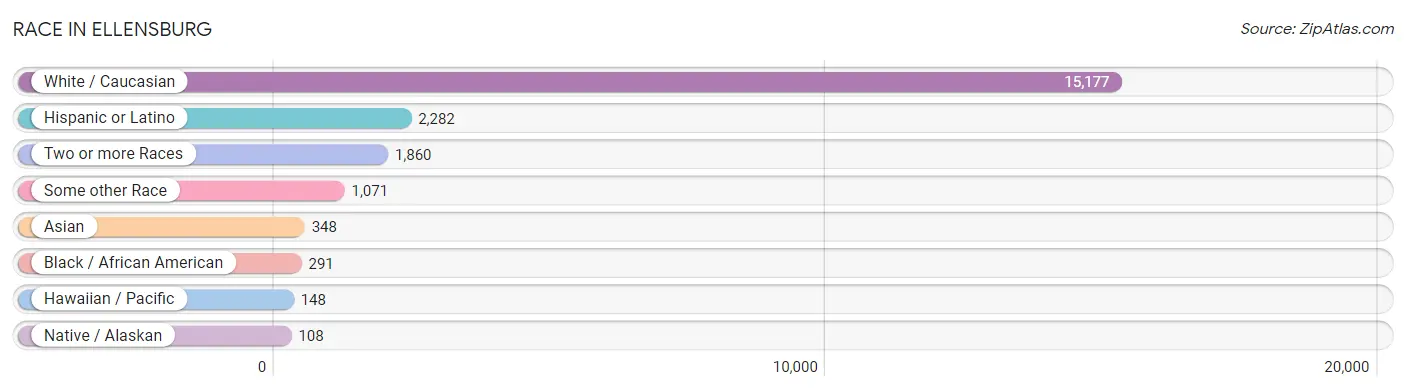
| Race | # Population | % Population |
| Asian | 348 | 1.8% |
| Black / African American | 291 | 1.5% |
| Hawaiian / Pacific | 148 | 0.8% |
| Hispanic or Latino | 2,282 | 12.0% |
| Native / Alaskan | 108 | 0.6% |
| White / Caucasian | 15,177 | 79.9% |
| Two or more Races | 1,860 | 9.8% |
| Some other Race | 1,071 | 5.6% |
| Total | 19,003 | 100.0% |
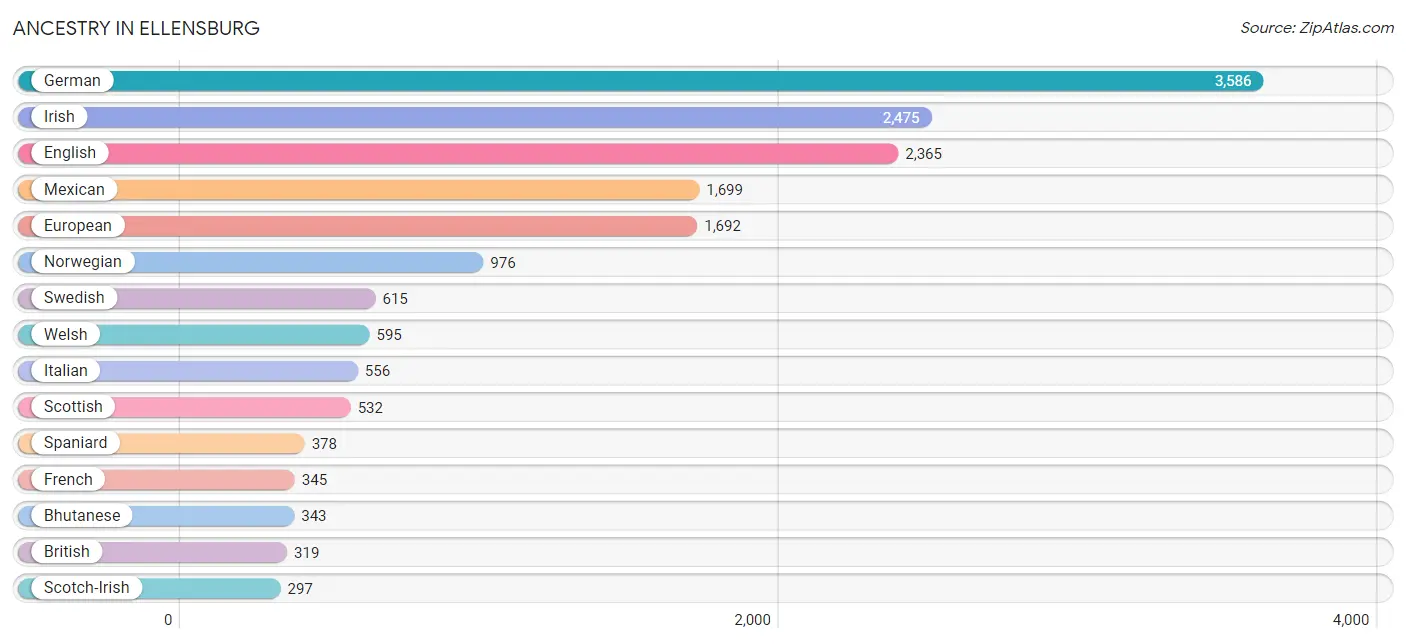
Ancestry in Ellensburg
The most populous ancestries reported in Ellensburg are German (3,586 | 18.9%), Irish (2,475 | 13.0%), English (2,365 | 12.4%), Mexican (1,699 | 8.9%), and European (1,692 | 8.9%), together accounting for 62.2% of all Ellensburg residents.
| Ancestry | # Population | % Population |
| African | 74 | 0.4% |
| American | 290 | 1.5% |
| Arab | 57 | 0.3% |
| Basque | 15 | 0.1% |
| Bhutanese | 343 | 1.8% |
| Blackfeet | 48 | 0.3% |
| British | 319 | 1.7% |
| Burmese | 52 | 0.3% |
| Cambodian | 10 | 0.1% |
| Canadian | 84 | 0.4% |
| Celtic | 8 | 0.0% |
| Cherokee | 64 | 0.3% |
| Chickasaw | 8 | 0.0% |
| Chinese | 7 | 0.0% |
| Chippewa | 11 | 0.1% |
| Colombian | 27 | 0.1% |
| Colville | 16 | 0.1% |
| Croatian | 23 | 0.1% |
| Cuban | 42 | 0.2% |
| Czech | 137 | 0.7% |
| Danish | 260 | 1.4% |
| Dutch | 283 | 1.5% |
| Eastern European | 24 | 0.1% |
| English | 2,365 | 12.4% |
| Ethiopian | 54 | 0.3% |
| European | 1,692 | 8.9% |
| Fijian | 49 | 0.3% |
| Filipino | 29 | 0.2% |
| Finnish | 84 | 0.4% |
| French | 345 | 1.8% |
| French Canadian | 162 | 0.9% |
| German | 3,586 | 18.9% |
| German Russian | 14 | 0.1% |
| Greek | 44 | 0.2% |
| Guamanian / Chamorro | 53 | 0.3% |
| Hopi | 5 | 0.0% |
| Hungarian | 14 | 0.1% |
| Indian (Asian) | 208 | 1.1% |
| Inupiat | 14 | 0.1% |
| Irish | 2,475 | 13.0% |
| Italian | 556 | 2.9% |
| Japanese | 27 | 0.1% |
| Korean | 134 | 0.7% |
| Laotian | 16 | 0.1% |
| Lebanese | 30 | 0.2% |
| Lithuanian | 5 | 0.0% |
| Malaysian | 42 | 0.2% |
| Mexican | 1,699 | 8.9% |
| Mexican American Indian | 6 | 0.0% |
| Native Hawaiian | 33 | 0.2% |
| Nigerian | 7 | 0.0% |
| Northern European | 41 | 0.2% |
| Norwegian | 976 | 5.1% |
| Ottawa | 12 | 0.1% |
| Pennsylvania German | 12 | 0.1% |
| Polish | 205 | 1.1% |
| Portuguese | 91 | 0.5% |
| Pueblo | 21 | 0.1% |
| Puerto Rican | 76 | 0.4% |
| Romanian | 15 | 0.1% |
| Russian | 50 | 0.3% |
| Samoan | 54 | 0.3% |
| Scandinavian | 89 | 0.5% |
| Scotch-Irish | 297 | 1.6% |
| Scottish | 532 | 2.8% |
| Sioux | 12 | 0.1% |
| Slovene | 36 | 0.2% |
| South African | 15 | 0.1% |
| South American | 27 | 0.1% |
| Spaniard | 378 | 2.0% |
| Spanish | 18 | 0.1% |
| Sri Lankan | 58 | 0.3% |
| Subsaharan African | 210 | 1.1% |
| Sudanese | 3 | 0.0% |
| Swedish | 615 | 3.2% |
| Swiss | 178 | 0.9% |
| Tlingit-Haida | 3 | 0.0% |
| Trinidadian and Tobagonian | 18 | 0.1% |
| Welsh | 595 | 3.1% |
| Yakama | 55 | 0.3% |
| Yup'ik | 13 | 0.1% |
| Zimbabwean | 41 | 0.2% | View All 82 Rows |
Immigrants in Ellensburg
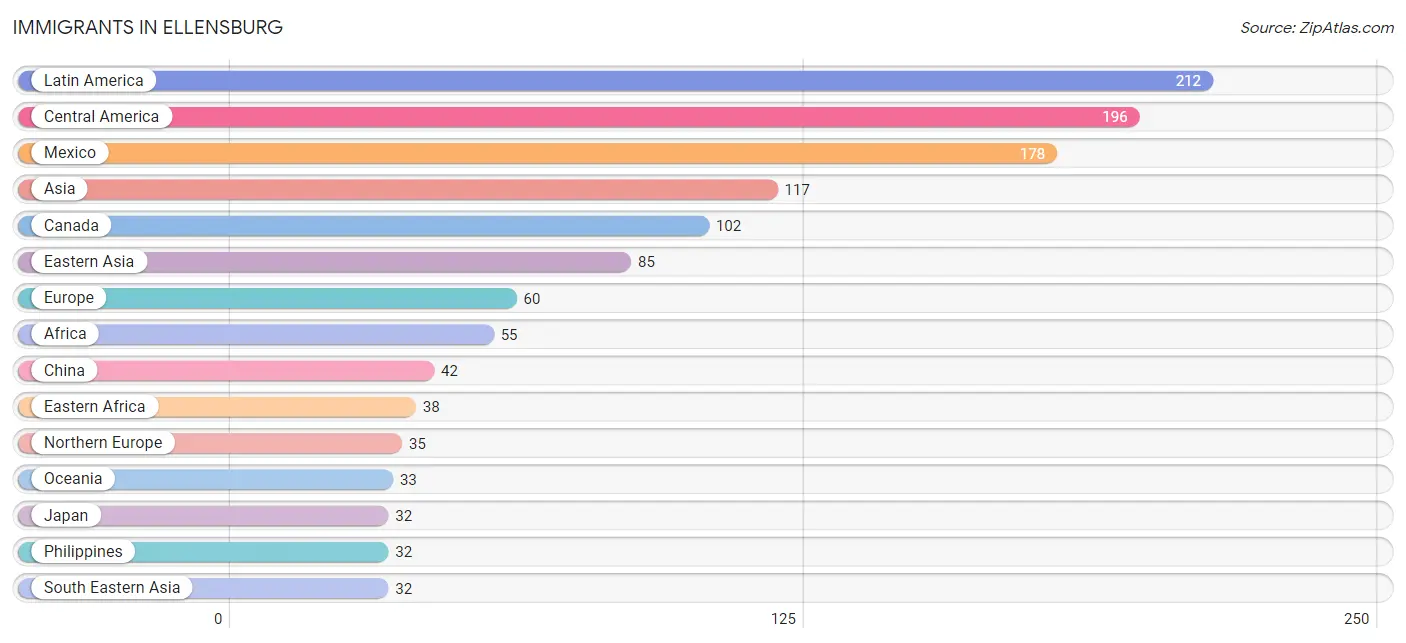
The most numerous immigrant groups reported in Ellensburg came from Latin America (212 | 1.1%), Central America (196 | 1.0%), Mexico (178 | 0.9%), Asia (117 | 0.6%), and Canada (102 | 0.5%), together accounting for 4.2% of all Ellensburg residents.
| Immigration Origin | # Population | % Population |
| Africa | 55 | 0.3% |
| Asia | 117 | 0.6% |
| Canada | 102 | 0.5% |
| Central America | 196 | 1.0% |
| China | 42 | 0.2% |
| Colombia | 16 | 0.1% |
| Denmark | 17 | 0.1% |
| Eastern Africa | 38 | 0.2% |
| Eastern Asia | 85 | 0.4% |
| El Salvador | 18 | 0.1% |
| England | 16 | 0.1% |
| Europe | 60 | 0.3% |
| France | 2 | 0.0% |
| Germany | 19 | 0.1% |
| Hong Kong | 12 | 0.1% |
| Japan | 32 | 0.2% |
| Korea | 11 | 0.1% |
| Latin America | 212 | 1.1% |
| Mexico | 178 | 0.9% |
| Micronesia | 13 | 0.1% |
| Netherlands | 4 | 0.0% |
| Northern Europe | 35 | 0.2% |
| Oceania | 33 | 0.2% |
| Philippines | 32 | 0.2% |
| South America | 16 | 0.1% |
| South Eastern Asia | 32 | 0.2% |
| Western Europe | 25 | 0.1% | View All 27 Rows |
Sex and Age in Ellensburg
Sex and Age in Ellensburg
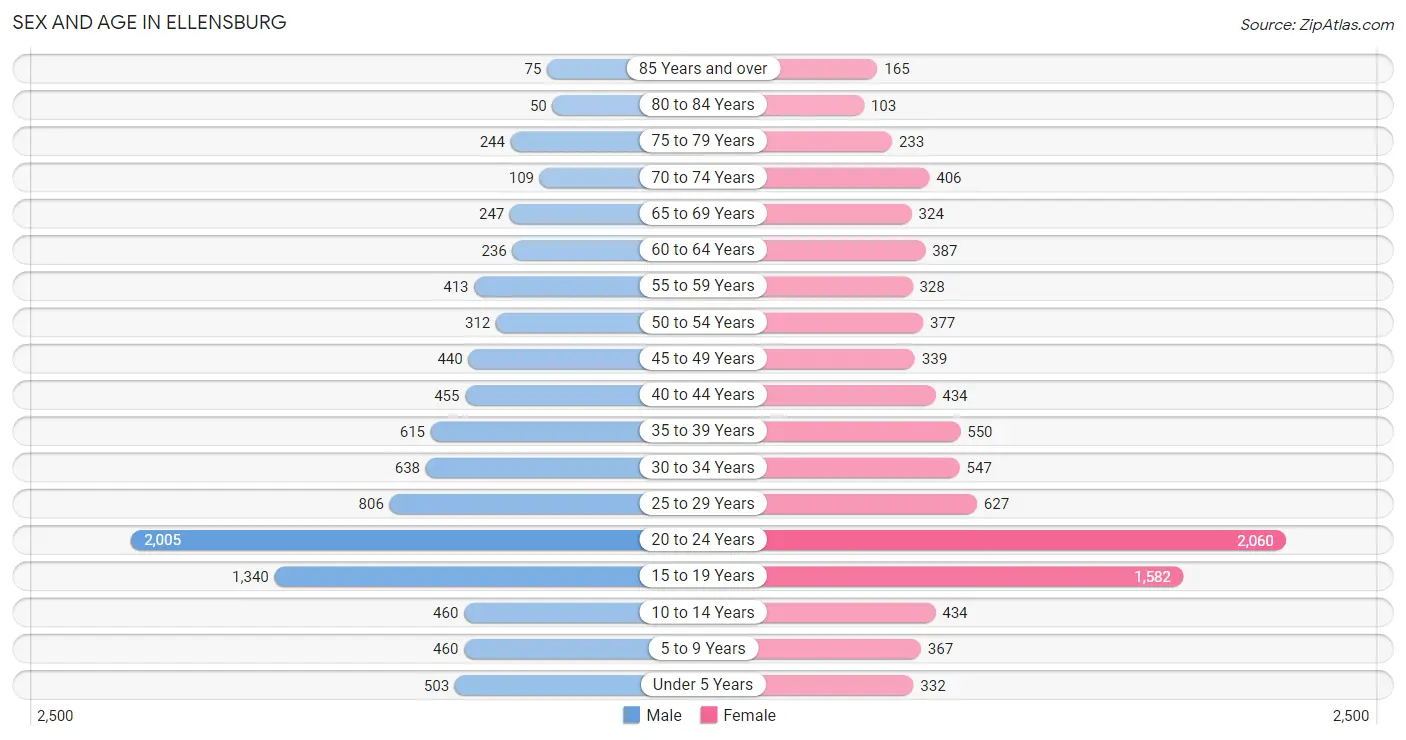
The most populous age groups in Ellensburg are 20 to 24 Years (2,005 | 21.3%) for men and 20 to 24 Years (2,060 | 21.5%) for women.
| Age Bracket | Male | Female |
| Under 5 Years | 503 (5.3%) | 332 (3.5%) |
| 5 to 9 Years | 460 (4.9%) | 367 (3.8%) |
| 10 to 14 Years | 460 (4.9%) | 434 (4.5%) |
| 15 to 19 Years | 1,340 (14.2%) | 1,582 (16.5%) |
| 20 to 24 Years | 2,005 (21.3%) | 2,060 (21.5%) |
| 25 to 29 Years | 806 (8.6%) | 627 (6.5%) |
| 30 to 34 Years | 638 (6.8%) | 547 (5.7%) |
| 35 to 39 Years | 615 (6.5%) | 550 (5.7%) |
| 40 to 44 Years | 455 (4.8%) | 434 (4.5%) |
| 45 to 49 Years | 440 (4.7%) | 339 (3.5%) |
| 50 to 54 Years | 312 (3.3%) | 377 (3.9%) |
| 55 to 59 Years | 413 (4.4%) | 328 (3.4%) |
| 60 to 64 Years | 236 (2.5%) | 387 (4.0%) |
| 65 to 69 Years | 247 (2.6%) | 324 (3.4%) |
| 70 to 74 Years | 109 (1.2%) | 406 (4.2%) |
| 75 to 79 Years | 244 (2.6%) | 233 (2.4%) |
| 80 to 84 Years | 50 (0.5%) | 103 (1.1%) |
| 85 Years and over | 75 (0.8%) | 165 (1.7%) |
| Total | 9,408 (100.0%) | 9,595 (100.0%) |
Families and Households in Ellensburg
Median Family Size in Ellensburg
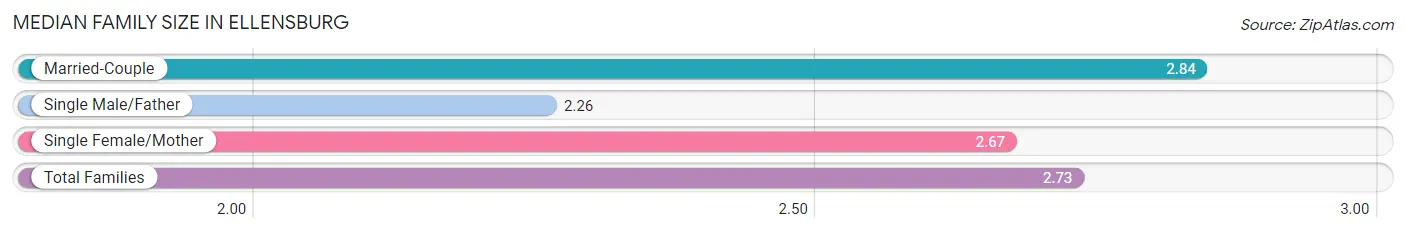
The median family size in Ellensburg is 2.73 persons per family, with married-couple families (2,257 | 63.4%) accounting for the largest median family size of 2.84 persons per family. On the other hand, single male/father families (429 | 12.0%) represent the smallest median family size with 2.26 persons per family.
| Family Type | # Families | Family Size |
| Married-Couple | 2,257 (63.4%) | 2.84 |
| Single Male/Father | 429 (12.0%) | 2.26 |
| Single Female/Mother | 873 (24.5%) | 2.67 |
| Total Families | 3,559 (100.0%) | 2.73 |
Median Household Size in Ellensburg
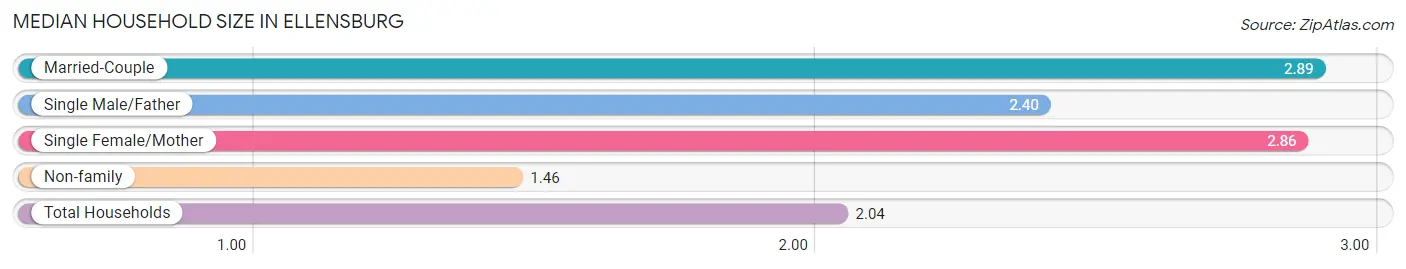
The median household size in Ellensburg is 2.04 persons per household, with married-couple households (2,257 | 27.1%) accounting for the largest median household size of 2.89 persons per household. non-family households (4,765 | 57.2%) represent the smallest median household size with 1.46 persons per household.
| Household Type | # Households | Household Size |
| Married-Couple | 2,257 (27.1%) | 2.89 |
| Single Male/Father | 429 (5.1%) | 2.40 |
| Single Female/Mother | 873 (10.5%) | 2.86 |
| Non-family | 4,765 (57.2%) | 1.46 |
| Total Households | 8,324 (100.0%) | 2.04 |
Household Size by Marriage Status in Ellensburg
Out of a total of 8,324 households in Ellensburg, 3,559 (42.8%) are family households, while 4,765 (57.2%) are nonfamily households. The most numerous type of family households are 2-person households, comprising 1,575, and the most common type of nonfamily households are 1-person households, comprising 2,516.
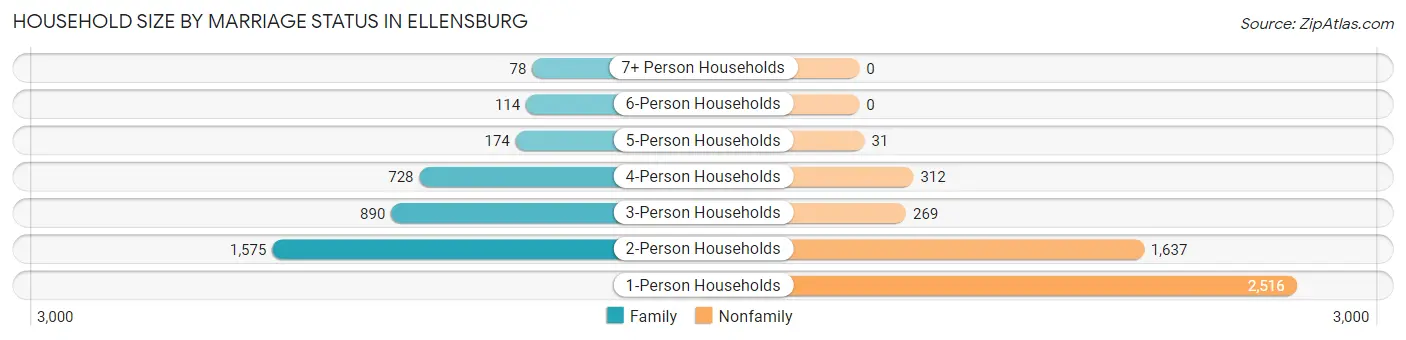
| Household Size | Family Households | Nonfamily Households |
| 1-Person Households | - | 2,516 (30.2%) |
| 2-Person Households | 1,575 (18.9%) | 1,637 (19.7%) |
| 3-Person Households | 890 (10.7%) | 269 (3.2%) |
| 4-Person Households | 728 (8.7%) | 312 (3.7%) |
| 5-Person Households | 174 (2.1%) | 31 (0.4%) |
| 6-Person Households | 114 (1.4%) | 0 (0.0%) |
| 7+ Person Households | 78 (0.9%) | 0 (0.0%) |
| Total | 3,559 (42.8%) | 4,765 (57.2%) |
Female Fertility in Ellensburg
Fertility by Age in Ellensburg
Average fertility rate in Ellensburg is 15.0 births per 1,000 women. Women in the age bracket of 20 to 34 years have the highest fertility rate with 28.0 births per 1,000 women. Women in the age bracket of 20 to 34 years acount for 100.0% of all women with births.
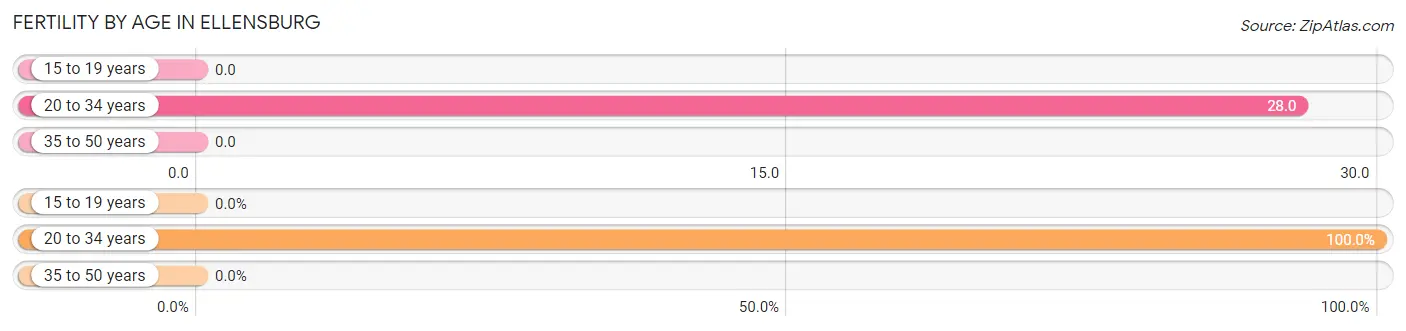
| Age Bracket | Women with Births | Births / 1,000 Women |
| 15 to 19 years | 0 (0.0%) | 0.0 |
| 20 to 34 years | 92 (100.0%) | 28.0 |
| 35 to 50 years | 0 (0.0%) | 0.0 |
| Total | 92 (100.0%) | 15.0 |
Fertility by Age by Marriage Status in Ellensburg
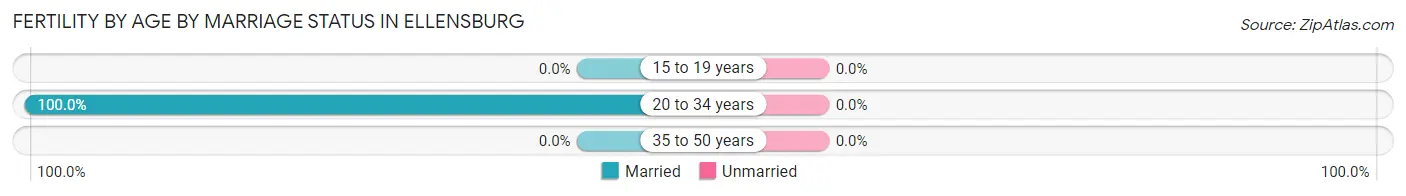
| Age Bracket | Married | Unmarried |
| 15 to 19 years | 0 (0.0%) | 0 (0.0%) |
| 20 to 34 years | 92 (100.0%) | 0 (0.0%) |
| 35 to 50 years | 0 (0.0%) | 0 (0.0%) |
| Total | 92 (100.0%) | 0 (0.0%) |
Fertility by Education in Ellensburg
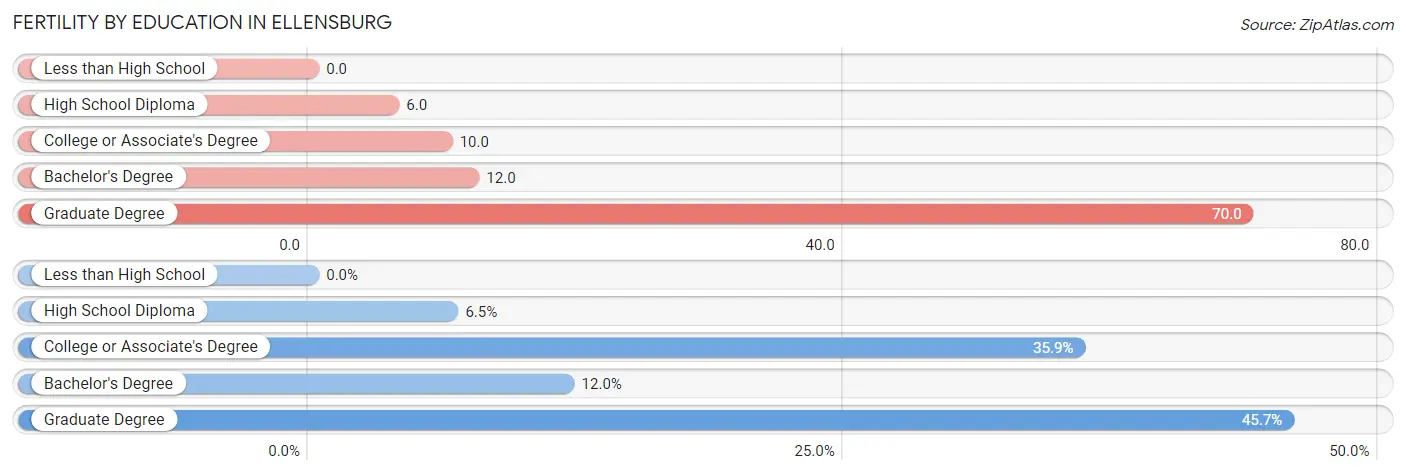
| Educational Attainment | Women with Births | Births / 1,000 Women |
| Less than High School | 0 (0.0%) | 0.0 |
| High School Diploma | 6 (6.5%) | 6.0 |
| College or Associate's Degree | 33 (35.9%) | 10.0 |
| Bachelor's Degree | 11 (12.0%) | 12.0 |
| Graduate Degree | 42 (45.7%) | 70.0 |
| Total | 92 (100.0%) | 15.0 |
Fertility by Education by Marriage Status in Ellensburg
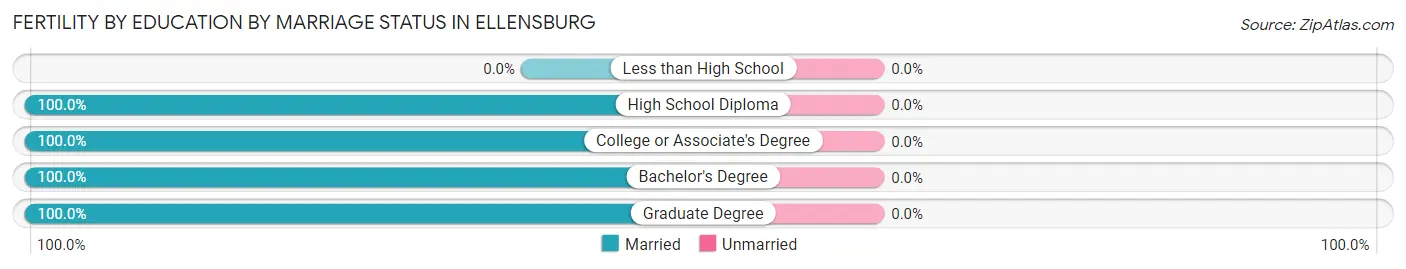
| Educational Attainment | Married | Unmarried |
| Less than High School | 0 (0.0%) | 0 (0.0%) |
| High School Diploma | 6 (100.0%) | 0 (0.0%) |
| College or Associate's Degree | 33 (100.0%) | 0 (0.0%) |
| Bachelor's Degree | 11 (100.0%) | 0 (0.0%) |
| Graduate Degree | 42 (100.0%) | 0 (0.0%) |
| Total | 92 (100.0%) | 0 (0.0%) |
Employment Characteristics in Ellensburg
Employment by Class of Employer in Ellensburg
Among the 9,753 employed individuals in Ellensburg, private company employees (5,543 | 56.8%), state government employees (1,795 | 18.4%), and local government employees (871 | 8.9%) make up the most common classes of employment.
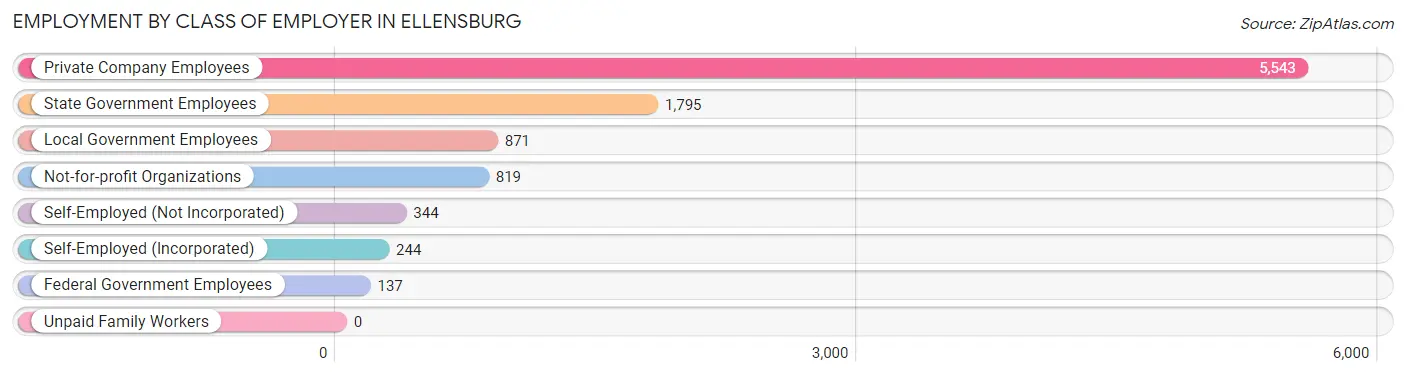
| Employer Class | # Employees | % Employees |
| Private Company Employees | 5,543 | 56.8% |
| Self-Employed (Incorporated) | 244 | 2.5% |
| Self-Employed (Not Incorporated) | 344 | 3.5% |
| Not-for-profit Organizations | 819 | 8.4% |
| Local Government Employees | 871 | 8.9% |
| State Government Employees | 1,795 | 18.4% |
| Federal Government Employees | 137 | 1.4% |
| Unpaid Family Workers | 0 | 0.0% |
| Total | 9,753 | 100.0% |
Employment Status by Age in Ellensburg
According to the labor force statistics for Ellensburg, out of the total population over 16 years of age (16,365), 67.6% or 11,063 individuals are in the labor force, with 9.0% or 996 of them unemployed. The age group with the highest labor force participation rate is 30 to 34 years, with 90.7% or 1,075 individuals in the labor force. Within the labor force, the 16 to 19 years age range has the highest percentage of unemployed individuals, with 31.9% or 484 of them being unemployed.
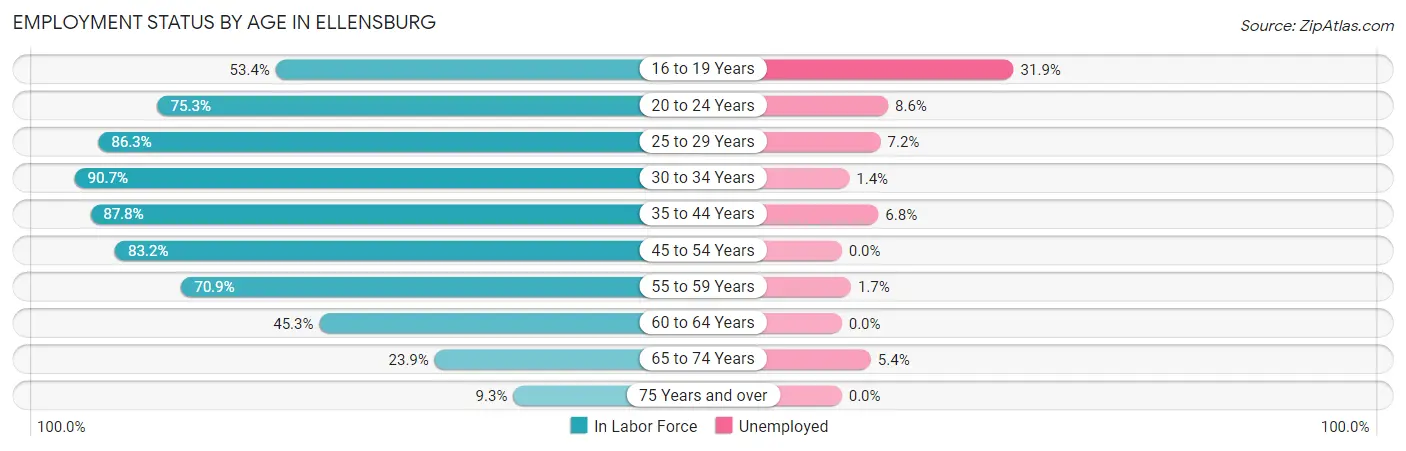
| Age Bracket | In Labor Force | Unemployed |
| 16 to 19 Years | 1,517 (53.4%) | 484 (31.9%) |
| 20 to 24 Years | 3,061 (75.3%) | 263 (8.6%) |
| 25 to 29 Years | 1,237 (86.3%) | 89 (7.2%) |
| 30 to 34 Years | 1,075 (90.7%) | 15 (1.4%) |
| 35 to 44 Years | 1,803 (87.8%) | 123 (6.8%) |
| 45 to 54 Years | 1,221 (83.2%) | 0 (0.0%) |
| 55 to 59 Years | 525 (70.9%) | 9 (1.7%) |
| 60 to 64 Years | 282 (45.3%) | 0 (0.0%) |
| 65 to 74 Years | 260 (23.9%) | 14 (5.4%) |
| 75 Years and over | 81 (9.3%) | 0 (0.0%) |
| Total | 11,063 (67.6%) | 996 (9.0%) |
Employment Status by Educational Attainment in Ellensburg
According to labor force statistics for Ellensburg, 81.9% of individuals (6,146) out of the total population between 25 and 64 years of age (7,504) are in the labor force, with 3.8% or 234 of them being unemployed. The group with the highest labor force participation rate are those with the educational attainment of bachelor's degree or higher, with 91.1% or 3,381 individuals in the labor force. Within the labor force, individuals with less than high school education have the highest percentage of unemployment, with 6.9% or 15 of them being unemployed.
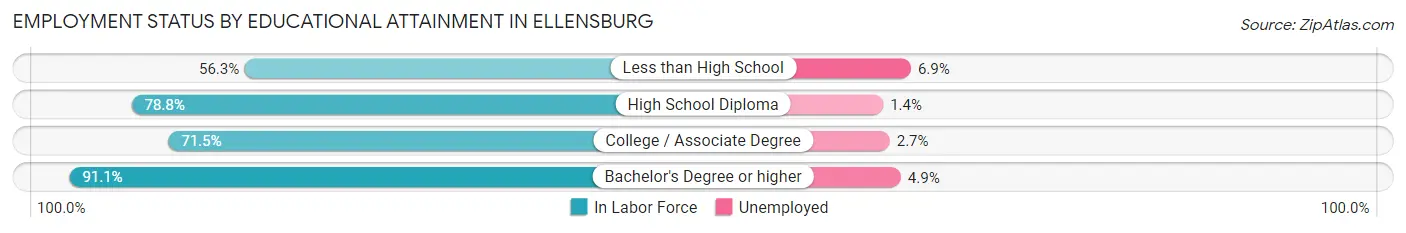
| Educational Attainment | In Labor Force | Unemployed |
| Less than High School | 216 (56.3%) | 26 (6.9%) |
| High School Diploma | 1,184 (78.8%) | 21 (1.4%) |
| College / Associate Degree | 1,364 (71.5%) | 51 (2.7%) |
| Bachelor's Degree or higher | 3,381 (91.1%) | 182 (4.9%) |
| Total | 6,146 (81.9%) | 285 (3.8%) |
Employment Occupations by Sex in Ellensburg
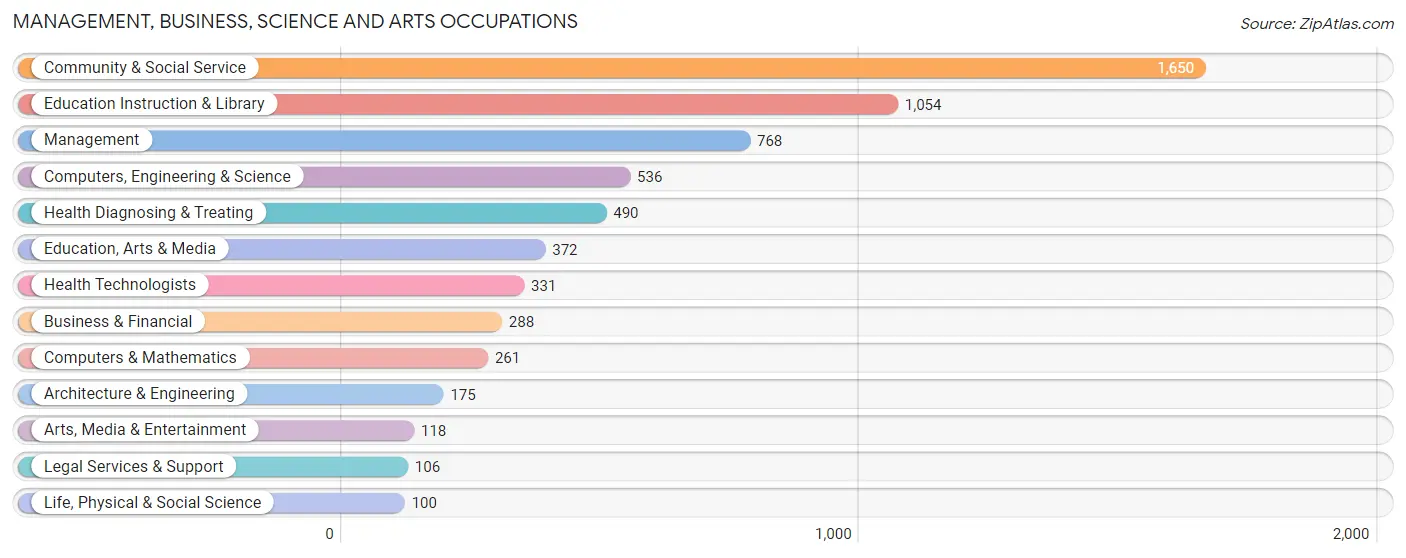
Management, Business, Science and Arts Occupations
The most common Management, Business, Science and Arts occupations in Ellensburg are Community & Social Service (1,650 | 16.4%), Education Instruction & Library (1,054 | 10.5%), Management (768 | 7.6%), Computers, Engineering & Science (536 | 5.3%), and Health Diagnosing & Treating (490 | 4.9%).
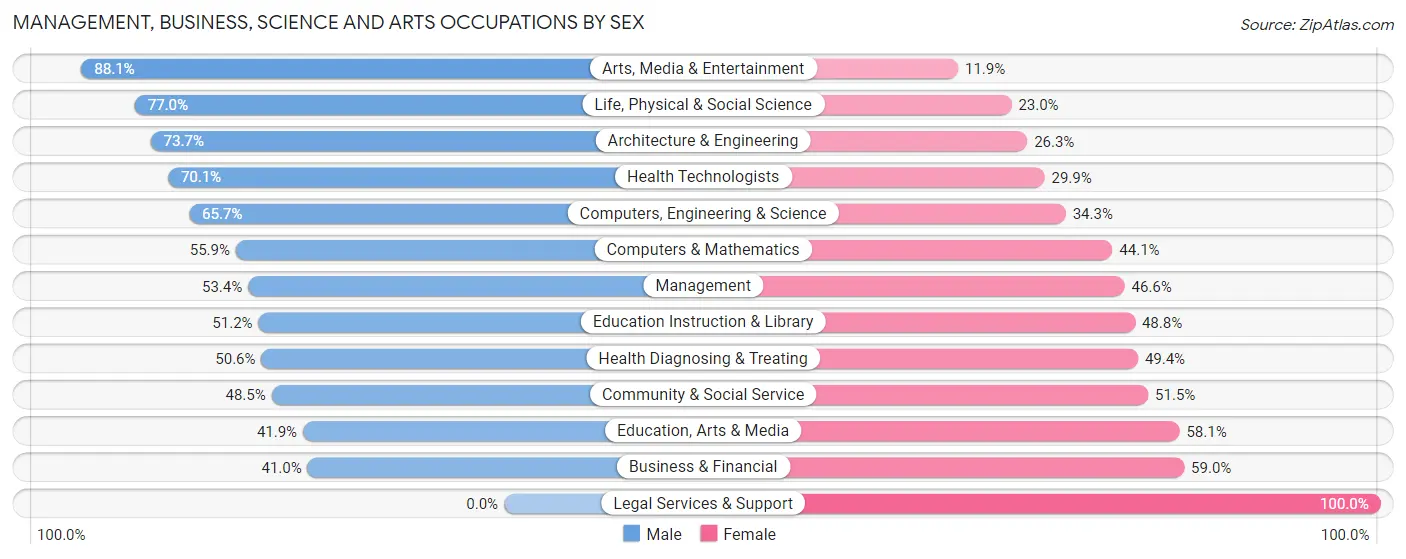
Management, Business, Science and Arts Occupations by Sex
Within the Management, Business, Science and Arts occupations in Ellensburg, the most male-oriented occupations are Arts, Media & Entertainment (88.1%), Life, Physical & Social Science (77.0%), and Architecture & Engineering (73.7%), while the most female-oriented occupations are Legal Services & Support (100.0%), Business & Financial (59.0%), and Education, Arts & Media (58.1%).
| Occupation | Male | Female |
| Management | 410 (53.4%) | 358 (46.6%) |
| Business & Financial | 118 (41.0%) | 170 (59.0%) |
| Computers, Engineering & Science | 352 (65.7%) | 184 (34.3%) |
| Computers & Mathematics | 146 (55.9%) | 115 (44.1%) |
| Architecture & Engineering | 129 (73.7%) | 46 (26.3%) |
| Life, Physical & Social Science | 77 (77.0%) | 23 (23.0%) |
| Community & Social Service | 800 (48.5%) | 850 (51.5%) |
| Education, Arts & Media | 156 (41.9%) | 216 (58.1%) |
| Legal Services & Support | 0 (0.0%) | 106 (100.0%) |
| Education Instruction & Library | 540 (51.2%) | 514 (48.8%) |
| Arts, Media & Entertainment | 104 (88.1%) | 14 (11.9%) |
| Health Diagnosing & Treating | 248 (50.6%) | 242 (49.4%) |
| Health Technologists | 232 (70.1%) | 99 (29.9%) |
| Total (Category) | 1,928 (51.7%) | 1,804 (48.3%) |
| Total (Overall) | 5,157 (51.3%) | 4,896 (48.7%) |
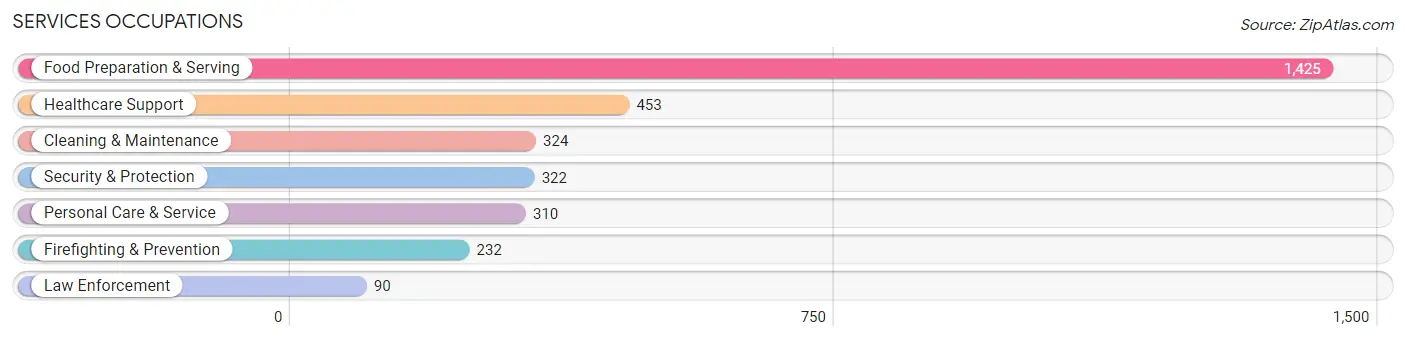
Services Occupations
The most common Services occupations in Ellensburg are Food Preparation & Serving (1,425 | 14.2%), Healthcare Support (453 | 4.5%), Cleaning & Maintenance (324 | 3.2%), Security & Protection (322 | 3.2%), and Personal Care & Service (310 | 3.1%).
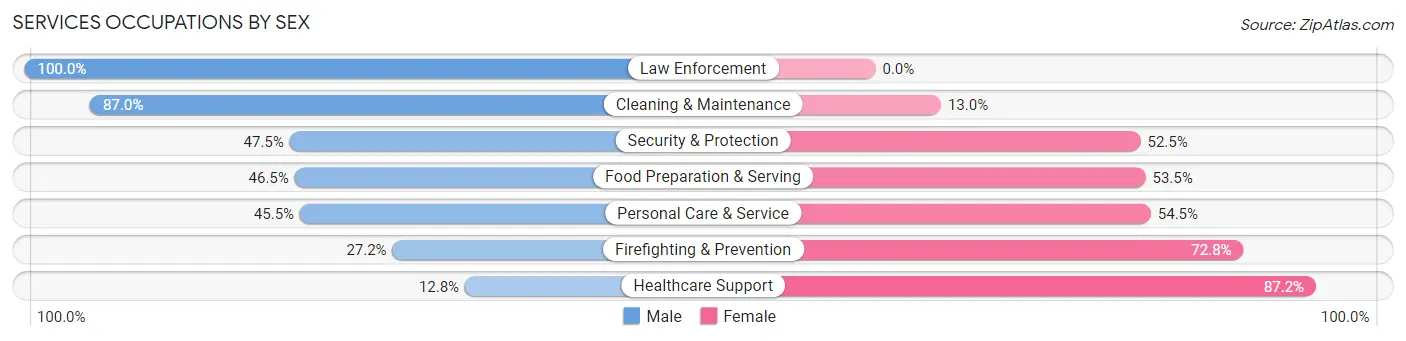
Services Occupations by Sex
Within the Services occupations in Ellensburg, the most male-oriented occupations are Law Enforcement (100.0%), Cleaning & Maintenance (87.0%), and Security & Protection (47.5%), while the most female-oriented occupations are Healthcare Support (87.2%), Firefighting & Prevention (72.8%), and Personal Care & Service (54.5%).
| Occupation | Male | Female |
| Healthcare Support | 58 (12.8%) | 395 (87.2%) |
| Security & Protection | 153 (47.5%) | 169 (52.5%) |
| Firefighting & Prevention | 63 (27.2%) | 169 (72.8%) |
| Law Enforcement | 90 (100.0%) | 0 (0.0%) |
| Food Preparation & Serving | 663 (46.5%) | 762 (53.5%) |
| Cleaning & Maintenance | 282 (87.0%) | 42 (13.0%) |
| Personal Care & Service | 141 (45.5%) | 169 (54.5%) |
| Total (Category) | 1,297 (45.8%) | 1,537 (54.2%) |
| Total (Overall) | 5,157 (51.3%) | 4,896 (48.7%) |
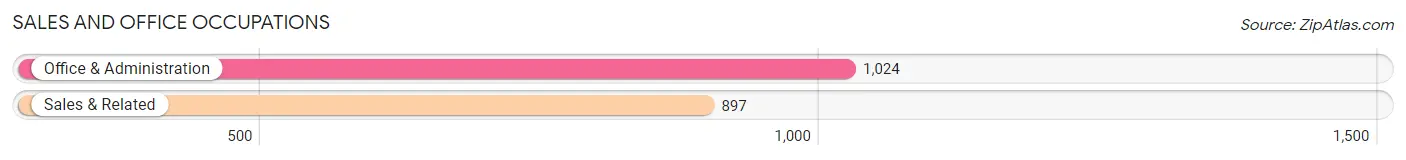
Sales and Office Occupations
The most common Sales and Office occupations in Ellensburg are Office & Administration (1,024 | 10.2%), and Sales & Related (897 | 8.9%).
Sales and Office Occupations by Sex
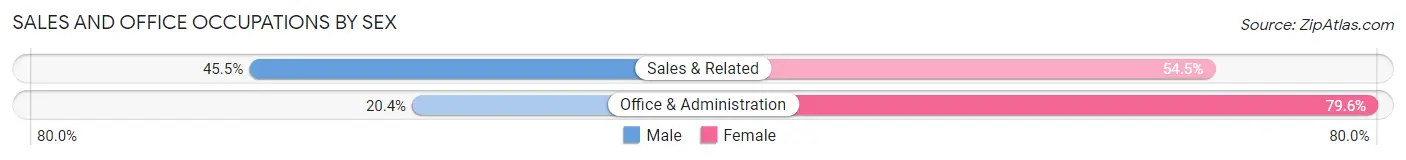
| Occupation | Male | Female |
| Sales & Related | 408 (45.5%) | 489 (54.5%) |
| Office & Administration | 209 (20.4%) | 815 (79.6%) |
| Total (Category) | 617 (32.1%) | 1,304 (67.9%) |
| Total (Overall) | 5,157 (51.3%) | 4,896 (48.7%) |
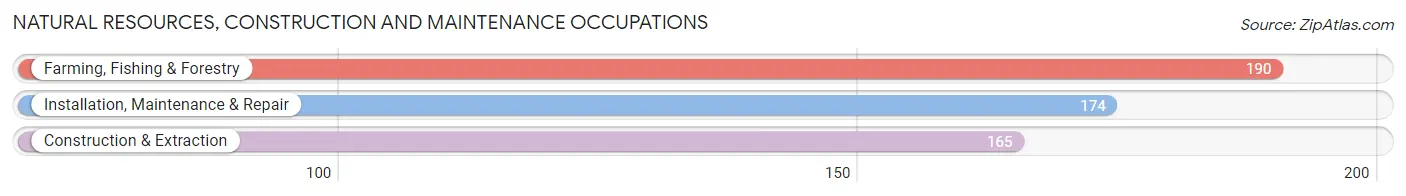
Natural Resources, Construction and Maintenance Occupations
The most common Natural Resources, Construction and Maintenance occupations in Ellensburg are Farming, Fishing & Forestry (190 | 1.9%), Installation, Maintenance & Repair (174 | 1.7%), and Construction & Extraction (165 | 1.6%).
Natural Resources, Construction and Maintenance Occupations by Sex
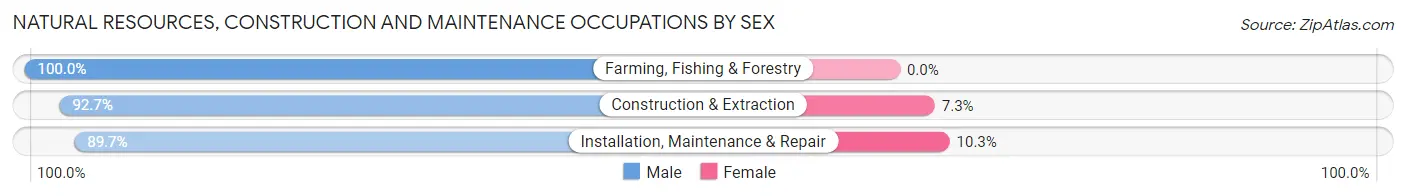
| Occupation | Male | Female |
| Farming, Fishing & Forestry | 190 (100.0%) | 0 (0.0%) |
| Construction & Extraction | 153 (92.7%) | 12 (7.3%) |
| Installation, Maintenance & Repair | 156 (89.7%) | 18 (10.3%) |
| Total (Category) | 499 (94.3%) | 30 (5.7%) |
| Total (Overall) | 5,157 (51.3%) | 4,896 (48.7%) |
Production, Transportation and Moving Occupations
The most common Production, Transportation and Moving occupations in Ellensburg are Material Moving (476 | 4.7%), Production (360 | 3.6%), and Transportation (201 | 2.0%).
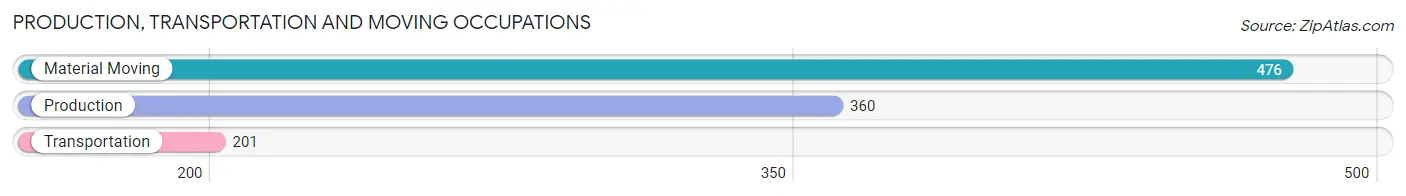
Production, Transportation and Moving Occupations by Sex
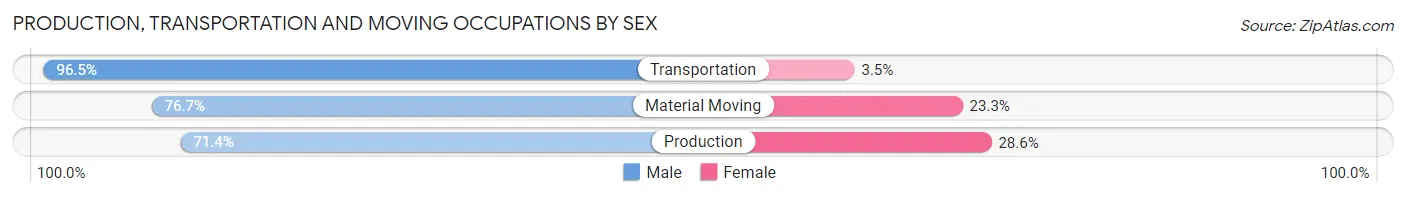
| Occupation | Male | Female |
| Production | 257 (71.4%) | 103 (28.6%) |
| Transportation | 194 (96.5%) | 7 (3.5%) |
| Material Moving | 365 (76.7%) | 111 (23.3%) |
| Total (Category) | 816 (78.7%) | 221 (21.3%) |
| Total (Overall) | 5,157 (51.3%) | 4,896 (48.7%) |
Employment Industries by Sex in Ellensburg
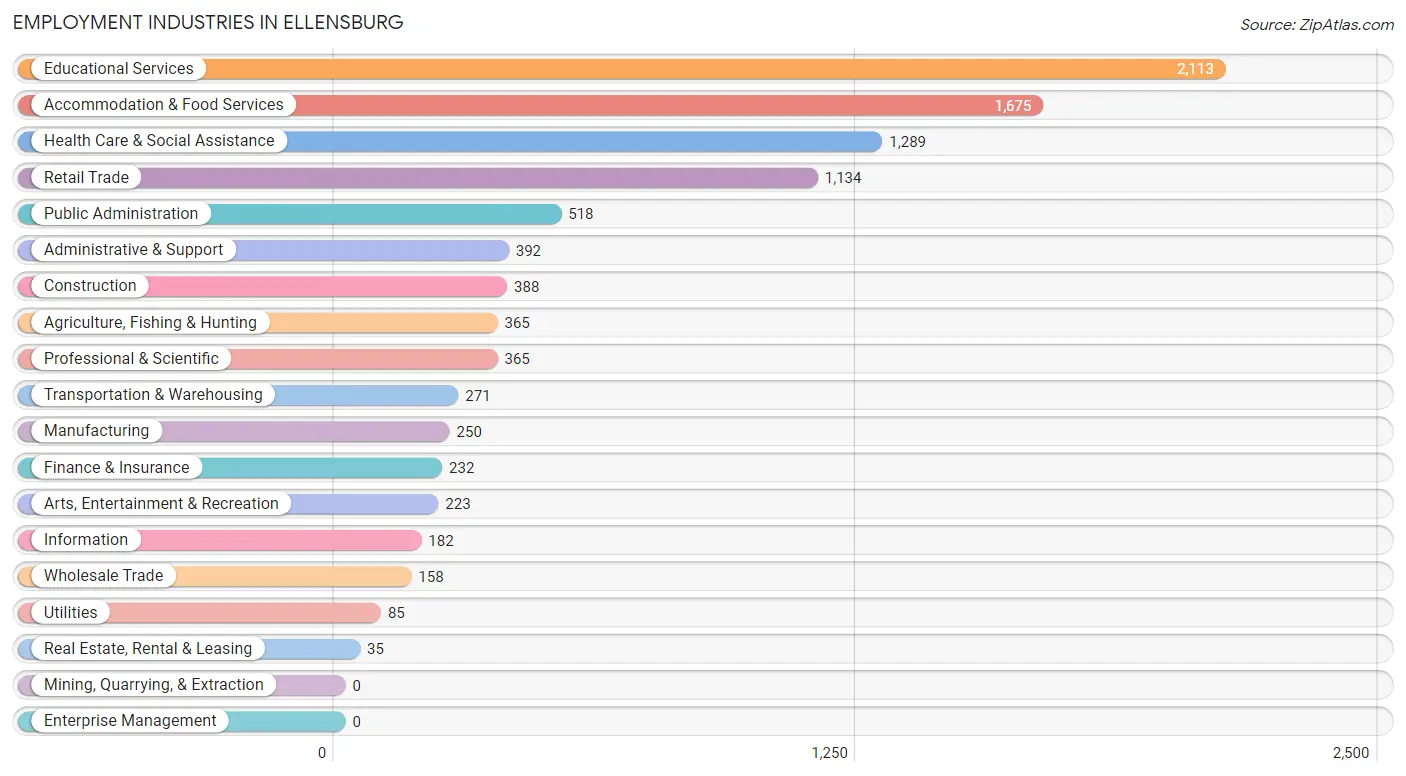
Employment Industries in Ellensburg
The major employment industries in Ellensburg include Educational Services (2,113 | 21.0%), Accommodation & Food Services (1,675 | 16.7%), Health Care & Social Assistance (1,289 | 12.8%), Retail Trade (1,134 | 11.3%), and Public Administration (518 | 5.1%).
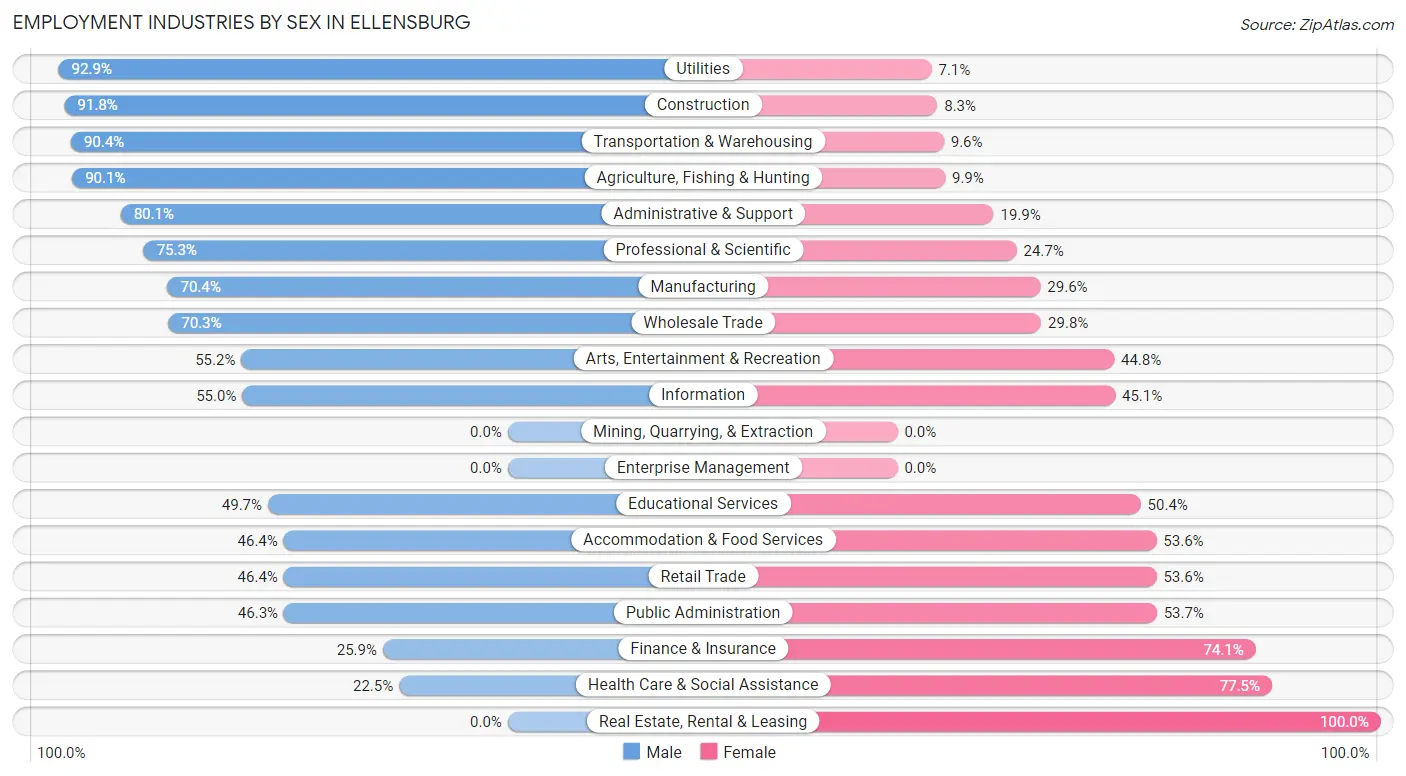
Employment Industries by Sex in Ellensburg
The Ellensburg industries that see more men than women are Utilities (92.9%), Construction (91.7%), and Transportation & Warehousing (90.4%), whereas the industries that tend to have a higher number of women are Real Estate, Rental & Leasing (100.0%), Health Care & Social Assistance (77.5%), and Finance & Insurance (74.1%).
| Industry | Male | Female |
| Agriculture, Fishing & Hunting | 329 (90.1%) | 36 (9.9%) |
| Mining, Quarrying, & Extraction | 0 (0.0%) | 0 (0.0%) |
| Construction | 356 (91.7%) | 32 (8.3%) |
| Manufacturing | 176 (70.4%) | 74 (29.6%) |
| Wholesale Trade | 111 (70.3%) | 47 (29.7%) |
| Retail Trade | 526 (46.4%) | 608 (53.6%) |
| Transportation & Warehousing | 245 (90.4%) | 26 (9.6%) |
| Utilities | 79 (92.9%) | 6 (7.1%) |
| Information | 100 (54.9%) | 82 (45.1%) |
| Finance & Insurance | 60 (25.9%) | 172 (74.1%) |
| Real Estate, Rental & Leasing | 0 (0.0%) | 35 (100.0%) |
| Professional & Scientific | 275 (75.3%) | 90 (24.7%) |
| Enterprise Management | 0 (0.0%) | 0 (0.0%) |
| Administrative & Support | 314 (80.1%) | 78 (19.9%) |
| Educational Services | 1,049 (49.6%) | 1,064 (50.3%) |
| Health Care & Social Assistance | 290 (22.5%) | 999 (77.5%) |
| Arts, Entertainment & Recreation | 123 (55.2%) | 100 (44.8%) |
| Accommodation & Food Services | 777 (46.4%) | 898 (53.6%) |
| Public Administration | 240 (46.3%) | 278 (53.7%) |
| Total | 5,157 (51.3%) | 4,896 (48.7%) |
Education in Ellensburg
School Enrollment in Ellensburg
The most common levels of schooling among the 8,217 students in Ellensburg are college / undergraduate (5,450 | 66.3%), elementary school (688 | 8.4%), and middle school (665 | 8.1%).
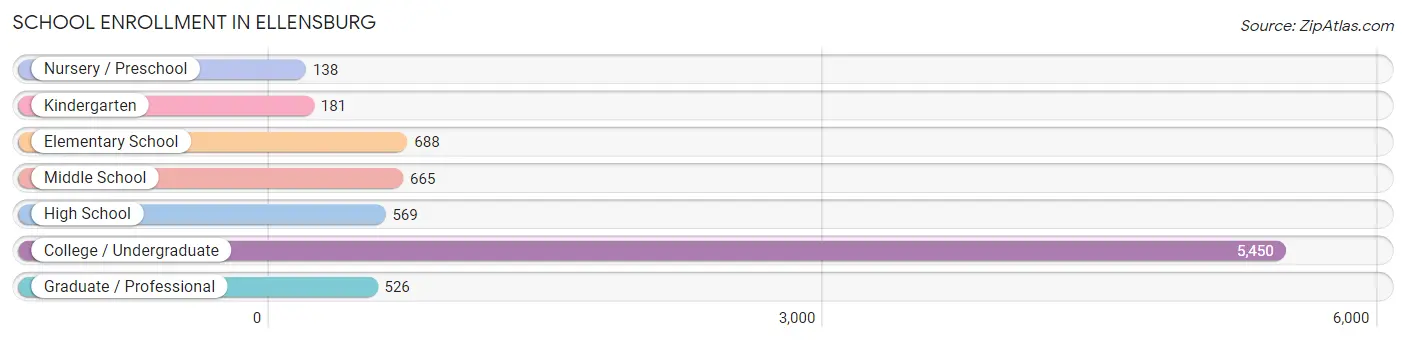
| School Level | # Students | % Students |
| Nursery / Preschool | 138 | 1.7% |
| Kindergarten | 181 | 2.2% |
| Elementary School | 688 | 8.4% |
| Middle School | 665 | 8.1% |
| High School | 569 | 6.9% |
| College / Undergraduate | 5,450 | 66.3% |
| Graduate / Professional | 526 | 6.4% |
| Total | 8,217 | 100.0% |
School Enrollment by Age by Funding Source in Ellensburg
Out of a total of 8,217 students who are enrolled in schools in Ellensburg, 255 (3.1%) attend a private institution, while the remaining 7,962 (96.9%) are enrolled in public schools. The age group of 5 to 9 year old has the highest likelihood of being enrolled in private schools, with 79 (10.4% in the age bracket) enrolled. Conversely, the age group of 3 to 4 year olds has the lowest likelihood of being enrolled in a private school, with 71 (100.0% in the age bracket) attending a public institution.
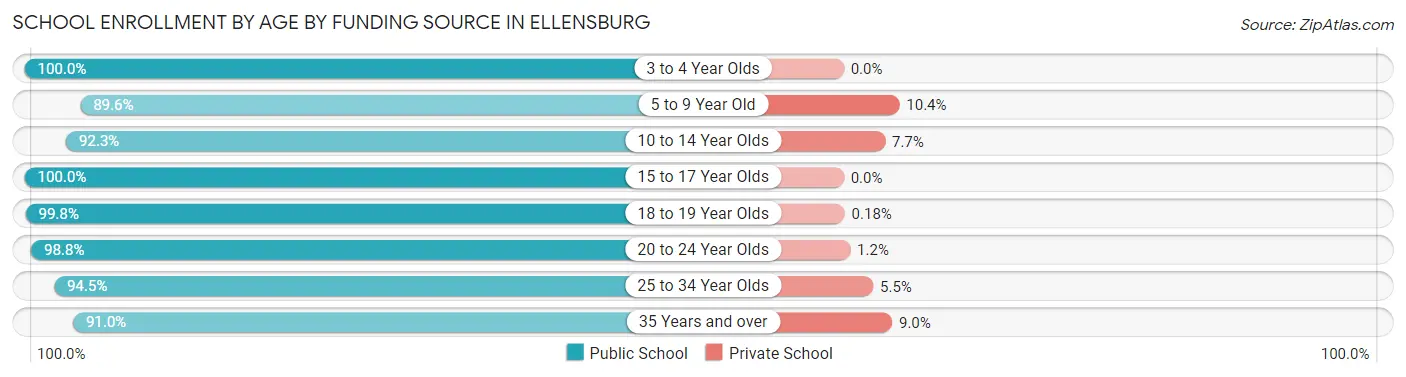
| Age Bracket | Public School | Private School |
| 3 to 4 Year Olds | 71 (100.0%) | 0 (0.0%) |
| 5 to 9 Year Old | 683 (89.6%) | 79 (10.4%) |
| 10 to 14 Year Olds | 803 (92.3%) | 67 (7.7%) |
| 15 to 17 Year Olds | 374 (100.0%) | 0 (0.0%) |
| 18 to 19 Year Olds | 2,251 (99.8%) | 4 (0.2%) |
| 20 to 24 Year Olds | 2,853 (98.8%) | 35 (1.2%) |
| 25 to 34 Year Olds | 638 (94.5%) | 37 (5.5%) |
| 35 Years and over | 293 (91.0%) | 29 (9.0%) |
| Total | 7,962 (96.9%) | 255 (3.1%) |
Educational Attainment by Field of Study in Ellensburg
Education (730 | 14.4%), social sciences (593 | 11.7%), bio, nature & agricultural (507 | 10.0%), visual & performing arts (427 | 8.4%), and business (398 | 7.9%) are the most common fields of study among 5,070 individuals in Ellensburg who have obtained a bachelor's degree or higher.
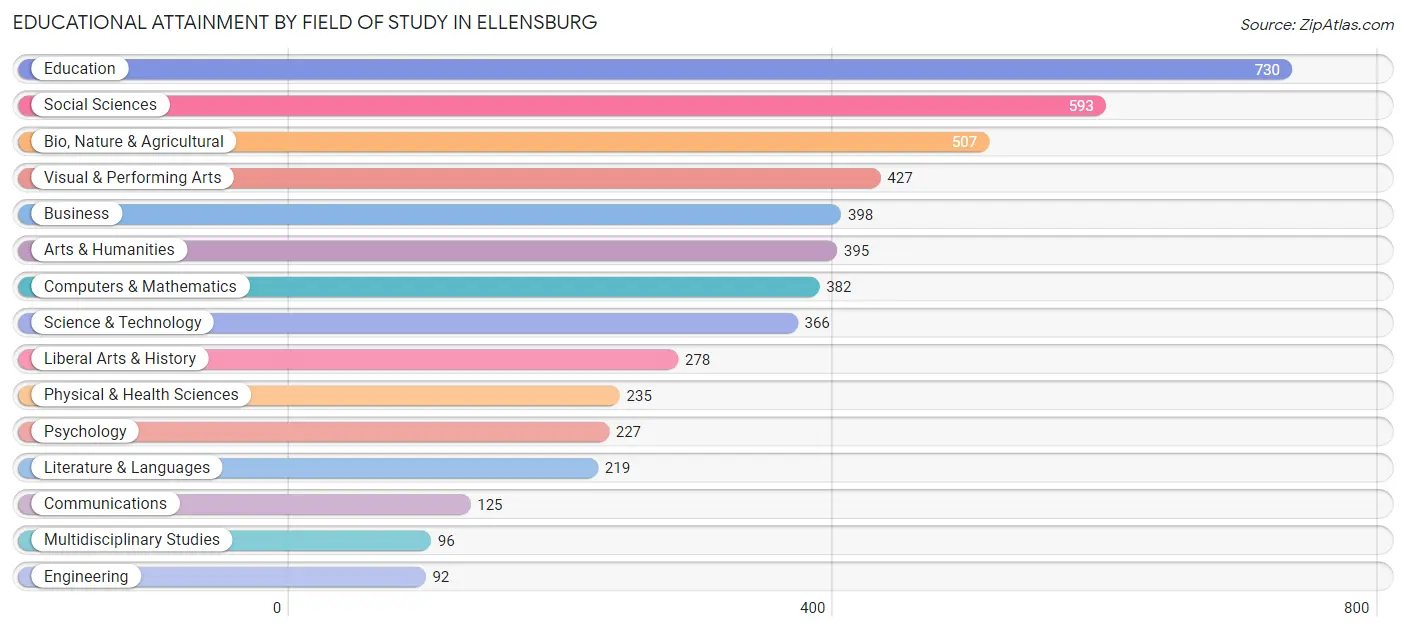
| Field of Study | # Graduates | % Graduates |
| Computers & Mathematics | 382 | 7.5% |
| Bio, Nature & Agricultural | 507 | 10.0% |
| Physical & Health Sciences | 235 | 4.6% |
| Psychology | 227 | 4.5% |
| Social Sciences | 593 | 11.7% |
| Engineering | 92 | 1.8% |
| Multidisciplinary Studies | 96 | 1.9% |
| Science & Technology | 366 | 7.2% |
| Business | 398 | 7.9% |
| Education | 730 | 14.4% |
| Literature & Languages | 219 | 4.3% |
| Liberal Arts & History | 278 | 5.5% |
| Visual & Performing Arts | 427 | 8.4% |
| Communications | 125 | 2.5% |
| Arts & Humanities | 395 | 7.8% |
| Total | 5,070 | 100.0% |
Transportation & Commute in Ellensburg
Vehicle Availability by Sex in Ellensburg
The most prevalent vehicle ownership categories in Ellensburg are males with 2 vehicles (2,001, accounting for 41.5%) and females with 2 vehicles (1,829, making up 45.4%).
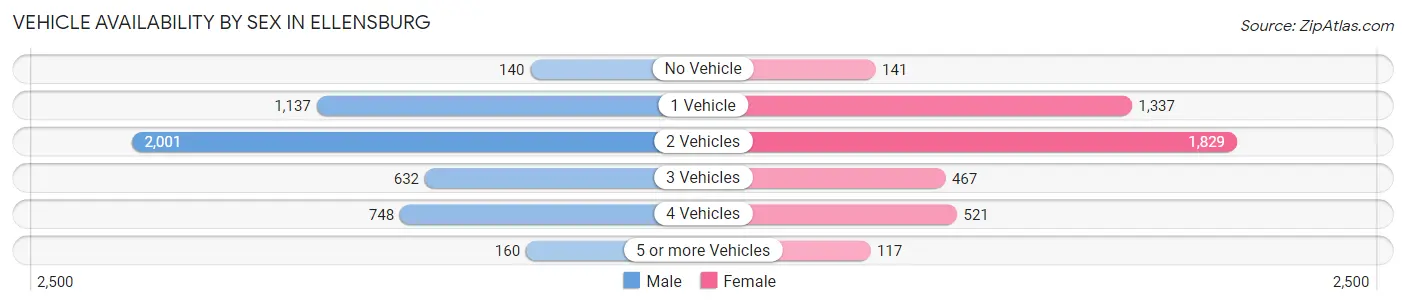
| Vehicles Available | Male | Female |
| No Vehicle | 140 (2.9%) | 141 (3.2%) |
| 1 Vehicle | 1,137 (23.6%) | 1,337 (30.3%) |
| 2 Vehicles | 2,001 (41.5%) | 1,829 (41.5%) |
| 3 Vehicles | 632 (13.1%) | 467 (10.6%) |
| 4 Vehicles | 748 (15.5%) | 521 (11.8%) |
| 5 or more Vehicles | 160 (3.3%) | 117 (2.6%) |
| Total | 4,818 (100.0%) | 4,412 (100.0%) |
Commute Time in Ellensburg
The most frequently occuring commute durations in Ellensburg are 5 to 9 minutes (2,873 commuters, 32.3%), 10 to 14 minutes (2,048 commuters, 23.0%), and less than 5 minutes (888 commuters, 10.0%).
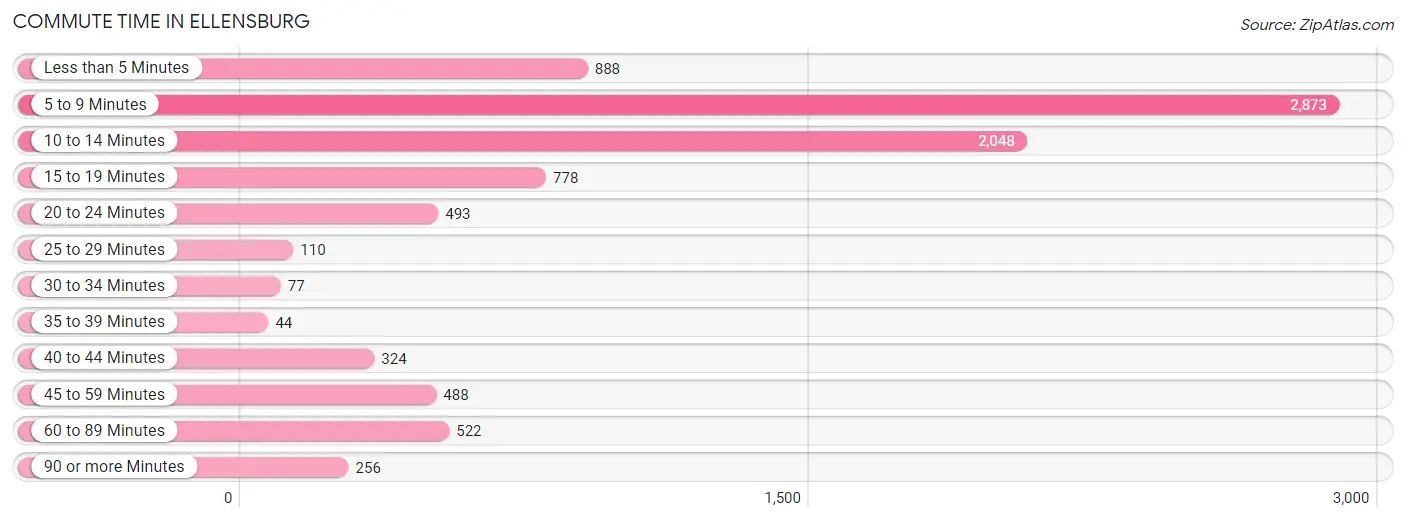
| Commute Time | # Commuters | % Commuters |
| Less than 5 Minutes | 888 | 10.0% |
| 5 to 9 Minutes | 2,873 | 32.3% |
| 10 to 14 Minutes | 2,048 | 23.0% |
| 15 to 19 Minutes | 778 | 8.7% |
| 20 to 24 Minutes | 493 | 5.5% |
| 25 to 29 Minutes | 110 | 1.2% |
| 30 to 34 Minutes | 77 | 0.9% |
| 35 to 39 Minutes | 44 | 0.5% |
| 40 to 44 Minutes | 324 | 3.6% |
| 45 to 59 Minutes | 488 | 5.5% |
| 60 to 89 Minutes | 522 | 5.9% |
| 90 or more Minutes | 256 | 2.9% |
Commute Time by Sex in Ellensburg
The most common commute times in Ellensburg are 5 to 9 minutes (1,465 commuters, 31.7%) for males and 5 to 9 minutes (1,408 commuters, 33.0%) for females.
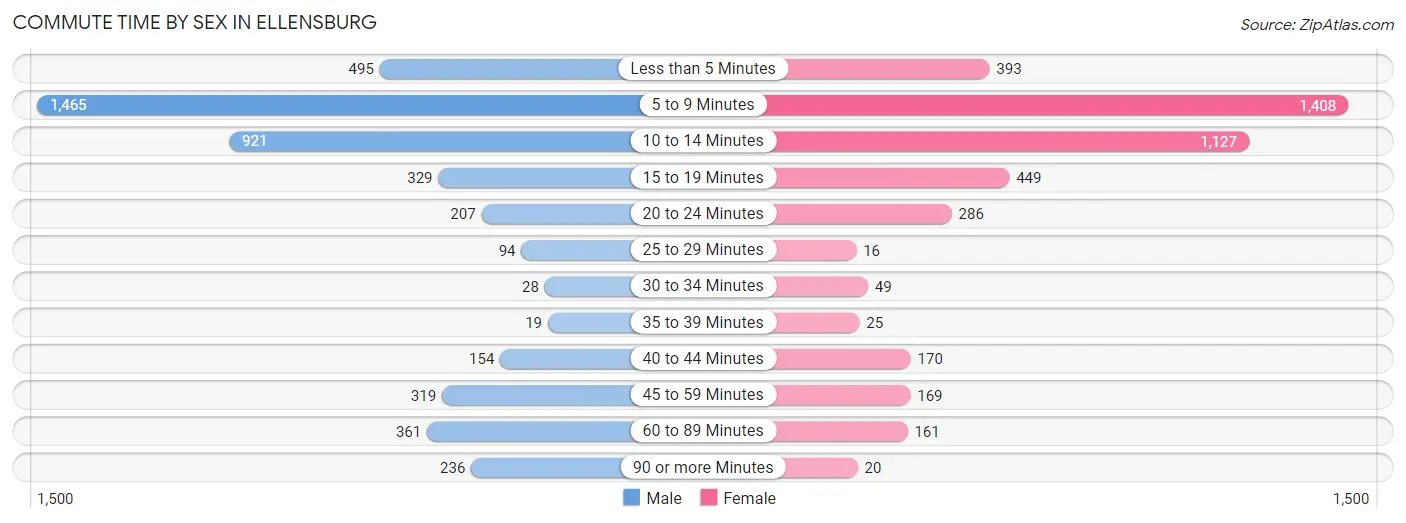
| Commute Time | Male | Female |
| Less than 5 Minutes | 495 (10.7%) | 393 (9.2%) |
| 5 to 9 Minutes | 1,465 (31.7%) | 1,408 (33.0%) |
| 10 to 14 Minutes | 921 (19.9%) | 1,127 (26.4%) |
| 15 to 19 Minutes | 329 (7.1%) | 449 (10.5%) |
| 20 to 24 Minutes | 207 (4.5%) | 286 (6.7%) |
| 25 to 29 Minutes | 94 (2.0%) | 16 (0.4%) |
| 30 to 34 Minutes | 28 (0.6%) | 49 (1.1%) |
| 35 to 39 Minutes | 19 (0.4%) | 25 (0.6%) |
| 40 to 44 Minutes | 154 (3.3%) | 170 (4.0%) |
| 45 to 59 Minutes | 319 (6.9%) | 169 (4.0%) |
| 60 to 89 Minutes | 361 (7.8%) | 161 (3.8%) |
| 90 or more Minutes | 236 (5.1%) | 20 (0.5%) |
Time of Departure to Work by Sex in Ellensburg
The most frequent times of departure to work in Ellensburg are 7:30 AM to 7:59 AM (858, 18.5%) for males and 7:30 AM to 7:59 AM (815, 19.1%) for females.
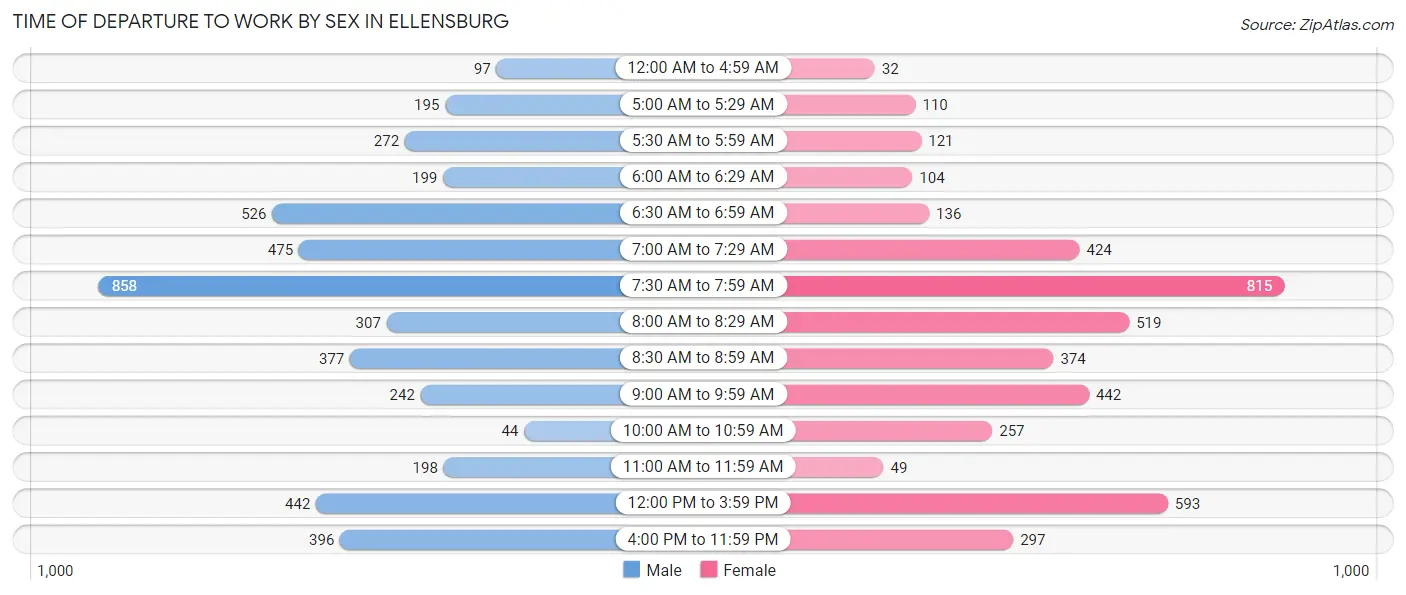
| Time of Departure | Male | Female |
| 12:00 AM to 4:59 AM | 97 (2.1%) | 32 (0.7%) |
| 5:00 AM to 5:29 AM | 195 (4.2%) | 110 (2.6%) |
| 5:30 AM to 5:59 AM | 272 (5.9%) | 121 (2.8%) |
| 6:00 AM to 6:29 AM | 199 (4.3%) | 104 (2.4%) |
| 6:30 AM to 6:59 AM | 526 (11.4%) | 136 (3.2%) |
| 7:00 AM to 7:29 AM | 475 (10.3%) | 424 (9.9%) |
| 7:30 AM to 7:59 AM | 858 (18.5%) | 815 (19.1%) |
| 8:00 AM to 8:29 AM | 307 (6.6%) | 519 (12.1%) |
| 8:30 AM to 8:59 AM | 377 (8.2%) | 374 (8.7%) |
| 9:00 AM to 9:59 AM | 242 (5.2%) | 442 (10.3%) |
| 10:00 AM to 10:59 AM | 44 (0.9%) | 257 (6.0%) |
| 11:00 AM to 11:59 AM | 198 (4.3%) | 49 (1.1%) |
| 12:00 PM to 3:59 PM | 442 (9.6%) | 593 (13.9%) |
| 4:00 PM to 11:59 PM | 396 (8.6%) | 297 (7.0%) |
| Total | 4,628 (100.0%) | 4,273 (100.0%) |
Housing Occupancy in Ellensburg
Occupancy by Ownership in Ellensburg
Of the total 8,324 dwellings in Ellensburg, owner-occupied units account for 3,138 (37.7%), while renter-occupied units make up 5,186 (62.3%).
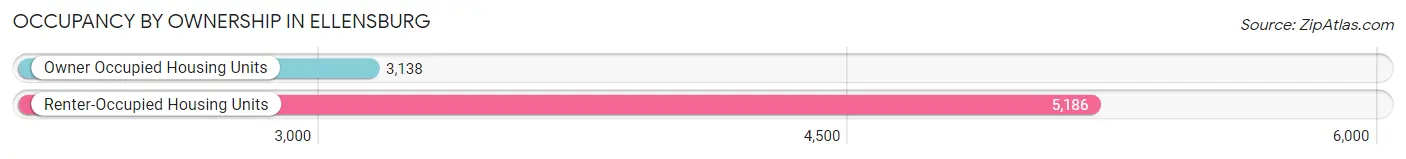
| Occupancy | # Housing Units | % Housing Units |
| Owner Occupied Housing Units | 3,138 | 37.7% |
| Renter-Occupied Housing Units | 5,186 | 62.3% |
| Total Occupied Housing Units | 8,324 | 100.0% |
Occupancy by Household Size in Ellensburg
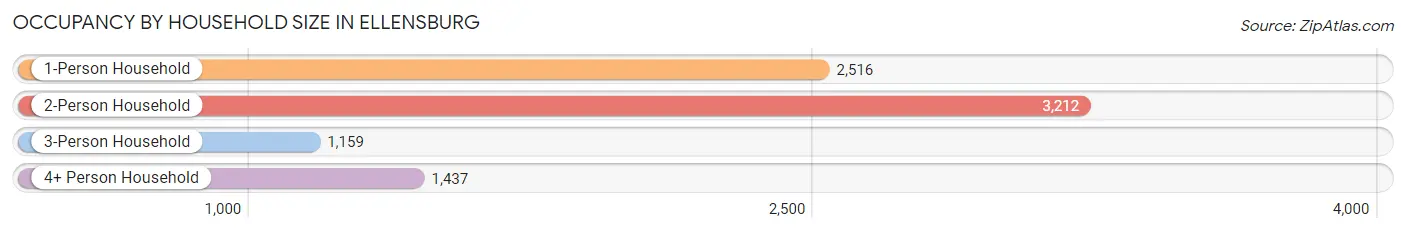
| Household Size | # Housing Units | % Housing Units |
| 1-Person Household | 2,516 | 30.2% |
| 2-Person Household | 3,212 | 38.6% |
| 3-Person Household | 1,159 | 13.9% |
| 4+ Person Household | 1,437 | 17.3% |
| Total Housing Units | 8,324 | 100.0% |
Occupancy by Ownership by Household Size in Ellensburg
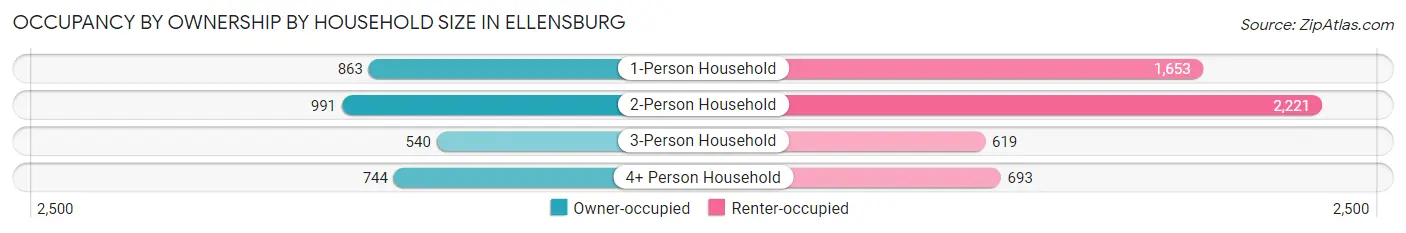
| Household Size | Owner-occupied | Renter-occupied |
| 1-Person Household | 863 (34.3%) | 1,653 (65.7%) |
| 2-Person Household | 991 (30.8%) | 2,221 (69.2%) |
| 3-Person Household | 540 (46.6%) | 619 (53.4%) |
| 4+ Person Household | 744 (51.8%) | 693 (48.2%) |
| Total Housing Units | 3,138 (37.7%) | 5,186 (62.3%) |
Occupancy by Educational Attainment in Ellensburg
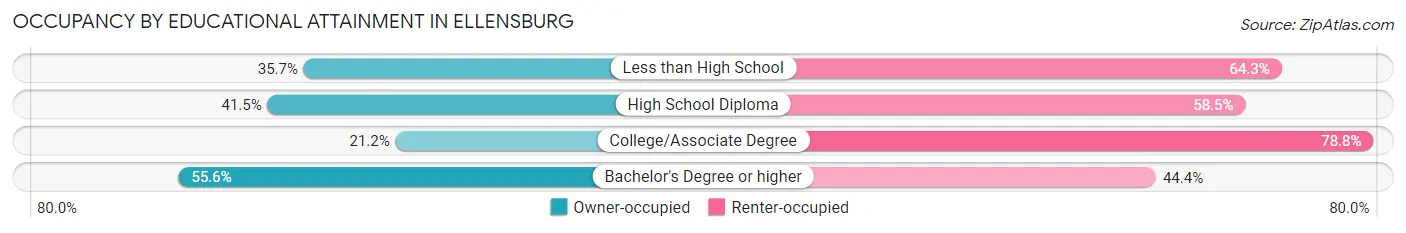
| Household Size | Owner-occupied | Renter-occupied |
| Less than High School | 110 (35.7%) | 198 (64.3%) |
| High School Diploma | 592 (41.5%) | 836 (58.5%) |
| College/Associate Degree | 754 (21.2%) | 2,810 (78.8%) |
| Bachelor's Degree or higher | 1,682 (55.6%) | 1,342 (44.4%) |
Occupancy by Age of Householder in Ellensburg
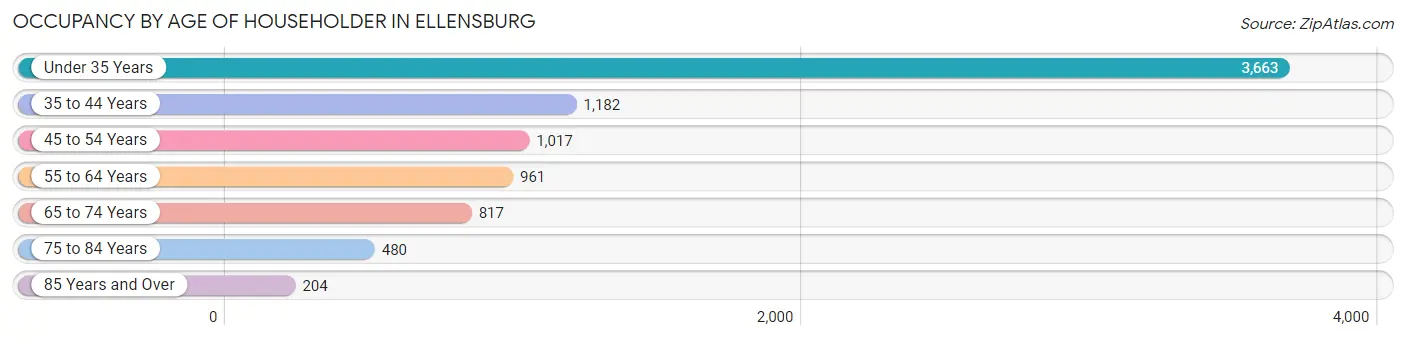
| Age Bracket | # Households | % Households |
| Under 35 Years | 3,663 | 44.0% |
| 35 to 44 Years | 1,182 | 14.2% |
| 45 to 54 Years | 1,017 | 12.2% |
| 55 to 64 Years | 961 | 11.5% |
| 65 to 74 Years | 817 | 9.8% |
| 75 to 84 Years | 480 | 5.8% |
| 85 Years and Over | 204 | 2.5% |
| Total | 8,324 | 100.0% |
Housing Finances in Ellensburg
Median Income by Occupancy in Ellensburg
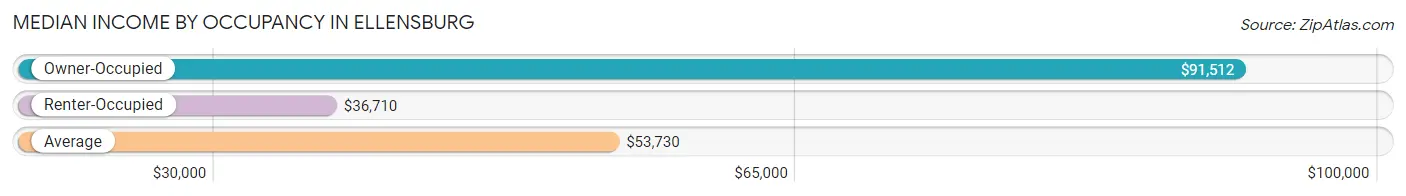
| Occupancy Type | # Households | Median Income |
| Owner-Occupied | 3,138 (37.7%) | $91,512 |
| Renter-Occupied | 5,186 (62.3%) | $36,710 |
| Average | 8,324 (100.0%) | $53,730 |
Occupancy by Householder Income Bracket in Ellensburg
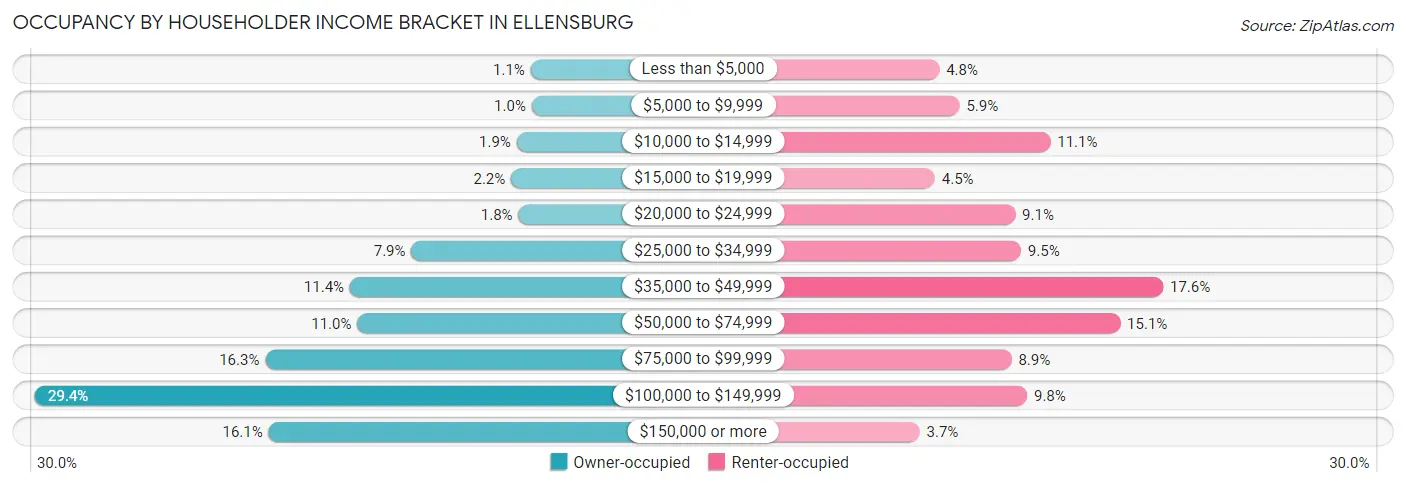
| Income Bracket | Owner-occupied | Renter-occupied |
| Less than $5,000 | 34 (1.1%) | 248 (4.8%) |
| $5,000 to $9,999 | 32 (1.0%) | 308 (5.9%) |
| $10,000 to $14,999 | 59 (1.9%) | 577 (11.1%) |
| $15,000 to $19,999 | 69 (2.2%) | 235 (4.5%) |
| $20,000 to $24,999 | 56 (1.8%) | 473 (9.1%) |
| $25,000 to $34,999 | 248 (7.9%) | 490 (9.5%) |
| $35,000 to $49,999 | 358 (11.4%) | 911 (17.6%) |
| $50,000 to $74,999 | 345 (11.0%) | 784 (15.1%) |
| $75,000 to $99,999 | 510 (16.3%) | 462 (8.9%) |
| $100,000 to $149,999 | 923 (29.4%) | 508 (9.8%) |
| $150,000 or more | 504 (16.1%) | 190 (3.7%) |
| Total | 3,138 (100.0%) | 5,186 (100.0%) |
Monthly Housing Cost Tiers in Ellensburg
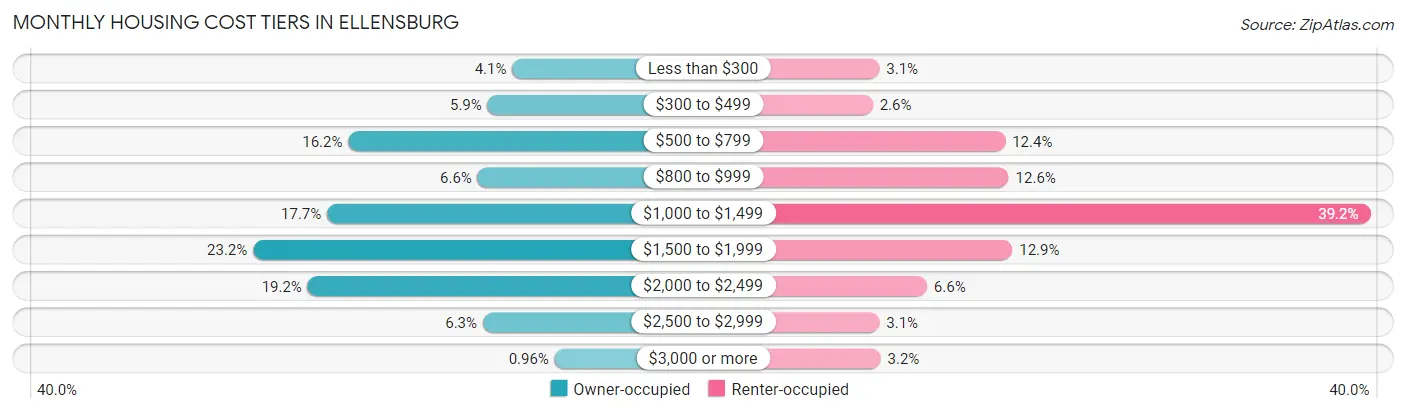
| Monthly Cost | Owner-occupied | Renter-occupied |
| Less than $300 | 128 (4.1%) | 160 (3.1%) |
| $300 to $499 | 185 (5.9%) | 135 (2.6%) |
| $500 to $799 | 507 (16.2%) | 641 (12.4%) |
| $800 to $999 | 208 (6.6%) | 654 (12.6%) |
| $1,000 to $1,499 | 556 (17.7%) | 2,035 (39.2%) |
| $1,500 to $1,999 | 727 (23.2%) | 668 (12.9%) |
| $2,000 to $2,499 | 601 (19.2%) | 342 (6.6%) |
| $2,500 to $2,999 | 196 (6.2%) | 160 (3.1%) |
| $3,000 or more | 30 (1.0%) | 165 (3.2%) |
| Total | 3,138 (100.0%) | 5,186 (100.0%) |
Physical Housing Characteristics in Ellensburg
Housing Structures in Ellensburg
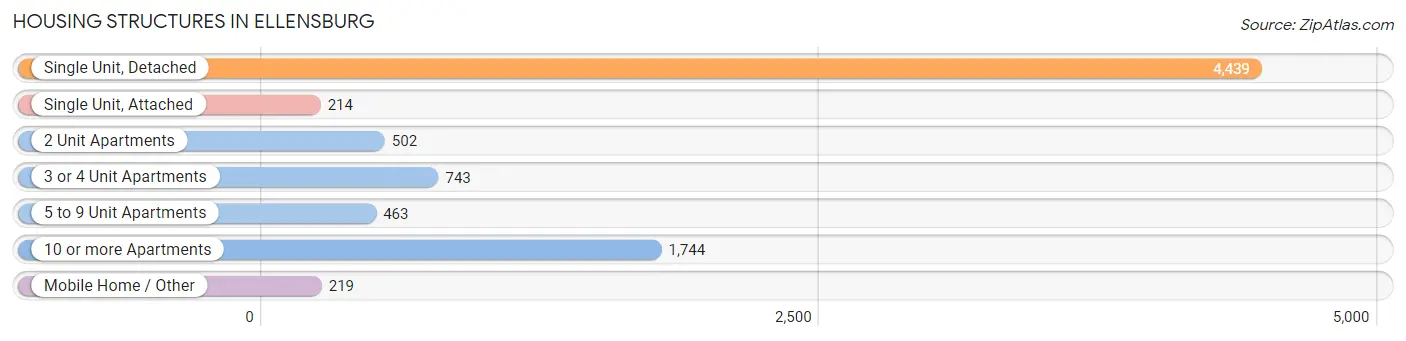
| Structure Type | # Housing Units | % Housing Units |
| Single Unit, Detached | 4,439 | 53.3% |
| Single Unit, Attached | 214 | 2.6% |
| 2 Unit Apartments | 502 | 6.0% |
| 3 or 4 Unit Apartments | 743 | 8.9% |
| 5 to 9 Unit Apartments | 463 | 5.6% |
| 10 or more Apartments | 1,744 | 20.9% |
| Mobile Home / Other | 219 | 2.6% |
| Total | 8,324 | 100.0% |
Housing Structures by Occupancy in Ellensburg
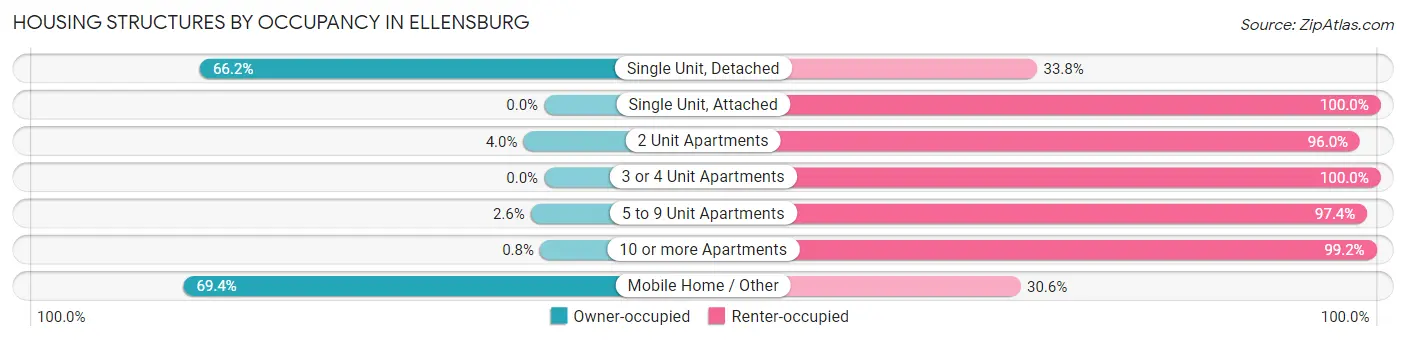
| Structure Type | Owner-occupied | Renter-occupied |
| Single Unit, Detached | 2,940 (66.2%) | 1,499 (33.8%) |
| Single Unit, Attached | 0 (0.0%) | 214 (100.0%) |
| 2 Unit Apartments | 20 (4.0%) | 482 (96.0%) |
| 3 or 4 Unit Apartments | 0 (0.0%) | 743 (100.0%) |
| 5 to 9 Unit Apartments | 12 (2.6%) | 451 (97.4%) |
| 10 or more Apartments | 14 (0.8%) | 1,730 (99.2%) |
| Mobile Home / Other | 152 (69.4%) | 67 (30.6%) |
| Total | 3,138 (37.7%) | 5,186 (62.3%) |
Housing Structures by Number of Rooms in Ellensburg
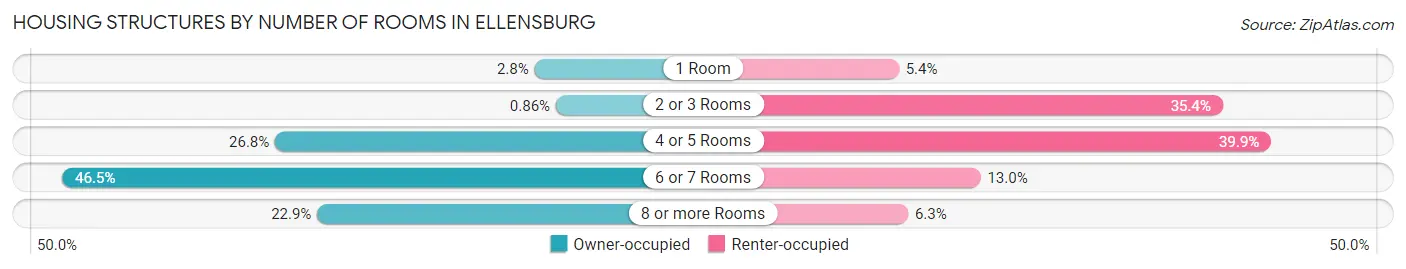
| Number of Rooms | Owner-occupied | Renter-occupied |
| 1 Room | 89 (2.8%) | 282 (5.4%) |
| 2 or 3 Rooms | 27 (0.9%) | 1,836 (35.4%) |
| 4 or 5 Rooms | 842 (26.8%) | 2,068 (39.9%) |
| 6 or 7 Rooms | 1,460 (46.5%) | 674 (13.0%) |
| 8 or more Rooms | 720 (22.9%) | 326 (6.3%) |
| Total | 3,138 (100.0%) | 5,186 (100.0%) |
Housing Structure by Heating Type in Ellensburg
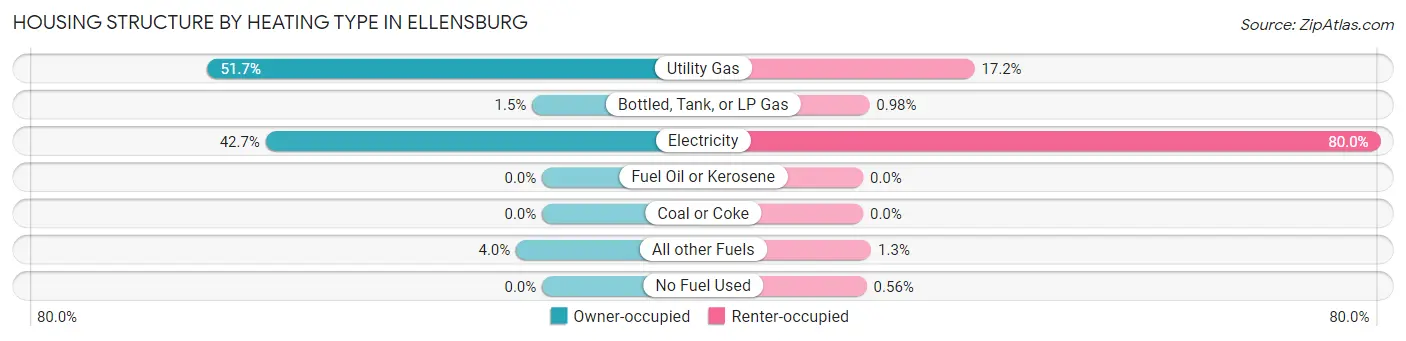
| Heating Type | Owner-occupied | Renter-occupied |
| Utility Gas | 1,623 (51.7%) | 893 (17.2%) |
| Bottled, Tank, or LP Gas | 48 (1.5%) | 51 (1.0%) |
| Electricity | 1,341 (42.7%) | 4,148 (80.0%) |
| Fuel Oil or Kerosene | 0 (0.0%) | 0 (0.0%) |
| Coal or Coke | 0 (0.0%) | 0 (0.0%) |
| All other Fuels | 126 (4.0%) | 65 (1.3%) |
| No Fuel Used | 0 (0.0%) | 29 (0.6%) |
| Total | 3,138 (100.0%) | 5,186 (100.0%) |
Household Vehicle Usage in Ellensburg
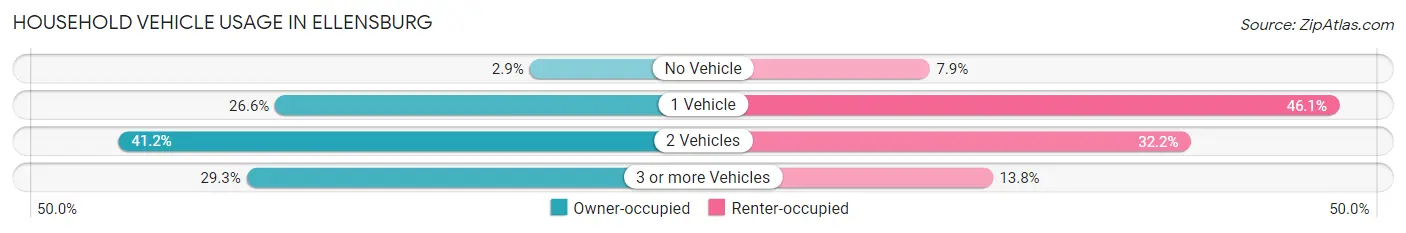
| Vehicles per Household | Owner-occupied | Renter-occupied |
| No Vehicle | 90 (2.9%) | 409 (7.9%) |
| 1 Vehicle | 835 (26.6%) | 2,391 (46.1%) |
| 2 Vehicles | 1,294 (41.2%) | 1,672 (32.2%) |
| 3 or more Vehicles | 919 (29.3%) | 714 (13.8%) |
| Total | 3,138 (100.0%) | 5,186 (100.0%) |
Real Estate & Mortgages in Ellensburg
Real Estate and Mortgage Overview in Ellensburg
| Characteristic | Without Mortgage | With Mortgage |
| Housing Units | 1,046 | 2,092 |
| Median Property Value | $319,100 | $363,000 |
| Median Household Income | $46,750 | $462 |
| Monthly Housing Costs | $570 | $30 |
| Real Estate Taxes | $2,853 | $21 |
Property Value by Mortgage Status in Ellensburg
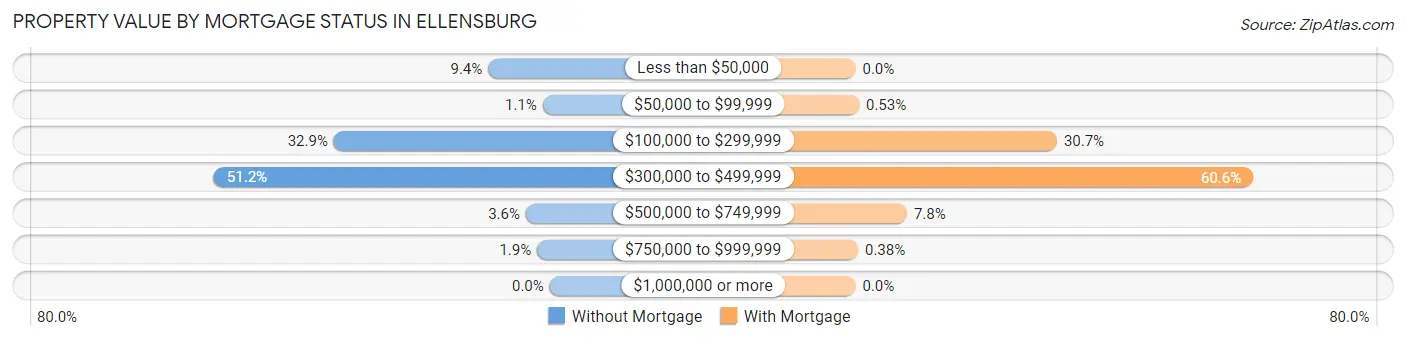
| Property Value | Without Mortgage | With Mortgage |
| Less than $50,000 | 98 (9.4%) | 0 (0.0%) |
| $50,000 to $99,999 | 11 (1.1%) | 11 (0.5%) |
| $100,000 to $299,999 | 344 (32.9%) | 642 (30.7%) |
| $300,000 to $499,999 | 535 (51.1%) | 1,267 (60.6%) |
| $500,000 to $749,999 | 38 (3.6%) | 164 (7.8%) |
| $750,000 to $999,999 | 20 (1.9%) | 8 (0.4%) |
| $1,000,000 or more | 0 (0.0%) | 0 (0.0%) |
| Total | 1,046 (100.0%) | 2,092 (100.0%) |
Household Income by Mortgage Status in Ellensburg
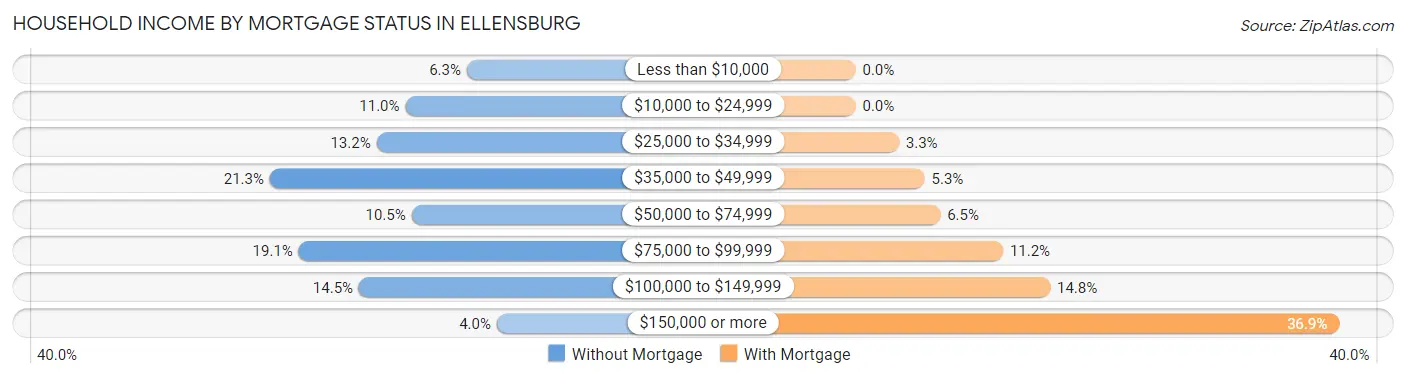
| Household Income | Without Mortgage | With Mortgage |
| Less than $10,000 | 66 (6.3%) | 0 (0.0%) |
| $10,000 to $24,999 | 115 (11.0%) | 0 (0.0%) |
| $25,000 to $34,999 | 138 (13.2%) | 69 (3.3%) |
| $35,000 to $49,999 | 223 (21.3%) | 110 (5.3%) |
| $50,000 to $74,999 | 110 (10.5%) | 135 (6.5%) |
| $75,000 to $99,999 | 200 (19.1%) | 235 (11.2%) |
| $100,000 to $149,999 | 152 (14.5%) | 310 (14.8%) |
| $150,000 or more | 42 (4.0%) | 771 (36.8%) |
| Total | 1,046 (100.0%) | 2,092 (100.0%) |
Property Value to Household Income Ratio in Ellensburg
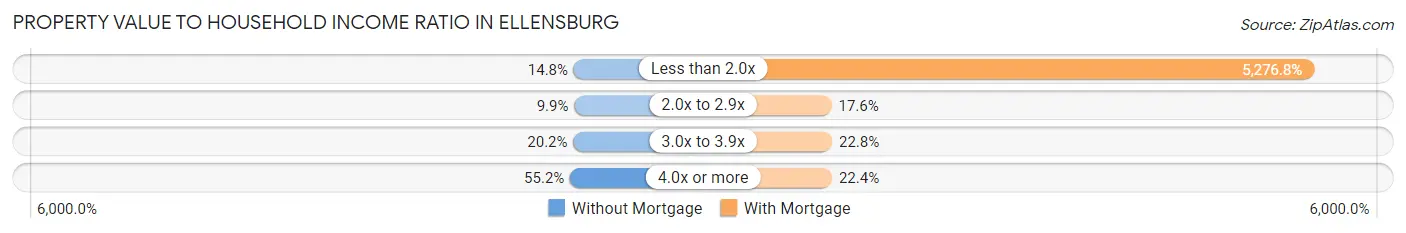
| Value-to-Income Ratio | Without Mortgage | With Mortgage |
| Less than 2.0x | 155 (14.8%) | 110,390 (5,276.8%) |
| 2.0x to 2.9x | 103 (9.9%) | 368 (17.6%) |
| 3.0x to 3.9x | 211 (20.2%) | 477 (22.8%) |
| 4.0x or more | 577 (55.2%) | 469 (22.4%) |
| Total | 1,046 (100.0%) | 2,092 (100.0%) |
Real Estate Taxes by Mortgage Status in Ellensburg
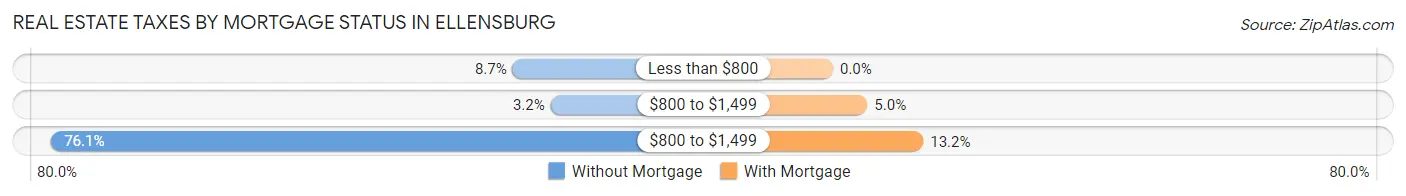
| Property Taxes | Without Mortgage | With Mortgage |
| Less than $800 | 91 (8.7%) | 0 (0.0%) |
| $800 to $1,499 | 33 (3.2%) | 105 (5.0%) |
| $800 to $1,499 | 796 (76.1%) | 276 (13.2%) |
| Total | 1,046 (100.0%) | 2,092 (100.0%) |
Health & Disability in Ellensburg
Health Insurance Coverage by Age in Ellensburg
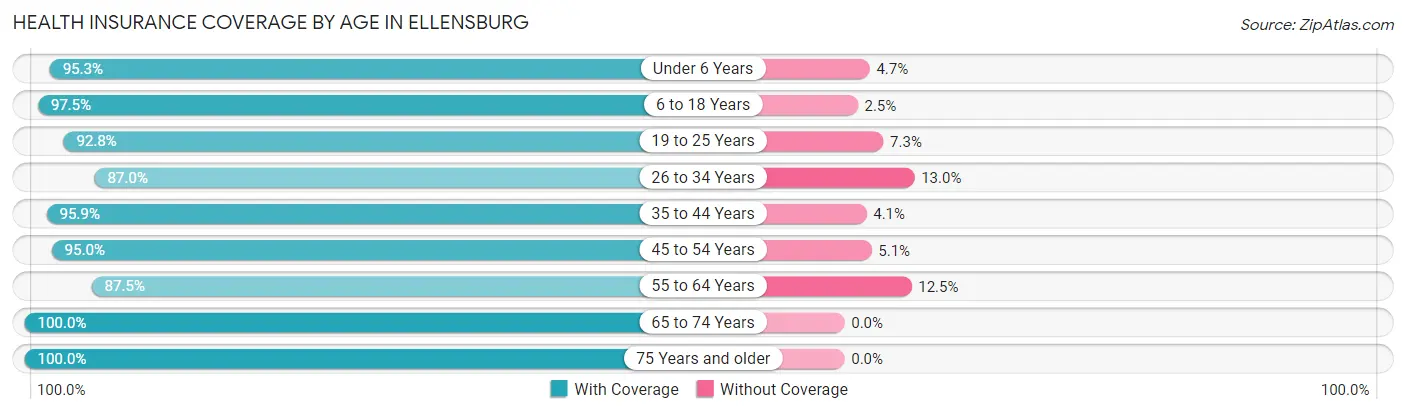
| Age Bracket | With Coverage | Without Coverage |
| Under 6 Years | 914 (95.3%) | 45 (4.7%) |
| 6 to 18 Years | 2,842 (97.5%) | 72 (2.5%) |
| 19 to 25 Years | 5,537 (92.7%) | 433 (7.2%) |
| 26 to 34 Years | 1,947 (87.0%) | 292 (13.0%) |
| 35 to 44 Years | 1,966 (95.9%) | 84 (4.1%) |
| 45 to 54 Years | 1,355 (95.0%) | 72 (5.1%) |
| 55 to 64 Years | 1,170 (87.5%) | 167 (12.5%) |
| 65 to 74 Years | 1,086 (100.0%) | 0 (0.0%) |
| 75 Years and older | 835 (100.0%) | 0 (0.0%) |
| Total | 17,652 (93.8%) | 1,165 (6.2%) |
Health Insurance Coverage by Citizenship Status in Ellensburg

| Citizenship Status | With Coverage | Without Coverage |
| Native Born | 914 (95.3%) | 45 (4.7%) |
| Foreign Born, Citizen | 2,842 (97.5%) | 72 (2.5%) |
| Foreign Born, not a Citizen | 5,537 (92.7%) | 433 (7.2%) |
Health Insurance Coverage by Household Income in Ellensburg
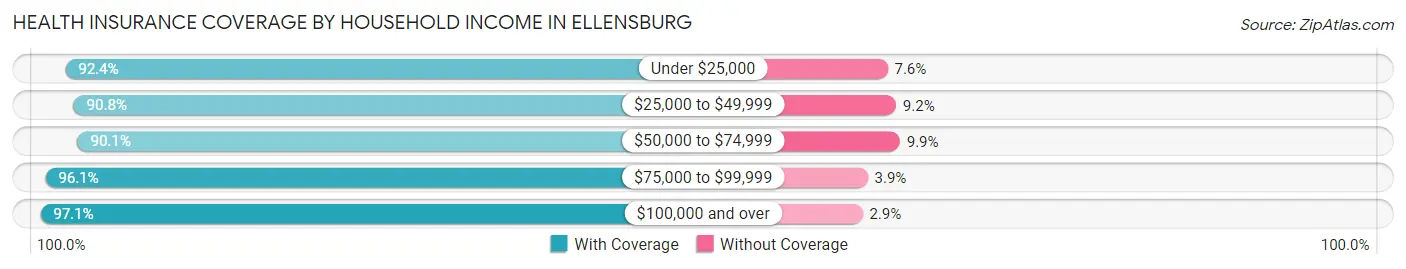
| Household Income | With Coverage | Without Coverage |
| Under $25,000 | 2,928 (92.4%) | 242 (7.6%) |
| $25,000 to $49,999 | 2,763 (90.8%) | 280 (9.2%) |
| $50,000 to $74,999 | 2,348 (90.1%) | 259 (9.9%) |
| $75,000 to $99,999 | 2,241 (96.1%) | 91 (3.9%) |
| $100,000 and over | 5,646 (97.1%) | 171 (2.9%) |
Public vs Private Health Insurance Coverage by Age in Ellensburg
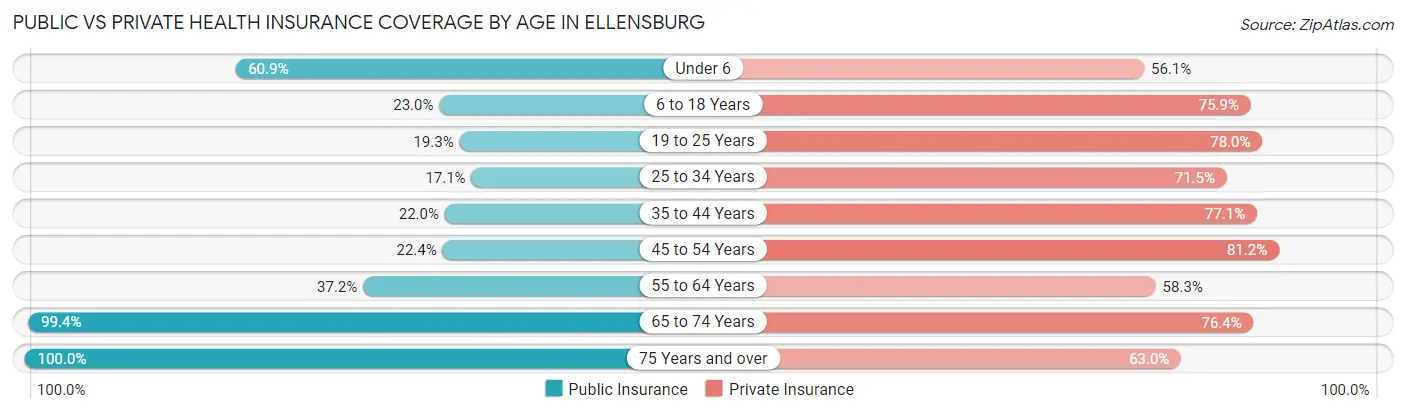
| Age Bracket | Public Insurance | Private Insurance |
| Under 6 | 584 (60.9%) | 538 (56.1%) |
| 6 to 18 Years | 671 (23.0%) | 2,212 (75.9%) |
| 19 to 25 Years | 1,151 (19.3%) | 4,659 (78.0%) |
| 25 to 34 Years | 382 (17.1%) | 1,600 (71.5%) |
| 35 to 44 Years | 451 (22.0%) | 1,580 (77.1%) |
| 45 to 54 Years | 320 (22.4%) | 1,158 (81.1%) |
| 55 to 64 Years | 497 (37.2%) | 779 (58.3%) |
| 65 to 74 Years | 1,079 (99.4%) | 830 (76.4%) |
| 75 Years and over | 835 (100.0%) | 526 (63.0%) |
| Total | 5,970 (31.7%) | 13,882 (73.8%) |
Disability Status by Sex by Age in Ellensburg
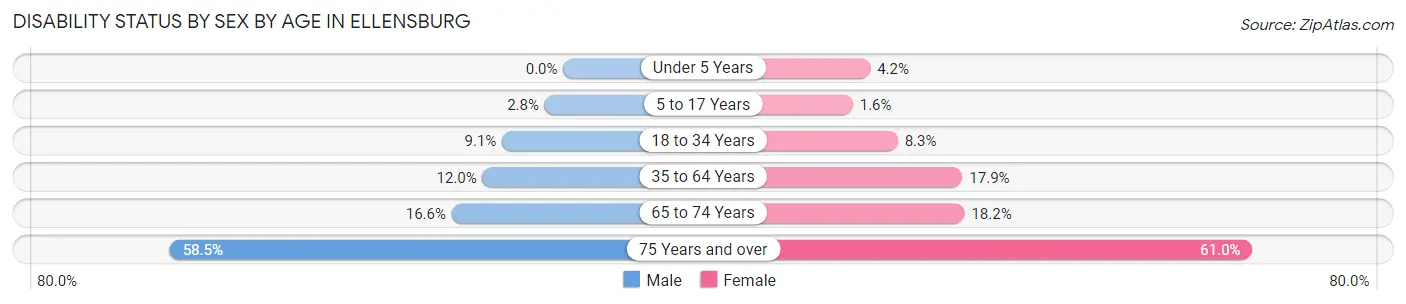
| Age Bracket | Male | Female |
| Under 5 Years | 0 (0.0%) | 14 (4.2%) |
| 5 to 17 Years | 29 (2.8%) | 17 (1.6%) |
| 18 to 34 Years | 416 (9.1%) | 379 (8.3%) |
| 35 to 64 Years | 294 (12.0%) | 423 (17.9%) |
| 65 to 74 Years | 59 (16.6%) | 133 (18.2%) |
| 75 Years and over | 211 (58.5%) | 289 (61.0%) |
Disability Class by Sex by Age in Ellensburg
Disability Class: Hearing Difficulty
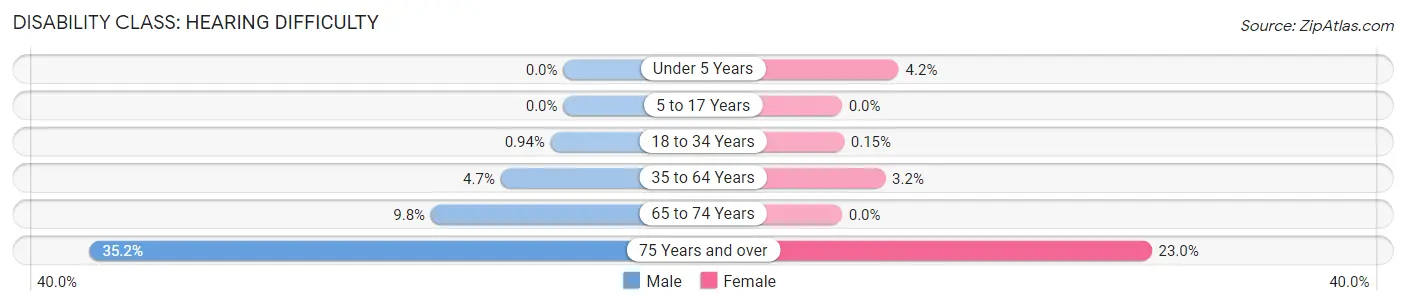
| Age Bracket | Male | Female |
| Under 5 Years | 0 (0.0%) | 14 (4.2%) |
| 5 to 17 Years | 0 (0.0%) | 0 (0.0%) |
| 18 to 34 Years | 43 (0.9%) | 7 (0.2%) |
| 35 to 64 Years | 114 (4.6%) | 76 (3.2%) |
| 65 to 74 Years | 35 (9.8%) | 0 (0.0%) |
| 75 Years and over | 127 (35.2%) | 109 (23.0%) |
Disability Class: Vision Difficulty
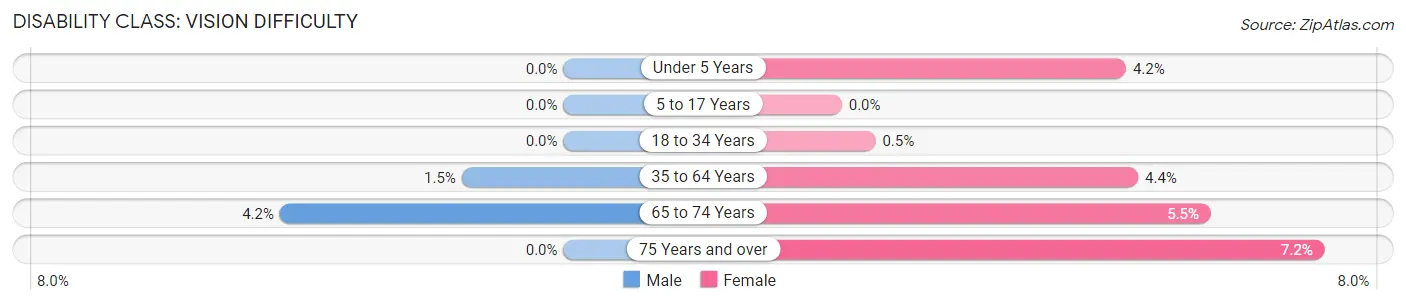
| Age Bracket | Male | Female |
| Under 5 Years | 0 (0.0%) | 14 (4.2%) |
| 5 to 17 Years | 0 (0.0%) | 0 (0.0%) |
| 18 to 34 Years | 0 (0.0%) | 23 (0.5%) |
| 35 to 64 Years | 37 (1.5%) | 104 (4.4%) |
| 65 to 74 Years | 15 (4.2%) | 40 (5.5%) |
| 75 Years and over | 0 (0.0%) | 34 (7.2%) |
Disability Class: Cognitive Difficulty
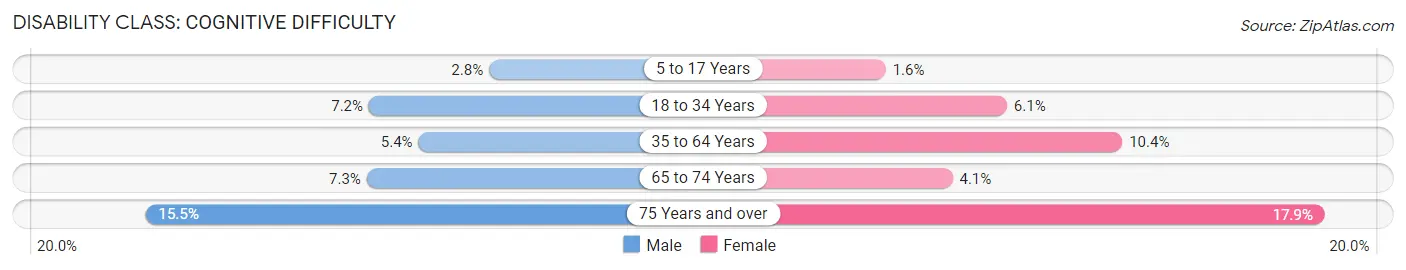
| Age Bracket | Male | Female |
| 5 to 17 Years | 29 (2.8%) | 17 (1.6%) |
| 18 to 34 Years | 331 (7.2%) | 280 (6.1%) |
| 35 to 64 Years | 132 (5.4%) | 246 (10.4%) |
| 65 to 74 Years | 26 (7.3%) | 30 (4.1%) |
| 75 Years and over | 56 (15.5%) | 85 (17.9%) |
Disability Class: Ambulatory Difficulty
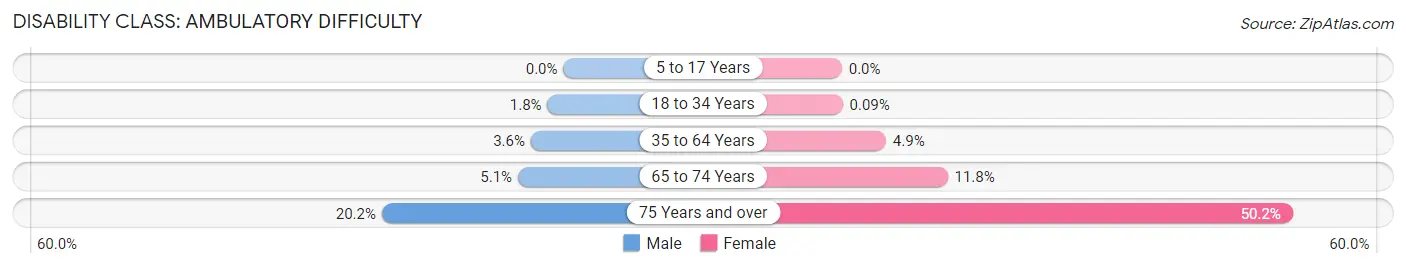
| Age Bracket | Male | Female |
| 5 to 17 Years | 0 (0.0%) | 0 (0.0%) |
| 18 to 34 Years | 81 (1.8%) | 4 (0.1%) |
| 35 to 64 Years | 89 (3.6%) | 116 (4.9%) |
| 65 to 74 Years | 18 (5.1%) | 86 (11.8%) |
| 75 Years and over | 73 (20.2%) | 238 (50.2%) |
Disability Class: Self-Care Difficulty
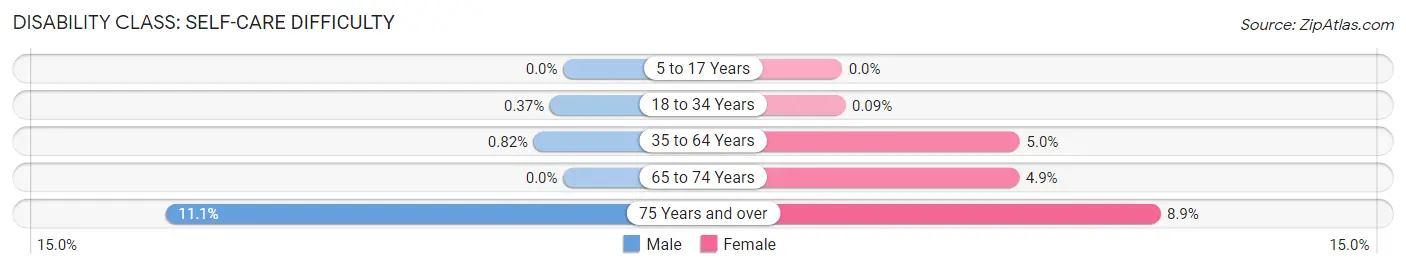
| Age Bracket | Male | Female |
| 5 to 17 Years | 0 (0.0%) | 0 (0.0%) |
| 18 to 34 Years | 17 (0.4%) | 4 (0.1%) |
| 35 to 64 Years | 20 (0.8%) | 117 (5.0%) |
| 65 to 74 Years | 0 (0.0%) | 36 (4.9%) |
| 75 Years and over | 40 (11.1%) | 42 (8.9%) |
Technology Access in Ellensburg
Computing Device Access in Ellensburg
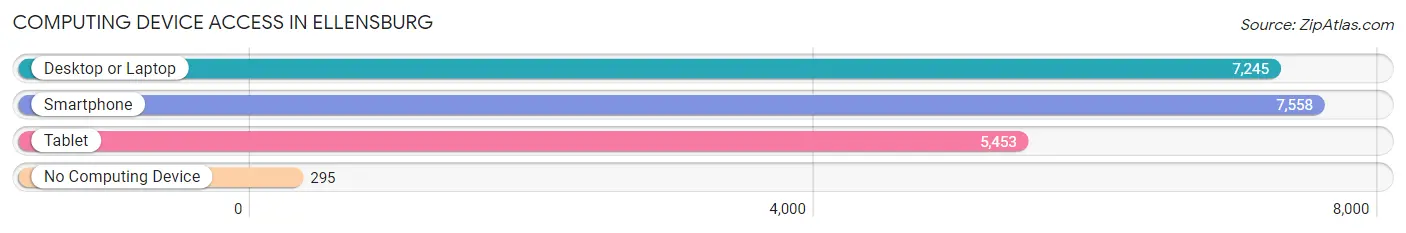
| Device Type | # Households | % Households |
| Desktop or Laptop | 7,245 | 87.0% |
| Smartphone | 7,558 | 90.8% |
| Tablet | 5,453 | 65.5% |
| No Computing Device | 295 | 3.5% |
| Total | 8,324 | 100.0% |
Internet Access in Ellensburg
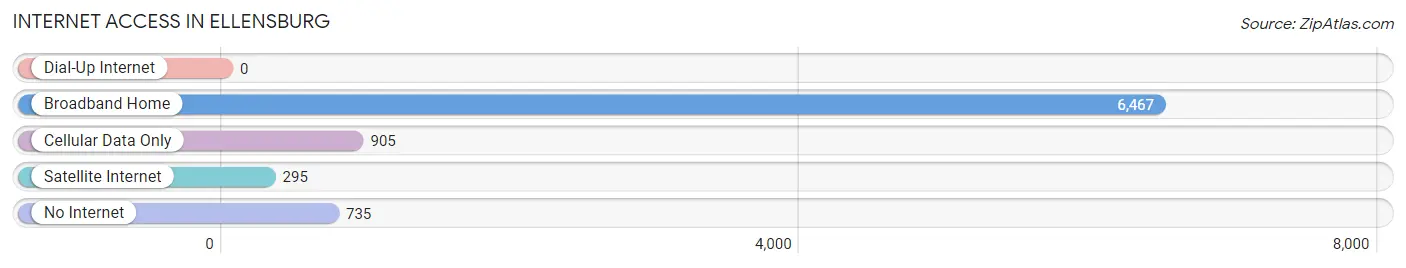
| Internet Type | # Households | % Households |
| Dial-Up Internet | 0 | 0.0% |
| Broadband Home | 6,467 | 77.7% |
| Cellular Data Only | 905 | 10.9% |
| Satellite Internet | 295 | 3.5% |
| No Internet | 735 | 8.8% |
| Total | 8,324 | 100.0% |
Ellensburg Summary
Ellensburg, Washington is a small city located in Kittitas County in the central part of the state. It is situated in the Kittitas Valley, which is surrounded by the Cascade Mountains to the west and the Columbia Plateau to the east. The city is located about 100 miles east of Seattle and about 60 miles south of Spokane. The population of Ellensburg was estimated to be 18,174 in 2019.
History
The area that is now Ellensburg was first inhabited by Native American tribes, including the Yakama, Kittitas, and Wenatchi. The first European settlers arrived in the area in the late 1850s, and the town was officially founded in 1884. The town was named after Mary Ellen Shoudy, the wife of the first postmaster.
In the late 19th century, Ellensburg was a major stop on the Northern Pacific Railroad, and the town grew rapidly. The city was incorporated in 1885, and the first mayor was elected in 1886.
In the early 20th century, Ellensburg was a major center for the mining and timber industries. The city was also home to several colleges, including Central Washington University, which was founded in 1891.
Geography
Ellensburg is located in the Kittitas Valley, which is surrounded by the Cascade Mountains to the west and the Columbia Plateau to the east. The city is situated at an elevation of 1,068 feet above sea level. The climate in Ellensburg is semi-arid, with hot summers and cold winters.
The city is located at the confluence of the Yakima and Columbia Rivers. The Yakima River flows through the city, and the Columbia River is located about 10 miles to the east.
Economy
The economy of Ellensburg is largely based on agriculture, education, and tourism. The city is home to several large agricultural operations, including dairy farms, fruit orchards, and vineyards.
Central Washington University is the largest employer in the city, with over 3,000 employees. The university also contributes to the local economy through tourism, as it attracts thousands of visitors each year.
The city is also home to several large companies, including a Boeing plant, a Microsoft data center, and a Walmart distribution center.
Demographics
As of 2019, the population of Ellensburg was estimated to be 18,174. The racial makeup of the city was 79.2% White, 1.3% African American, 1.2% Native American, 5.2% Asian, 0.2% Pacific Islander, 8.7% from other races, and 4.2% from two or more races. Hispanic or Latino of any race were 16.3% of the population.
The median household income in Ellensburg was $45,945 in 2019, and the median home value was $269,400. The city has a poverty rate of 16.2%.
Conclusion
Ellensburg, Washington is a small city located in Kittitas County in the central part of the state. It is situated in the Kittitas Valley, which is surrounded by the Cascade Mountains to the west and the Columbia Plateau to the east. The city is home to Central Washington University, and the economy is largely based on agriculture, education, and tourism. The population of Ellensburg was estimated to be 18,174 in 2019, and the median household income was $45,945.
Common Questions
What is Per Capita Income in Ellensburg?
Per Capita income in Ellensburg is $30,474.
What is the Median Family Income in Ellensburg?
Median Family Income in Ellensburg is $91,229.
What is the Median Household income in Ellensburg?
Median Household Income in Ellensburg is $53,730.
What is Income or Wage Gap in Ellensburg?
Income or Wage Gap in Ellensburg is 26.7%.
Women in Ellensburg earn 73.3 cents for every dollar earned by a man.
What is Family Income Deficit in Ellensburg?
Family Income Deficit in Ellensburg is $8,992.
Families that are below poverty line in Ellensburg earn $8,992 less on average than the poverty threshold level.
What is Inequality or Gini Index in Ellensburg?
Inequality or Gini Index in Ellensburg is 0.45.
What is the Total Population of Ellensburg?
Total Population of Ellensburg is 19,003.
What is the Total Male Population of Ellensburg?
Total Male Population of Ellensburg is 9,408.
What is the Total Female Population of Ellensburg?
Total Female Population of Ellensburg is 9,595.
What is the Ratio of Males per 100 Females in Ellensburg?
There are 98.05 Males per 100 Females in Ellensburg.
What is the Ratio of Females per 100 Males in Ellensburg?
There are 101.99 Females per 100 Males in Ellensburg.
What is the Median Population Age in Ellensburg?
Median Population Age in Ellensburg is 24.9 Years.
What is the Average Family Size in Ellensburg
Average Family Size in Ellensburg is 2.7 People.
What is the Average Household Size in Ellensburg
Average Household Size in Ellensburg is 2.0 People.
How Large is the Labor Force in Ellensburg?
There are 11,063 People in the Labor Forcein in Ellensburg.
What is the Percentage of People in the Labor Force in Ellensburg?
67.6% of People are in the Labor Force in Ellensburg.
What is the Unemployment Rate in Ellensburg?
Unemployment Rate in Ellensburg is 9.0%.