Cities with the Highest Percentage of Immigrants from Brazil in Washington
RELATED REPORTS & OPTIONS
Brazil
Washington
Compare Cities
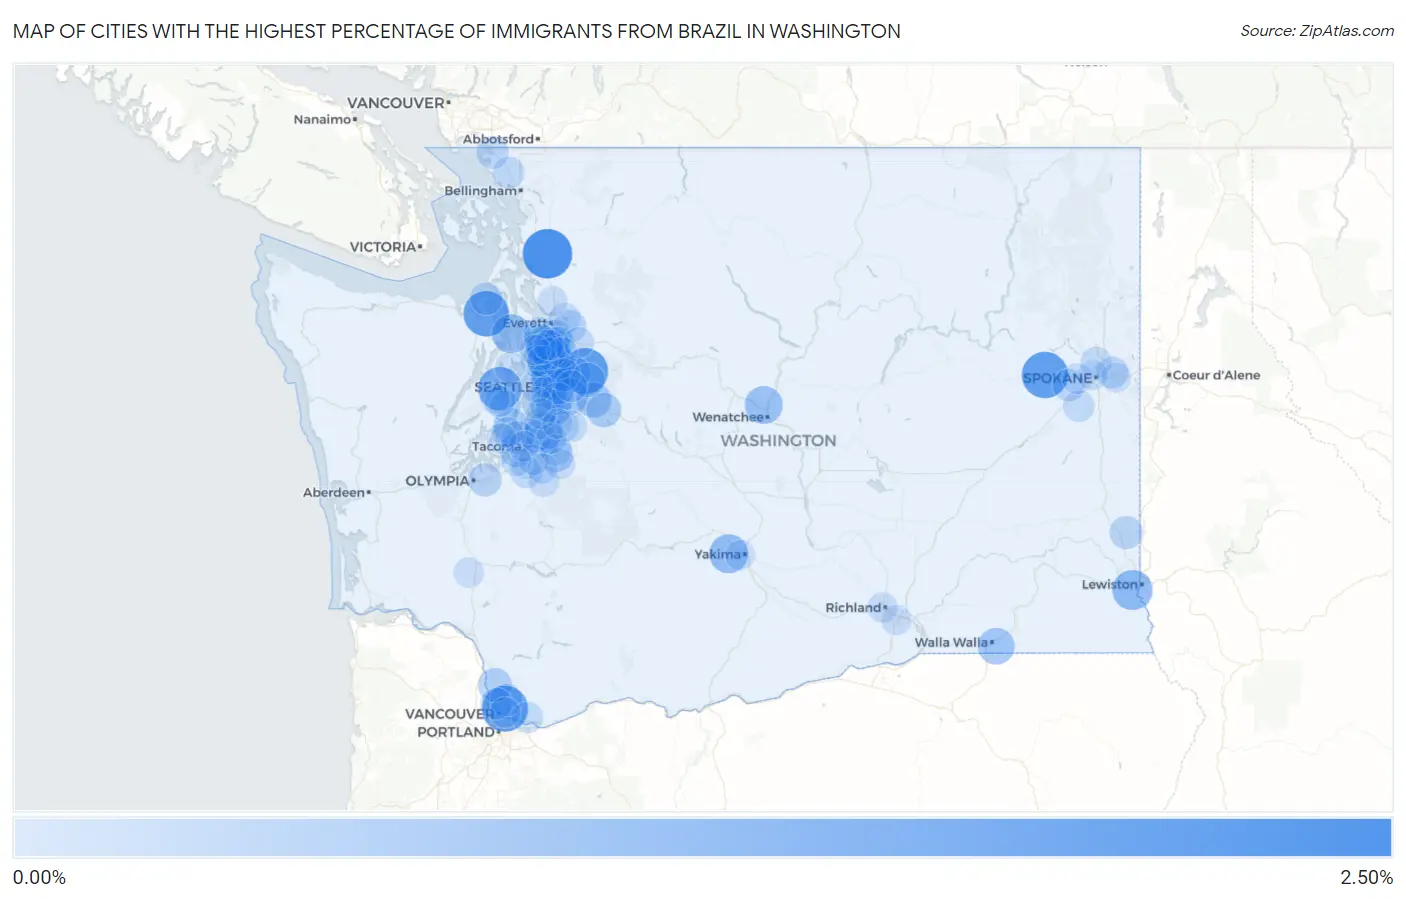
Map of Cities with the Highest Percentage of Immigrants from Brazil in Washington
0.00%
2.50%
Cities with the Highest Percentage of Immigrants from Brazil in Washington
| City | Brazil | vs State | vs National | |
| 1. | Big Lake | 2.16% | 0.12%(+2.04)#-1 | 0.17%(+1.99)#0 |
| 2. | Reardan | 1.80% | 0.12%(+1.68)#0 | 0.17%(+1.63)#1 |
| 3. | Lake Marcel Stillwater | 1.79% | 0.12%(+1.67)#1 | 0.17%(+1.62)#2 |
| 4. | Minnehaha | 1.77% | 0.12%(+1.65)#95 | 0.17%(+1.60)#3,241 |
| 5. | Port Hadlock Irondale | 1.71% | 0.12%(+1.59)#96 | 0.17%(+1.55)#3,242 |
| 6. | Rocky Point | 1.49% | 0.12%(+1.37)#97 | 0.17%(+1.32)#3,243 |
| 7. | Clarkston Heights Vineland | 1.09% | 0.12%(+0.969)#98 | 0.17%(+0.924)#3,244 |
| 8. | Kirkland | 1.09% | 0.12%(+0.965)#115 | 0.17%(+0.920)#3,759 |
| 9. | Kenmore | 1.04% | 0.12%(+0.920)#116 | 0.17%(+0.875)#3,760 |
| 10. | Summitview | 0.97% | 0.12%(+0.850)#117 | 0.17%(+0.805)#3,761 |
| 11. | Hansville | 0.96% | 0.12%(+0.833)#118 | 0.17%(+0.788)#3,762 |
| 12. | Yarrow Point | 0.94% | 0.12%(+0.816)#119 | 0.17%(+0.771)#3,763 |
| 13. | Sunnyslope | 0.84% | 0.12%(+0.723)#120 | 0.17%(+0.678)#3,764 |
| 14. | Bothell | 0.83% | 0.12%(+0.711)#121 | 0.17%(+0.666)#3,765 |
| 15. | Lakeland North | 0.75% | 0.12%(+0.627)#122 | 0.17%(+0.582)#3,766 |
| 16. | Larch Way | 0.73% | 0.12%(+0.606)#123 | 0.17%(+0.561)#3,767 |
| 17. | Walla Walla East | 0.71% | 0.12%(+0.590)#124 | 0.17%(+0.545)#3,768 |
| 18. | North Lynnwood | 0.68% | 0.12%(+0.555)#125 | 0.17%(+0.510)#3,769 |
| 19. | Union Hill Novelty Hill | 0.66% | 0.12%(+0.534)#126 | 0.17%(+0.489)#3,770 |
| 20. | Issaquah | 0.63% | 0.12%(+0.513)#127 | 0.17%(+0.468)#3,771 |
| 21. | Maplewood | 0.62% | 0.12%(+0.494)#128 | 0.17%(+0.449)#3,772 |
| 22. | Renton | 0.58% | 0.12%(+0.459)#129 | 0.17%(+0.414)#3,773 |
| 23. | Mercer Island | 0.58% | 0.12%(+0.456)#130 | 0.17%(+0.410)#3,774 |
| 24. | Snoqualmie | 0.57% | 0.12%(+0.445)#131 | 0.17%(+0.400)#3,775 |
| 25. | Riverbend | 0.49% | 0.12%(+0.368)#132 | 0.17%(+0.323)#3,776 |
| 26. | Carnation | 0.48% | 0.12%(+0.355)#133 | 0.17%(+0.310)#3,777 |
| 27. | Mill Creek East | 0.43% | 0.12%(+0.313)#134 | 0.17%(+0.268)#3,778 |
| 28. | Ridgefield | 0.43% | 0.12%(+0.305)#135 | 0.17%(+0.260)#3,779 |
| 29. | Bonney Lake | 0.42% | 0.12%(+0.303)#136 | 0.17%(+0.258)#3,780 |
| 30. | Bryn Mawr Skyway | 0.40% | 0.12%(+0.278)#137 | 0.17%(+0.232)#3,781 |
| 31. | Fircrest | 0.39% | 0.12%(+0.273)#138 | 0.17%(+0.228)#3,782 |
| 32. | Bellevue | 0.37% | 0.12%(+0.244)#139 | 0.17%(+0.199)#3,783 |
| 33. | Woodinville | 0.35% | 0.12%(+0.224)#140 | 0.17%(+0.179)#3,784 |
| 34. | Eastmont | 0.34% | 0.12%(+0.219)#141 | 0.17%(+0.174)#3,785 |
| 35. | Mukilteo | 0.33% | 0.12%(+0.211)#142 | 0.17%(+0.165)#3,786 |
| 36. | Mill Creek | 0.33% | 0.12%(+0.210)#143 | 0.17%(+0.165)#3,787 |
| 37. | Pullman | 0.33% | 0.12%(+0.204)#144 | 0.17%(+0.158)#3,788 |
| 38. | Lacey | 0.32% | 0.12%(+0.200)#145 | 0.17%(+0.155)#3,789 |
| 39. | Lakeland South | 0.32% | 0.12%(+0.196)#146 | 0.17%(+0.150)#3,790 |
| 40. | Ruston | 0.31% | 0.12%(+0.193)#147 | 0.17%(+0.148)#3,791 |
| 41. | Redmond | 0.31% | 0.12%(+0.183)#148 | 0.17%(+0.138)#3,792 |
| 42. | Newcastle | 0.28% | 0.12%(+0.157)#149 | 0.17%(+0.112)#3,793 |
| 43. | Everett | 0.28% | 0.12%(+0.153)#150 | 0.17%(+0.108)#3,794 |
| 44. | Bothell East | 0.27% | 0.12%(+0.151)#151 | 0.17%(+0.106)#3,795 |
| 45. | Port Townsend | 0.27% | 0.12%(+0.144)#152 | 0.17%(+0.099)#3,796 |
| 46. | Picnic Point | 0.26% | 0.12%(+0.140)#153 | 0.17%(+0.094)#3,797 |
| 47. | Barberton | 0.25% | 0.12%(+0.130)#154 | 0.17%(+0.085)#3,798 |
| 48. | Fairchild Afb | 0.25% | 0.12%(+0.130)#155 | 0.17%(+0.084)#3,799 |
| 49. | Blaine | 0.24% | 0.12%(+0.117)#156 | 0.17%(+0.072)#3,800 |
| 50. | Seattle | 0.22% | 0.12%(+0.099)#157 | 0.17%(+0.054)#3,801 |
| 51. | Bothell West | 0.22% | 0.12%(+0.097)#158 | 0.17%(+0.052)#3,802 |
| 52. | Millwood | 0.21% | 0.12%(+0.086)#159 | 0.17%(+0.040)#3,803 |
| 53. | Federal Way | 0.20% | 0.12%(+0.075)#160 | 0.17%(+0.030)#3,804 |
| 54. | Sammamish | 0.18% | 0.12%(+0.063)#161 | 0.17%(+0.018)#3,805 |
| 55. | Lake Shore | 0.18% | 0.12%(+0.060)#162 | 0.17%(+0.015)#3,806 |
| 56. | Ferndale | 0.18% | 0.12%(+0.057)#163 | 0.17%(+0.012)#3,807 |
| 57. | Country Homes | 0.16% | 0.12%(+0.038)#164 | 0.17%(-0.007)#3,808 |
| 58. | Lake Stevens | 0.16% | 0.12%(+0.035)#165 | 0.17%(-0.010)#3,809 |
| 59. | Camas | 0.16% | 0.12%(+0.034)#166 | 0.17%(-0.011)#3,810 |
| 60. | Maple Valley | 0.15% | 0.12%(+0.029)#167 | 0.17%(-0.016)#3,811 |
| 61. | Mountlake Terrace | 0.15% | 0.12%(+0.023)#168 | 0.17%(-0.022)#3,812 |
| 62. | Silver Firs | 0.14% | 0.12%(+0.022)#169 | 0.17%(-0.023)#3,813 |
| 63. | Bethel | 0.14% | 0.12%(+0.020)#170 | 0.17%(-0.025)#3,814 |
| 64. | Cheney | 0.14% | 0.12%(+0.018)#171 | 0.17%(-0.027)#3,815 |
| 65. | Shoreline | 0.13% | 0.12%(+0.010)#172 | 0.17%(-0.036)#3,816 |
| 66. | Spanaway | 0.13% | 0.12%(+0.008)#173 | 0.17%(-0.037)#3,817 |
| 67. | Des Moines | 0.13% | 0.12%(+0.004)#174 | 0.17%(-0.041)#3,818 |
| 68. | White Center | 0.12% | 0.12%(+0.001)#175 | 0.17%(-0.044)#3,819 |
| 69. | Covington | 0.12% | 0.12%(-0.002)#176 | 0.17%(-0.047)#3,820 |
| 70. | Lake Tapps | 0.11% | 0.12%(-0.007)#177 | 0.17%(-0.052)#3,821 |
| 71. | Lake Forest Park | 0.10% | 0.12%(-0.018)#178 | 0.17%(-0.063)#3,822 |
| 72. | Monroe | 0.10% | 0.12%(-0.020)#179 | 0.17%(-0.065)#3,823 |
| 73. | Graham | 0.10% | 0.12%(-0.021)#180 | 0.17%(-0.066)#3,824 |
| 74. | Port Orchard | 0.095% | 0.12%(-0.027)#181 | 0.17%(-0.072)#3,825 |
| 75. | Lynnwood | 0.085% | 0.12%(-0.036)#182 | 0.17%(-0.082)#3,826 |
| 76. | Gig Harbor | 0.084% | 0.12%(-0.038)#183 | 0.17%(-0.083)#3,827 |
| 77. | Prairie Ridge | 0.080% | 0.12%(-0.041)#184 | 0.17%(-0.086)#3,828 |
| 78. | Airway Heights | 0.076% | 0.12%(-0.046)#185 | 0.17%(-0.091)#3,829 |
| 79. | Parkland | 0.069% | 0.12%(-0.053)#186 | 0.17%(-0.098)#3,830 |
| 80. | Seatac | 0.065% | 0.12%(-0.057)#187 | 0.17%(-0.102)#3,831 |
| 81. | Auburn | 0.056% | 0.12%(-0.066)#188 | 0.17%(-0.111)#3,832 |
| 82. | Maltby | 0.053% | 0.12%(-0.069)#189 | 0.17%(-0.114)#3,833 |
| 83. | Winlock | 0.051% | 0.12%(-0.071)#190 | 0.17%(-0.116)#3,834 |
| 84. | Vancouver | 0.050% | 0.12%(-0.071)#191 | 0.17%(-0.116)#3,835 |
| 85. | Edmonds | 0.047% | 0.12%(-0.075)#192 | 0.17%(-0.120)#3,836 |
| 86. | Suquamish | 0.046% | 0.12%(-0.076)#193 | 0.17%(-0.121)#3,837 |
| 87. | Summit | 0.045% | 0.12%(-0.076)#194 | 0.17%(-0.121)#3,838 |
| 88. | Richland | 0.044% | 0.12%(-0.077)#195 | 0.17%(-0.122)#3,839 |
| 89. | Tacoma | 0.043% | 0.12%(-0.078)#196 | 0.17%(-0.123)#3,840 |
| 90. | Artondale | 0.043% | 0.12%(-0.078)#197 | 0.17%(-0.124)#3,841 |
| 91. | Martha Lake | 0.043% | 0.12%(-0.079)#198 | 0.17%(-0.124)#3,842 |
| 92. | South Hill | 0.037% | 0.12%(-0.085)#199 | 0.17%(-0.130)#3,843 |
| 93. | Kennewick | 0.035% | 0.12%(-0.087)#200 | 0.17%(-0.132)#3,844 |
| 94. | Spokane | 0.028% | 0.12%(-0.094)#201 | 0.17%(-0.139)#3,845 |
| 95. | Marysville | 0.024% | 0.12%(-0.098)#202 | 0.17%(-0.143)#3,846 |
| 96. | Yakima | 0.021% | 0.12%(-0.101)#203 | 0.17%(-0.146)#3,847 |
| 97. | Kent | 0.020% | 0.12%(-0.102)#204 | 0.17%(-0.147)#3,848 |
| 98. | Lakewood | 0.019% | 0.12%(-0.103)#205 | 0.17%(-0.148)#3,849 |
| 99. | Spokane Valley | 0.0077% | 0.12%(-0.114)#206 | 0.17%(-0.159)#3,850 |
| 100. | Bremerton | 0.0045% | 0.12%(-0.117)#207 | 0.17%(-0.162)#3,851 |
Common Questions
What are the Top 10 Cities with the Highest Percentage of Immigrants from Brazil in Washington?
Top 10 Cities with the Highest Percentage of Immigrants from Brazil in Washington are:
#1
2.16%
#2
1.80%
#3
1.79%
#4
1.77%
#5
1.71%
#6
1.49%
#7
1.09%
#8
1.09%
#9
1.04%
#10
0.97%
What city has the Highest Percentage of Immigrants from Brazil in Washington?
Big Lake has the Highest Percentage of Immigrants from Brazil in Washington with 2.16%.
What is the Percentage of Immigrants from Brazil in the State of Washington?
Percentage of Immigrants from Brazil in Washington is 0.12%.
What is the Percentage of Immigrants from Brazil in the United States?
Percentage of Immigrants from Brazil in the United States is 0.17%.