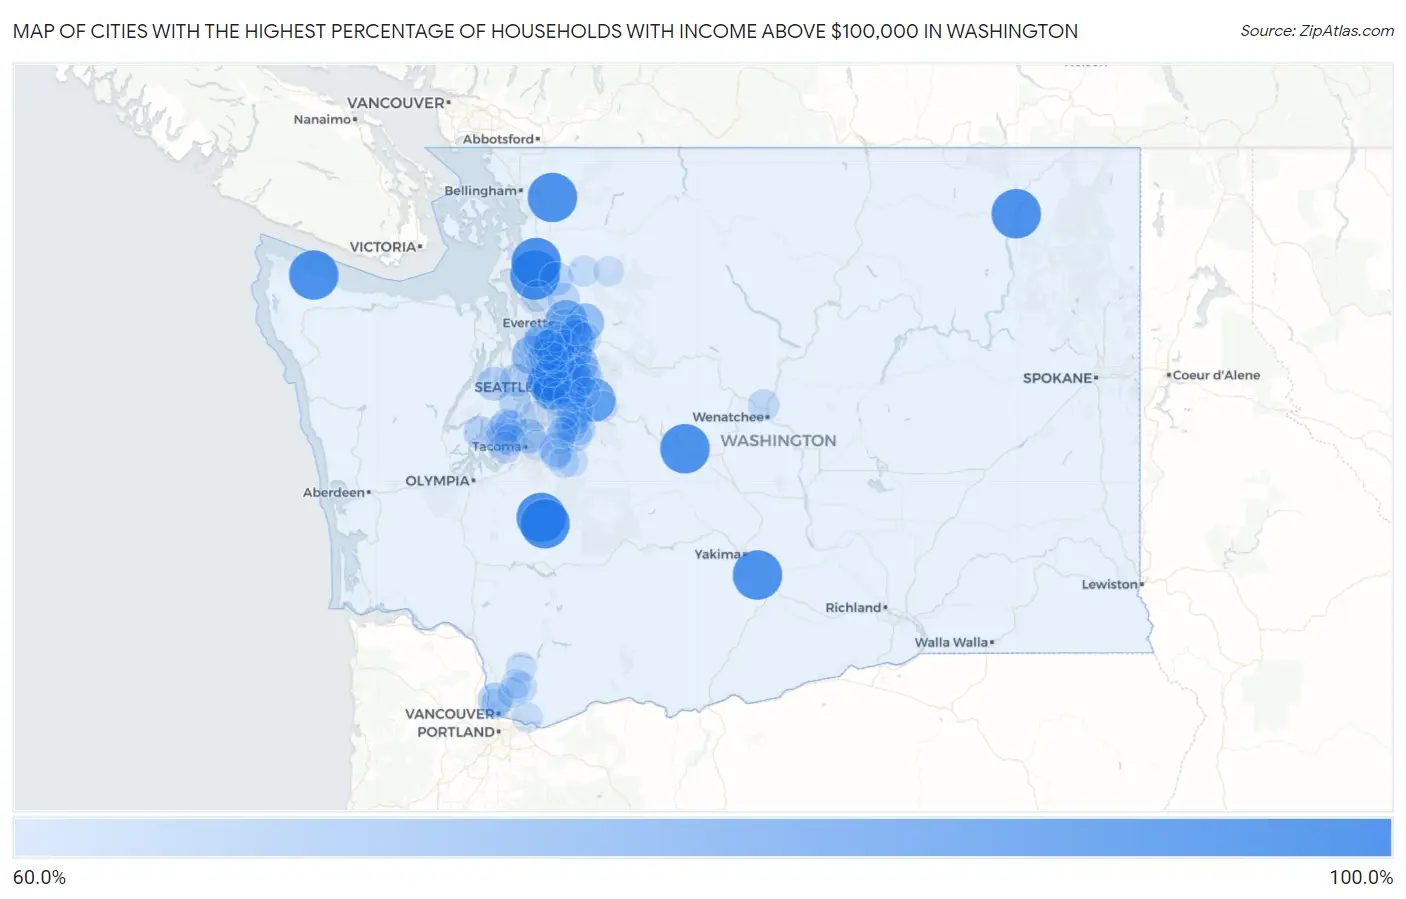
Cities with the Highest Percentage of Households with Income Above $100,000 in Washington
RELATED REPORTS & OPTIONS
Household Income | $100k+
Washington
Compare Cities
Map of Cities with the Highest Percentage of Households with Income Above $100,000 in Washington
0.0%
100.0%
Cities with the Highest Percentage of Households with Income Above $100,000 in Washington
| City | Households with Income > $100k | vs State | vs National | |
| 1. | Ronald | 100.0% | 45.2%(+54.8)#1 | 37.3%(+62.7)#14 |
| 2. | La Grande | 100.0% | 45.2%(+54.8)#2 | 37.3%(+62.7)#17 |
| 3. | Donald | 100.0% | 45.2%(+54.8)#3 | 37.3%(+62.7)#45 |
| 4. | Alder | 100.0% | 45.2%(+54.8)#4 | 37.3%(+62.7)#47 |
| 5. | Acme | 100.0% | 45.2%(+54.8)#5 | 37.3%(+62.7)#51 |
| 6. | Sekiu | 100.0% | 45.2%(+54.8)#6 | 37.3%(+62.7)#99 |
| 7. | Northwest Stanwood | 100.0% | 45.2%(+54.8)#7 | 37.3%(+62.7)#107 |
| 8. | Conway | 100.0% | 45.2%(+54.8)#8 | 37.3%(+62.7)#112 |
| 9. | Barney S Junction | 100.0% | 45.2%(+54.8)#9 | 37.3%(+62.7)#145 |
| 10. | Cougar | 91.7% | 45.2%(+46.5)#10 | 37.3%(+54.4)#228 |
| 11. | Snoqualmie | 88.1% | 45.2%(+42.9)#11 | 37.3%(+50.8)#285 |
| 12. | Cavalero | 85.6% | 45.2%(+40.4)#12 | 37.3%(+48.3)#329 |
| 13. | Yarrow Point | 84.0% | 45.2%(+38.8)#13 | 37.3%(+46.7)#371 |
| 14. | Hunts Point | 83.0% | 45.2%(+37.8)#14 | 37.3%(+45.7)#419 |
| 15. | Sammamish | 82.4% | 45.2%(+37.2)#15 | 37.3%(+45.1)#445 |
| 16. | Medina | 81.9% | 45.2%(+36.7)#16 | 37.3%(+44.6)#461 |
| 17. | Cottage Lake | 79.3% | 45.2%(+34.1)#17 | 37.3%(+42.0)#591 |
| 18. | Mill Creek East | 79.1% | 45.2%(+33.9)#18 | 37.3%(+41.8)#602 |
| 19. | Beaux Arts Village | 79.1% | 45.2%(+33.9)#19 | 37.3%(+41.8)#609 |
| 20. | Clyde Hill | 78.8% | 45.2%(+33.6)#20 | 37.3%(+41.5)#629 |
| 21. | Woodway | 78.1% | 45.2%(+32.9)#21 | 37.3%(+40.8)#676 |
| 22. | Monroe North | 77.8% | 45.2%(+32.6)#22 | 37.3%(+40.5)#701 |
| 23. | Lake Roesiger | 77.7% | 45.2%(+32.5)#23 | 37.3%(+40.4)#710 |
| 24. | High Bridge | 77.5% | 45.2%(+32.3)#24 | 37.3%(+40.2)#723 |
| 25. | Duvall | 77.3% | 45.2%(+32.1)#25 | 37.3%(+40.0)#741 |
| 26. | Maltby | 75.9% | 45.2%(+30.7)#26 | 37.3%(+38.6)#814 |
| 27. | Tehaleh | 75.1% | 45.2%(+29.9)#27 | 37.3%(+37.8)#883 |
| 28. | Bothell East | 73.5% | 45.2%(+28.3)#28 | 37.3%(+36.2)#1,022 |
| 29. | Mirrormont | 73.1% | 45.2%(+27.9)#29 | 37.3%(+35.8)#1,060 |
| 30. | Union Hill Novelty Hill | 72.7% | 45.2%(+27.5)#30 | 37.3%(+35.4)#1,090 |
| 31. | Silver Firs | 72.3% | 45.2%(+27.1)#31 | 37.3%(+35.0)#1,123 |
| 32. | Beverly | 71.8% | 45.2%(+26.6)#32 | 37.3%(+34.5)#1,186 |
| 33. | Riverpoint | 71.1% | 45.2%(+25.9)#33 | 37.3%(+33.8)#1,242 |
| 34. | Felida | 70.4% | 45.2%(+25.2)#34 | 37.3%(+33.1)#1,297 |
| 35. | Dash Point | 70.2% | 45.2%(+25.0)#35 | 37.3%(+32.9)#1,316 |
| 36. | Chain Lake | 69.8% | 45.2%(+24.6)#36 | 37.3%(+32.5)#1,348 |
| 37. | Bunk Foss | 69.8% | 45.2%(+24.6)#37 | 37.3%(+32.5)#1,349 |
| 38. | Lake Tapps | 69.6% | 45.2%(+24.4)#38 | 37.3%(+32.3)#1,369 |
| 39. | Redmond | 69.3% | 45.2%(+24.1)#39 | 37.3%(+32.0)#1,399 |
| 40. | Mercer Island | 69.3% | 45.2%(+24.1)#40 | 37.3%(+32.0)#1,402 |
| 41. | Chico | 69.0% | 45.2%(+23.8)#41 | 37.3%(+31.7)#1,448 |
| 42. | Bryant | 68.7% | 45.2%(+23.5)#42 | 37.3%(+31.4)#1,478 |
| 43. | Lake Forest Park | 68.2% | 45.2%(+23.0)#43 | 37.3%(+30.9)#1,546 |
| 44. | Black Diamond | 68.2% | 45.2%(+23.0)#44 | 37.3%(+30.9)#1,549 |
| 45. | Meadowdale | 68.2% | 45.2%(+23.0)#45 | 37.3%(+30.9)#1,552 |
| 46. | Bellevue | 67.9% | 45.2%(+22.7)#46 | 37.3%(+30.6)#1,582 |
| 47. | Bothell West | 67.9% | 45.2%(+22.7)#47 | 37.3%(+30.6)#1,584 |
| 48. | Ravensdale | 67.8% | 45.2%(+22.6)#48 | 37.3%(+30.5)#1,609 |
| 49. | Bainbridge Island | 67.7% | 45.2%(+22.5)#49 | 37.3%(+30.4)#1,612 |
| 50. | Newcastle | 67.5% | 45.2%(+22.3)#50 | 37.3%(+30.2)#1,626 |
| 51. | Grapeview | 67.5% | 45.2%(+22.3)#51 | 37.3%(+30.2)#1,632 |
| 52. | Rosedale | 67.4% | 45.2%(+22.2)#52 | 37.3%(+30.1)#1,637 |
| 53. | Artondale | 66.8% | 45.2%(+21.6)#53 | 37.3%(+29.5)#1,686 |
| 54. | Brier | 66.8% | 45.2%(+21.6)#54 | 37.3%(+29.5)#1,690 |
| 55. | Larch Way | 66.7% | 45.2%(+21.5)#55 | 37.3%(+29.4)#1,707 |
| 56. | Maple Valley | 66.5% | 45.2%(+21.3)#56 | 37.3%(+29.2)#1,744 |
| 57. | Canterwood | 66.5% | 45.2%(+21.3)#57 | 37.3%(+29.2)#1,752 |
| 58. | Maplewood | 66.4% | 45.2%(+21.2)#58 | 37.3%(+29.1)#1,767 |
| 59. | Sisco Heights | 66.2% | 45.2%(+21.0)#59 | 37.3%(+28.9)#1,795 |
| 60. | Ames Lake | 66.2% | 45.2%(+21.0)#60 | 37.3%(+28.9)#1,798 |
| 61. | Southworth | 66.0% | 45.2%(+20.8)#61 | 37.3%(+28.7)#1,817 |
| 62. | Lake Marcel Stillwater | 65.5% | 45.2%(+20.3)#62 | 37.3%(+28.2)#1,879 |
| 63. | Hobart | 65.4% | 45.2%(+20.2)#63 | 37.3%(+28.1)#1,888 |
| 64. | Issaquah | 65.2% | 45.2%(+20.0)#64 | 37.3%(+27.9)#1,903 |
| 65. | Woodinville | 65.1% | 45.2%(+19.9)#65 | 37.3%(+27.8)#1,919 |
| 66. | Sunnyslope | 65.1% | 45.2%(+19.9)#66 | 37.3%(+27.8)#1,922 |
| 67. | Carnation | 65.1% | 45.2%(+19.9)#67 | 37.3%(+27.8)#1,923 |
| 68. | Picnic Point | 65.0% | 45.2%(+19.8)#68 | 37.3%(+27.7)#1,931 |
| 69. | Fox Island | 65.0% | 45.2%(+19.8)#69 | 37.3%(+27.7)#1,935 |
| 70. | Wollochet | 64.9% | 45.2%(+19.7)#70 | 37.3%(+27.6)#1,948 |
| 71. | Clearview | 64.9% | 45.2%(+19.7)#71 | 37.3%(+27.6)#1,951 |
| 72. | Kayak Point | 64.8% | 45.2%(+19.6)#72 | 37.3%(+27.5)#1,965 |
| 73. | Covington | 64.6% | 45.2%(+19.4)#73 | 37.3%(+27.3)#1,978 |
| 74. | Maple Heights Lake Desire | 64.4% | 45.2%(+19.2)#74 | 37.3%(+27.1)#2,018 |
| 75. | Kirkland | 64.3% | 45.2%(+19.1)#75 | 37.3%(+27.0)#2,022 |
| 76. | North Bend | 64.1% | 45.2%(+18.9)#76 | 37.3%(+26.8)#2,051 |
| 77. | Venersborg | 64.1% | 45.2%(+18.9)#77 | 37.3%(+26.8)#2,055 |
| 78. | Oso | 64.1% | 45.2%(+18.9)#78 | 37.3%(+26.8)#2,060 |
| 79. | Eastmont | 64.0% | 45.2%(+18.8)#79 | 37.3%(+26.7)#2,065 |
| 80. | Cathcart | 63.8% | 45.2%(+18.6)#80 | 37.3%(+26.5)#2,095 |
| 81. | Amboy | 63.7% | 45.2%(+18.5)#81 | 37.3%(+26.4)#2,108 |
| 82. | Martha Lake | 63.6% | 45.2%(+18.4)#82 | 37.3%(+26.3)#2,113 |
| 83. | Buckley | 63.6% | 45.2%(+18.4)#83 | 37.3%(+26.3)#2,119 |
| 84. | Lake Holm | 63.5% | 45.2%(+18.3)#84 | 37.3%(+26.2)#2,137 |
| 85. | Prairie Heights | 63.4% | 45.2%(+18.2)#85 | 37.3%(+26.1)#2,145 |
| 86. | Lake Shore | 63.3% | 45.2%(+18.1)#86 | 37.3%(+26.0)#2,155 |
| 87. | Meadow Glade | 63.2% | 45.2%(+18.0)#87 | 37.3%(+25.9)#2,177 |
| 88. | Camas | 63.0% | 45.2%(+17.8)#88 | 37.3%(+25.7)#2,208 |
| 89. | Fife Heights | 63.0% | 45.2%(+17.8)#89 | 37.3%(+25.7)#2,220 |
| 90. | Bonney Lake | 62.9% | 45.2%(+17.7)#90 | 37.3%(+25.6)#2,236 |
| 91. | Lake Morton Berrydale | 62.8% | 45.2%(+17.6)#91 | 37.3%(+25.5)#2,249 |
| 92. | Normandy Park | 62.7% | 45.2%(+17.5)#92 | 37.3%(+25.4)#2,264 |
| 93. | Three Lakes | 62.5% | 45.2%(+17.3)#93 | 37.3%(+25.2)#2,287 |
| 94. | Lewisville | 62.5% | 45.2%(+17.3)#94 | 37.3%(+25.2)#2,288 |
| 95. | Pataha | 62.5% | 45.2%(+17.3)#95 | 37.3%(+25.2)#2,298 |
| 96. | Bothell | 62.2% | 45.2%(+17.0)#96 | 37.3%(+24.9)#2,342 |
| 97. | Mukilteo | 62.2% | 45.2%(+17.0)#97 | 37.3%(+24.9)#2,343 |
| 98. | Swede Heaven | 62.1% | 45.2%(+16.9)#98 | 37.3%(+24.8)#2,368 |
| 99. | Fall City | 62.0% | 45.2%(+16.8)#99 | 37.3%(+24.7)#2,389 |
| 100. | Woods Creek | 61.7% | 45.2%(+16.5)#100 | 37.3%(+24.4)#2,434 |
Common Questions
What are the Top 10 Cities with the Highest Percentage of Households with Income Above $100,000 in Washington?
Top 10 Cities with the Highest Percentage of Households with Income Above $100,000 in Washington are:
#1
100.0%
#2
100.0%
#3
100.0%
#4
100.0%
#5
100.0%
#6
100.0%
#7
100.0%
#8
100.0%
#9
100.0%
#10
88.1%
What city has the Highest Percentage of Households with Income Above $100,000 in Washington?
Ronald has the Highest Percentage of Households with Income Above $100,000 in Washington with 100.0%.
What is the Percentage of Households with Income Above $100,000 in the State of Washington?
Percentage of Households with Income Above $100,000 in Washington is 45.2%.
What is the Percentage of Households with Income Above $100,000 in the United States?
Percentage of Households with Income Above $100,000 in the United States is 37.3%.