Cities with the Highest Unemployment Rate in Washington
RELATED REPORTS & OPTIONS
Highest Unemployment
Washington
Compare Cities
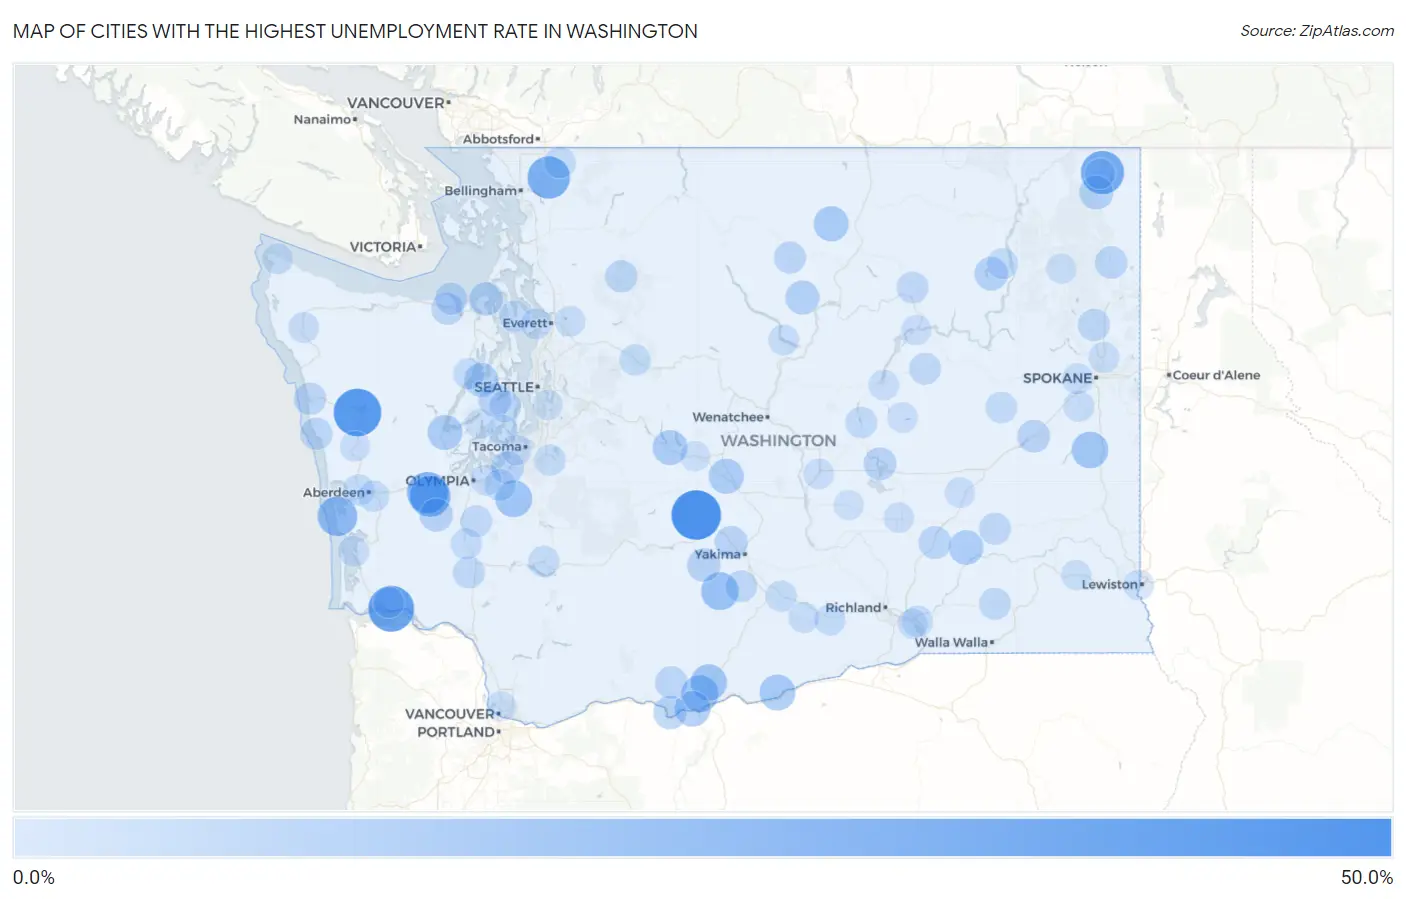
Map of Cities with the Highest Unemployment Rate in Washington
0.0%
50.0%
Cities with the Highest Unemployment Rate in Washington
| City | Unemployment Rate | vs State | vs National | |
| 1. | Nile | 50.0% | 4.6%(+45.4)#1 | 5.0%(+45.0)#163 |
| 2. | Amanda Park | 45.5% | 4.6%(+40.9)#2 | 5.0%(+40.5)#201 |
| 3. | Altoona | 41.7% | 4.6%(+37.1)#3 | 5.0%(+36.7)#234 |
| 4. | Metaline Falls | 36.0% | 4.6%(+31.4)#4 | 5.0%(+31.0)#326 |
| 5. | Deming | 34.2% | 4.6%(+29.6)#5 | 5.0%(+29.2)#376 |
| 6. | Malone | 31.0% | 4.6%(+26.4)#6 | 5.0%(+26.0)#461 |
| 7. | Porter | 30.8% | 4.6%(+26.2)#7 | 5.0%(+25.8)#466 |
| 8. | Grayland | 28.2% | 4.6%(+23.6)#8 | 5.0%(+23.2)#574 |
| 9. | White Swan | 23.9% | 4.6%(+19.3)#9 | 5.0%(+18.9)#821 |
| 10. | Centerville | 22.5% | 4.6%(+17.9)#10 | 5.0%(+17.5)#929 |
| 11. | Mckenna | 22.2% | 4.6%(+17.6)#11 | 5.0%(+17.2)#940 |
| 12. | Malden | 21.6% | 4.6%(+17.0)#12 | 5.0%(+16.6)#1,009 |
| 13. | Goldendale | 21.2% | 4.6%(+16.6)#13 | 5.0%(+16.2)#1,046 |
| 14. | Roosevelt | 20.0% | 4.6%(+15.4)#14 | 5.0%(+15.0)#1,183 |
| 15. | Wishram | 19.6% | 4.6%(+15.0)#15 | 5.0%(+14.6)#1,242 |
| 16. | Conconully | 18.3% | 4.6%(+13.7)#16 | 5.0%(+13.3)#1,426 |
| 17. | Thorp | 18.2% | 4.6%(+13.6)#17 | 5.0%(+13.2)#1,449 |
| 18. | Skokomish | 17.9% | 4.6%(+13.3)#18 | 5.0%(+12.9)#1,490 |
| 19. | Easton | 17.9% | 4.6%(+13.3)#19 | 5.0%(+12.9)#1,494 |
| 20. | Kahlotus | 17.2% | 4.6%(+12.6)#20 | 5.0%(+12.2)#1,605 |
| 21. | Methow | 16.0% | 4.6%(+11.4)#21 | 5.0%(+11.0)#1,847 |
| 22. | Seabeck | 15.9% | 4.6%(+11.3)#22 | 5.0%(+10.9)#1,855 |
| 23. | Ione | 15.8% | 4.6%(+11.2)#23 | 5.0%(+10.8)#1,885 |
| 24. | Port Townsend | 15.2% | 4.6%(+10.6)#24 | 5.0%(+10.2)#2,012 |
| 25. | Twin Lakes | 15.0% | 4.6%(+10.4)#25 | 5.0%(+10.00)#2,087 |
| 26. | Dallesport | 14.8% | 4.6%(+10.2)#26 | 5.0%(+9.80)#2,114 |
| 27. | Tampico | 14.6% | 4.6%(+10.00)#27 | 5.0%(+9.60)#2,156 |
| 28. | Oakville | 14.5% | 4.6%(+9.90)#28 | 5.0%(+9.50)#2,170 |
| 29. | Gorst | 14.2% | 4.6%(+9.60)#29 | 5.0%(+9.20)#2,261 |
| 30. | Eschbach | 14.0% | 4.6%(+9.40)#30 | 5.0%(+9.00)#2,315 |
| 31. | North Fort Lewis | 13.5% | 4.6%(+8.90)#31 | 5.0%(+8.50)#2,432 |
| 32. | Sprague | 13.5% | 4.6%(+8.90)#32 | 5.0%(+8.50)#2,447 |
| 33. | Cascade Valley | 13.4% | 4.6%(+8.80)#33 | 5.0%(+8.40)#2,464 |
| 34. | Connell | 13.3% | 4.6%(+8.70)#34 | 5.0%(+8.30)#2,492 |
| 35. | Lexington | 13.1% | 4.6%(+8.50)#35 | 5.0%(+8.10)#2,567 |
| 36. | Klickitat | 12.9% | 4.6%(+8.30)#36 | 5.0%(+7.90)#2,654 |
| 37. | Cusick | 12.8% | 4.6%(+8.20)#37 | 5.0%(+7.80)#2,699 |
| 38. | Queets | 12.5% | 4.6%(+7.90)#38 | 5.0%(+7.50)#2,826 |
| 39. | Taholah | 12.4% | 4.6%(+7.80)#39 | 5.0%(+7.40)#2,863 |
| 40. | River Road | 12.4% | 4.6%(+7.80)#40 | 5.0%(+7.40)#2,864 |
| 41. | Deer Park | 12.3% | 4.6%(+7.70)#41 | 5.0%(+7.30)#2,886 |
| 42. | Darrington | 12.3% | 4.6%(+7.70)#42 | 5.0%(+7.30)#2,899 |
| 43. | Jamestown | 12.3% | 4.6%(+7.70)#43 | 5.0%(+7.30)#2,919 |
| 44. | Twisp | 12.1% | 4.6%(+7.50)#44 | 5.0%(+7.10)#2,988 |
| 45. | Winlock | 11.9% | 4.6%(+7.30)#45 | 5.0%(+6.90)#3,069 |
| 46. | Harrah | 11.9% | 4.6%(+7.30)#46 | 5.0%(+6.90)#3,081 |
| 47. | Washtucna | 11.9% | 4.6%(+7.30)#47 | 5.0%(+6.90)#3,094 |
| 48. | Prescott | 11.8% | 4.6%(+7.20)#48 | 5.0%(+6.80)#3,135 |
| 49. | Bethel | 11.6% | 4.6%(+7.00)#49 | 5.0%(+6.60)#3,197 |
| 50. | Almira | 11.5% | 4.6%(+6.90)#50 | 5.0%(+6.50)#3,276 |
| 51. | Nespelem Community | 11.5% | 4.6%(+6.90)#51 | 5.0%(+6.50)#3,280 |
| 52. | Bucoda | 11.4% | 4.6%(+6.80)#52 | 5.0%(+6.40)#3,322 |
| 53. | Soap Lake | 11.0% | 4.6%(+6.40)#53 | 5.0%(+6.00)#3,506 |
| 54. | Kendall | 11.0% | 4.6%(+6.40)#54 | 5.0%(+6.00)#3,511 |
| 55. | Nisqually Indian Community | 11.0% | 4.6%(+6.40)#55 | 5.0%(+6.00)#3,523 |
| 56. | Freeland | 10.8% | 4.6%(+6.20)#56 | 5.0%(+5.80)#3,604 |
| 57. | Harrington | 10.8% | 4.6%(+6.20)#57 | 5.0%(+5.80)#3,626 |
| 58. | Hoquiam | 10.5% | 4.6%(+5.90)#58 | 5.0%(+5.50)#3,761 |
| 59. | Chehalis | 10.5% | 4.6%(+5.90)#59 | 5.0%(+5.50)#3,762 |
| 60. | Granger | 10.5% | 4.6%(+5.90)#60 | 5.0%(+5.50)#3,768 |
| 61. | Burbank | 10.5% | 4.6%(+5.90)#61 | 5.0%(+5.50)#3,771 |
| 62. | Alderton | 10.4% | 4.6%(+5.80)#62 | 5.0%(+5.40)#3,831 |
| 63. | Cosmopolis | 10.4% | 4.6%(+5.80)#63 | 5.0%(+5.40)#3,834 |
| 64. | Baring | 10.3% | 4.6%(+5.70)#64 | 5.0%(+5.30)#3,924 |
| 65. | Brinnon | 10.0% | 4.6%(+5.40)#65 | 5.0%(+5.00)#4,118 |
| 66. | Prosser | 9.9% | 4.6%(+5.30)#66 | 5.0%(+4.90)#4,166 |
| 67. | Morton | 9.9% | 4.6%(+5.30)#67 | 5.0%(+4.90)#4,193 |
| 68. | Inchelium | 9.9% | 4.6%(+5.30)#68 | 5.0%(+4.90)#4,215 |
| 69. | Rosburg | 9.8% | 4.6%(+5.20)#69 | 5.0%(+4.80)#4,267 |
| 70. | Cheney | 9.7% | 4.6%(+5.10)#70 | 5.0%(+4.70)#4,292 |
| 71. | Tanglewilde | 9.7% | 4.6%(+5.10)#71 | 5.0%(+4.70)#4,300 |
| 72. | Mead | 9.6% | 4.6%(+5.00)#72 | 5.0%(+4.60)#4,377 |
| 73. | Forks | 9.6% | 4.6%(+5.00)#73 | 5.0%(+4.60)#4,381 |
| 74. | Airway Heights | 9.5% | 4.6%(+4.90)#74 | 5.0%(+4.50)#4,445 |
| 75. | Mabton | 9.5% | 4.6%(+4.90)#75 | 5.0%(+4.50)#4,462 |
| 76. | Manson | 9.2% | 4.6%(+4.60)#76 | 5.0%(+4.20)#4,724 |
| 77. | Machias | 9.2% | 4.6%(+4.60)#77 | 5.0%(+4.20)#4,730 |
| 78. | Clinton | 9.2% | 4.6%(+4.60)#78 | 5.0%(+4.20)#4,736 |
| 79. | Neah Bay | 9.2% | 4.6%(+4.60)#79 | 5.0%(+4.20)#4,739 |
| 80. | Bay Center | 9.2% | 4.6%(+4.60)#80 | 5.0%(+4.20)#4,772 |
| 81. | Riverpoint | 9.1% | 4.6%(+4.50)#81 | 5.0%(+4.10)#4,822 |
| 82. | Fircrest | 9.0% | 4.6%(+4.40)#82 | 5.0%(+4.00)#4,887 |
| 83. | George | 9.0% | 4.6%(+4.40)#83 | 5.0%(+4.00)#4,934 |
| 84. | Coulee City | 9.0% | 4.6%(+4.40)#84 | 5.0%(+4.00)#4,941 |
| 85. | Othello | 8.9% | 4.6%(+4.30)#85 | 5.0%(+3.90)#4,981 |
| 86. | Grand Coulee | 8.9% | 4.6%(+4.30)#86 | 5.0%(+3.90)#5,015 |
| 87. | Clarkston | 8.8% | 4.6%(+4.20)#87 | 5.0%(+3.80)#5,068 |
| 88. | Wilson Creek | 8.7% | 4.6%(+4.10)#88 | 5.0%(+3.70)#5,254 |
| 89. | Metaline | 8.7% | 4.6%(+4.10)#89 | 5.0%(+3.70)#5,258 |
| 90. | Rosedale | 8.6% | 4.6%(+4.00)#90 | 5.0%(+3.60)#5,301 |
| 91. | Lind | 8.6% | 4.6%(+4.00)#91 | 5.0%(+3.60)#5,340 |
| 92. | Humptulips | 8.6% | 4.6%(+4.00)#92 | 5.0%(+3.60)#5,355 |
| 93. | Bryn Mawr Skyway | 8.5% | 4.6%(+3.90)#93 | 5.0%(+3.50)#5,372 |
| 94. | Pomeroy | 8.5% | 4.6%(+3.90)#94 | 5.0%(+3.50)#5,419 |
| 95. | Finley | 8.3% | 4.6%(+3.70)#95 | 5.0%(+3.30)#5,585 |
| 96. | Chewelah | 8.3% | 4.6%(+3.70)#96 | 5.0%(+3.30)#5,599 |
| 97. | Allyn | 8.3% | 4.6%(+3.70)#97 | 5.0%(+3.30)#5,604 |
| 98. | Royal City | 8.3% | 4.6%(+3.70)#98 | 5.0%(+3.30)#5,606 |
| 99. | South Cle Elum | 8.2% | 4.6%(+3.60)#99 | 5.0%(+3.20)#5,739 |
| 100. | Hazel Dell | 8.1% | 4.6%(+3.50)#100 | 5.0%(+3.10)#5,777 |
Common Questions
What are the Top 10 Cities with the Highest Unemployment Rate in Washington?
Top 10 Cities with the Highest Unemployment Rate in Washington are:
#1
50.0%
#2
45.5%
#3
41.7%
#4
36.0%
#5
34.2%
#6
31.0%
#7
30.8%
#8
28.2%
#9
23.9%
#10
22.5%
What city has the Highest Unemployment Rate in Washington?
Nile has the Highest Unemployment Rate in Washington with 50.0%.
What is the Unemployment Rate in the State of Washington?
Unemployment Rate in Washington is 4.6%.
What is the Unemployment Rate in the United States?
Unemployment Rate in the United States is 5.0%.