Cities with the Highest Percentage of Immigrants from Iraq in Washington
RELATED REPORTS & OPTIONS
Iraq
Washington
Compare Cities
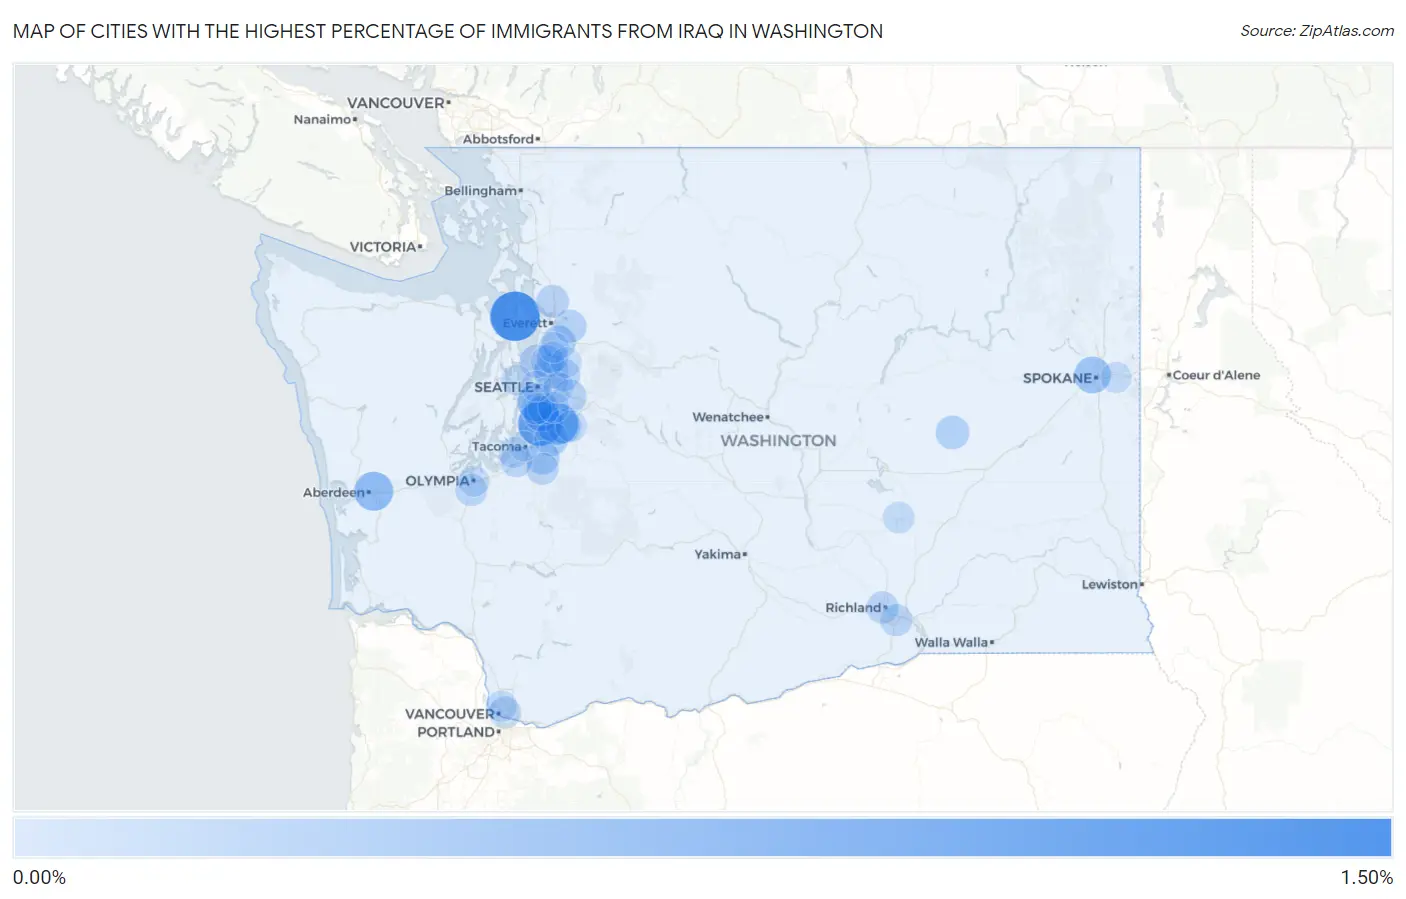
Map of Cities with the Highest Percentage of Immigrants from Iraq in Washington
0.00%
1.50%
Cities with the Highest Percentage of Immigrants from Iraq in Washington
| City | Iraq | vs State | vs National | |
| 1. | Freeland | 1.43% | 0.081%(+1.34)#-1 | 0.071%(+1.35)#0 |
| 2. | Des Moines | 1.03% | 0.081%(+0.944)#0 | 0.071%(+0.955)#1 |
| 3. | Kent | 0.83% | 0.081%(+0.752)#1 | 0.071%(+0.763)#2 |
| 4. | Aberdeen | 0.64% | 0.081%(+0.561)#2 | 0.071%(+0.572)#3 |
| 5. | White Center | 0.54% | 0.081%(+0.461)#3 | 0.071%(+0.472)#4 |
| 6. | Spokane | 0.47% | 0.081%(+0.384)#19 | 0.071%(+0.394)#429 |
| 7. | Seatac | 0.38% | 0.081%(+0.303)#20 | 0.071%(+0.314)#430 |
| 8. | Kirkland | 0.32% | 0.081%(+0.235)#21 | 0.071%(+0.246)#431 |
| 9. | Covington | 0.28% | 0.081%(+0.202)#22 | 0.071%(+0.213)#432 |
| 10. | Auburn | 0.28% | 0.081%(+0.195)#23 | 0.071%(+0.206)#433 |
| 11. | Silver Firs | 0.27% | 0.081%(+0.193)#24 | 0.071%(+0.204)#434 |
| 12. | Puyallup | 0.26% | 0.081%(+0.179)#25 | 0.071%(+0.190)#435 |
| 13. | Odessa | 0.25% | 0.081%(+0.169)#26 | 0.071%(+0.180)#436 |
| 14. | Shoreline | 0.22% | 0.081%(+0.140)#27 | 0.071%(+0.151)#437 |
| 15. | Issaquah | 0.21% | 0.081%(+0.127)#28 | 0.071%(+0.137)#438 |
| 16. | Everett | 0.21% | 0.081%(+0.126)#29 | 0.071%(+0.137)#439 |
| 17. | Marysville | 0.20% | 0.081%(+0.119)#30 | 0.071%(+0.130)#440 |
| 18. | Redmond | 0.19% | 0.081%(+0.107)#31 | 0.071%(+0.118)#441 |
| 19. | Kenmore | 0.18% | 0.081%(+0.101)#32 | 0.071%(+0.111)#442 |
| 20. | Richland | 0.16% | 0.081%(+0.081)#33 | 0.071%(+0.092)#443 |
| 21. | Kennewick | 0.16% | 0.081%(+0.077)#34 | 0.071%(+0.088)#444 |
| 22. | Vancouver | 0.14% | 0.081%(+0.056)#35 | 0.071%(+0.067)#445 |
| 23. | Tumwater | 0.13% | 0.081%(+0.051)#36 | 0.071%(+0.062)#446 |
| 24. | South Hill | 0.13% | 0.081%(+0.051)#37 | 0.071%(+0.062)#447 |
| 25. | Lakewood | 0.13% | 0.081%(+0.050)#38 | 0.071%(+0.061)#448 |
| 26. | Bothell | 0.13% | 0.081%(+0.048)#39 | 0.071%(+0.059)#449 |
| 27. | Tukwila | 0.10% | 0.081%(+0.021)#40 | 0.071%(+0.031)#450 |
| 28. | Othello | 0.093% | 0.081%(+0.012)#41 | 0.071%(+0.023)#451 |
| 29. | Hazel Dell | 0.092% | 0.081%(+0.011)#42 | 0.071%(+0.022)#452 |
| 30. | Maple Valley | 0.090% | 0.081%(+0.008)#43 | 0.071%(+0.019)#453 |
| 31. | Burien | 0.083% | 0.081%(+0.002)#44 | 0.071%(+0.013)#454 |
| 32. | Olympia | 0.074% | 0.081%(-0.007)#45 | 0.071%(+0.004)#455 |
| 33. | Renton | 0.064% | 0.081%(-0.018)#46 | 0.071%(-0.007)#456 |
| 34. | Spokane Valley | 0.060% | 0.081%(-0.022)#47 | 0.071%(-0.011)#457 |
| 35. | Bainbridge Island | 0.053% | 0.081%(-0.029)#48 | 0.071%(-0.018)#458 |
| 36. | University Place | 0.052% | 0.081%(-0.030)#49 | 0.071%(-0.019)#459 |
| 37. | Seattle | 0.050% | 0.081%(-0.031)#50 | 0.071%(-0.021)#460 |
| 38. | Cottage Lake | 0.043% | 0.081%(-0.038)#51 | 0.071%(-0.028)#461 |
| 39. | Mill Creek East | 0.036% | 0.081%(-0.046)#52 | 0.071%(-0.035)#462 |
| 40. | Bellevue | 0.035% | 0.081%(-0.046)#53 | 0.071%(-0.036)#463 |
| 41. | Tacoma | 0.0018% | 0.081%(-0.080)#54 | 0.071%(-0.069)#464 |
Common Questions
What are the Top 10 Cities with the Highest Percentage of Immigrants from Iraq in Washington?
Top 10 Cities with the Highest Percentage of Immigrants from Iraq in Washington are:
#1
1.43%
#2
1.03%
#3
0.83%
#4
0.64%
#5
0.54%
#6
0.47%
#7
0.38%
#8
0.32%
#9
0.28%
#10
0.28%
What city has the Highest Percentage of Immigrants from Iraq in Washington?
Freeland has the Highest Percentage of Immigrants from Iraq in Washington with 1.43%.
What is the Percentage of Immigrants from Iraq in the State of Washington?
Percentage of Immigrants from Iraq in Washington is 0.081%.
What is the Percentage of Immigrants from Iraq in the United States?
Percentage of Immigrants from Iraq in the United States is 0.071%.