Cities with the Highest Percentage of Population with a Degree in Education in Washington
RELATED REPORTS & OPTIONS
Education
Washington
Compare Cities
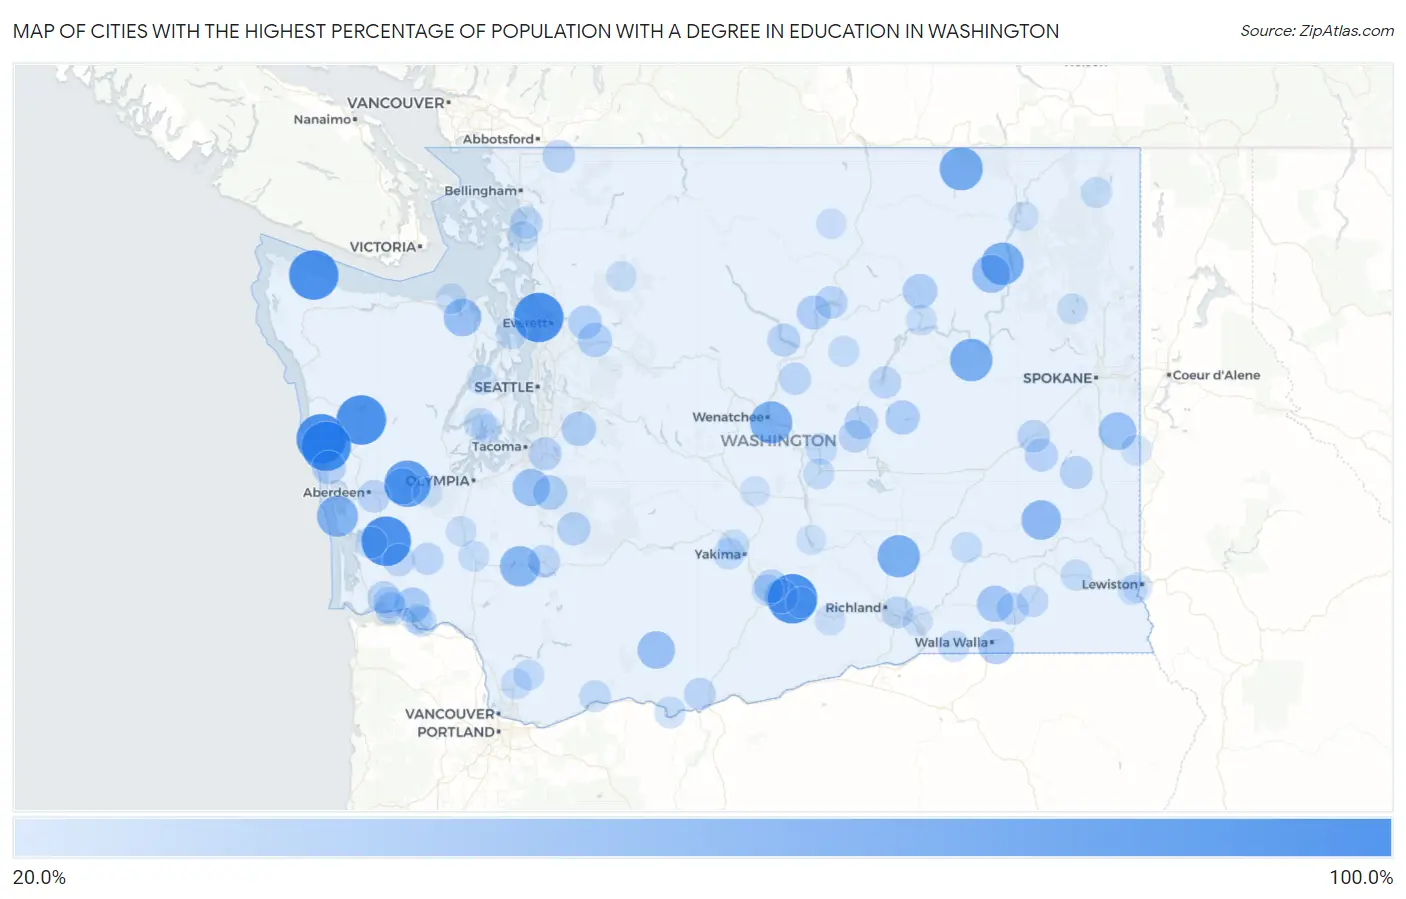
Map of Cities with the Highest Percentage of Population with a Degree in Education in Washington
0.0%
100.0%
Cities with the Highest Percentage of Population with a Degree in Education in Washington
| City | % Graduates | vs State | vs National | |
| 1. | Outlook | 100.0% | 8.8%(+91.2)#1 | 11.1%(+88.9)#85 |
| 2. | Marine View | 100.0% | 8.8%(+91.2)#2 | 11.1%(+88.9)#86 |
| 3. | Neilton | 100.0% | 8.8%(+91.2)#3 | 11.1%(+88.9)#103 |
| 4. | Willapa | 100.0% | 8.8%(+91.2)#4 | 11.1%(+88.9)#170 |
| 5. | Santiago | 100.0% | 8.8%(+91.2)#5 | 11.1%(+88.9)#305 |
| 6. | Sekiu | 100.0% | 8.8%(+91.2)#6 | 11.1%(+88.9)#345 |
| 7. | Qui Nai Elt Village | 100.0% | 8.8%(+91.2)#7 | 11.1%(+88.9)#357 |
| 8. | Hat Island | 100.0% | 8.8%(+91.2)#8 | 11.1%(+88.9)#404 |
| 9. | Satsop | 88.0% | 8.8%(+79.2)#9 | 11.1%(+76.9)#477 |
| 10. | Curlew | 75.0% | 8.8%(+66.2)#10 | 11.1%(+63.9)#631 |
| 11. | Inchelium | 72.2% | 8.8%(+63.4)#11 | 11.1%(+61.2)#687 |
| 12. | Creston | 72.2% | 8.8%(+63.4)#12 | 11.1%(+61.2)#689 |
| 13. | Basin City | 71.4% | 8.8%(+62.6)#13 | 11.1%(+60.4)#697 |
| 14. | South Wenatchee | 71.3% | 8.8%(+62.4)#14 | 11.1%(+60.2)#725 |
| 15. | Grayland | 67.0% | 8.8%(+58.1)#15 | 11.1%(+55.9)#809 |
| 16. | Mossyrock | 63.6% | 8.8%(+54.8)#16 | 11.1%(+52.6)#934 |
| 17. | Lacrosse | 61.3% | 8.8%(+52.5)#17 | 11.1%(+50.3)#1,011 |
| 18. | Ocosta | 55.6% | 8.8%(+46.7)#18 | 11.1%(+44.5)#1,305 |
| 19. | Twin Lakes | 55.6% | 8.8%(+46.7)#19 | 11.1%(+44.5)#1,307 |
| 20. | Blyn | 53.6% | 8.8%(+44.7)#20 | 11.1%(+42.5)#1,415 |
| 21. | Glenwood | 53.3% | 8.8%(+44.5)#21 | 11.1%(+42.3)#1,435 |
| 22. | Waverly | 53.3% | 8.8%(+44.5)#22 | 11.1%(+42.3)#1,437 |
| 23. | South Creek | 52.3% | 8.8%(+43.5)#23 | 11.1%(+41.3)#1,481 |
| 24. | Brady | 48.3% | 8.8%(+39.5)#24 | 11.1%(+37.3)#1,876 |
| 25. | Prescott | 48.1% | 8.8%(+39.3)#25 | 11.1%(+37.1)#1,894 |
| 26. | Walla Walla East | 45.8% | 8.8%(+36.9)#26 | 11.1%(+34.7)#2,122 |
| 27. | Skamokawa Valley | 43.9% | 8.8%(+35.0)#27 | 11.1%(+32.8)#2,345 |
| 28. | Kapowsin | 41.7% | 8.8%(+32.8)#28 | 11.1%(+30.6)#2,661 |
| 29. | Nespelem | 41.7% | 8.8%(+32.8)#29 | 11.1%(+30.6)#2,673 |
| 30. | Ravensdale | 41.4% | 8.8%(+32.6)#30 | 11.1%(+30.3)#2,697 |
| 31. | Wilson Creek | 41.4% | 8.8%(+32.6)#31 | 11.1%(+30.3)#2,702 |
| 32. | Granger | 40.7% | 8.8%(+31.9)#32 | 11.1%(+29.7)#2,794 |
| 33. | Pateros | 40.0% | 8.8%(+31.2)#33 | 11.1%(+28.9)#2,887 |
| 34. | North Sultan | 40.0% | 8.8%(+31.2)#34 | 11.1%(+28.9)#2,902 |
| 35. | Lake Roesiger | 39.4% | 8.8%(+30.6)#35 | 11.1%(+28.3)#3,043 |
| 36. | Copalis Beach | 39.0% | 8.8%(+30.2)#36 | 11.1%(+28.0)#3,105 |
| 37. | Zillah | 38.3% | 8.8%(+29.5)#37 | 11.1%(+27.3)#3,236 |
| 38. | Soap Lake | 37.7% | 8.8%(+28.9)#38 | 11.1%(+26.7)#3,341 |
| 39. | Ashford | 37.3% | 8.8%(+28.5)#39 | 11.1%(+26.3)#3,444 |
| 40. | North Puyallup | 36.6% | 8.8%(+27.8)#40 | 11.1%(+25.5)#3,591 |
| 41. | St John | 36.6% | 8.8%(+27.7)#41 | 11.1%(+25.5)#3,601 |
| 42. | Lamont | 36.4% | 8.8%(+27.5)#42 | 11.1%(+25.3)#3,651 |
| 43. | Manson | 36.0% | 8.8%(+27.2)#43 | 11.1%(+25.0)#3,712 |
| 44. | Altoona | 36.0% | 8.8%(+27.2)#44 | 11.1%(+24.9)#3,727 |
| 45. | Deep River | 35.5% | 8.8%(+26.7)#45 | 11.1%(+24.4)#3,864 |
| 46. | Peaceful Valley | 35.4% | 8.8%(+26.5)#46 | 11.1%(+24.3)#3,881 |
| 47. | Ephrata | 35.3% | 8.8%(+26.5)#47 | 11.1%(+24.2)#3,912 |
| 48. | Brewster | 35.1% | 8.8%(+26.3)#48 | 11.1%(+24.0)#3,946 |
| 49. | Sprague | 34.9% | 8.8%(+26.1)#49 | 11.1%(+23.8)#3,992 |
| 50. | Cosmopolis | 34.7% | 8.8%(+25.9)#50 | 11.1%(+23.6)#4,038 |
| 51. | Morton | 34.4% | 8.8%(+25.5)#51 | 11.1%(+23.3)#4,124 |
| 52. | Waterville | 33.8% | 8.8%(+25.0)#52 | 11.1%(+22.7)#4,260 |
| 53. | Edison | 33.7% | 8.8%(+24.9)#53 | 11.1%(+22.6)#4,274 |
| 54. | Waitsburg | 33.6% | 8.8%(+24.8)#54 | 11.1%(+22.6)#4,294 |
| 55. | Banks Lake South | 33.3% | 8.8%(+24.5)#55 | 11.1%(+22.3)#4,470 |
| 56. | Lebam | 33.3% | 8.8%(+24.5)#56 | 11.1%(+22.3)#4,483 |
| 57. | Pe Ell | 32.4% | 8.8%(+23.5)#57 | 11.1%(+21.3)#4,792 |
| 58. | West Pasco | 32.3% | 8.8%(+23.5)#58 | 11.1%(+21.2)#4,809 |
| 59. | Centerville | 32.1% | 8.8%(+23.3)#59 | 11.1%(+21.1)#4,852 |
| 60. | Allyn | 31.8% | 8.8%(+23.0)#60 | 11.1%(+20.7)#4,951 |
| 61. | Rosburg | 31.6% | 8.8%(+22.8)#61 | 11.1%(+20.5)#5,016 |
| 62. | South Bend | 31.4% | 8.8%(+22.6)#62 | 11.1%(+20.4)#5,054 |
| 63. | Toppenish | 31.3% | 8.8%(+22.5)#63 | 11.1%(+20.3)#5,101 |
| 64. | Carson | 31.1% | 8.8%(+22.3)#64 | 11.1%(+20.1)#5,169 |
| 65. | Dayton | 31.0% | 8.8%(+22.2)#65 | 11.1%(+19.9)#5,212 |
| 66. | Quincy | 30.8% | 8.8%(+22.0)#66 | 11.1%(+19.8)#5,280 |
| 67. | Dallesport | 30.7% | 8.8%(+21.9)#67 | 11.1%(+19.6)#5,336 |
| 68. | Summitview | 30.7% | 8.8%(+21.8)#68 | 11.1%(+19.6)#5,349 |
| 69. | Touchet | 30.0% | 8.8%(+21.2)#69 | 11.1%(+18.9)#5,538 |
| 70. | Pomeroy | 29.9% | 8.8%(+21.0)#70 | 11.1%(+18.8)#5,594 |
| 71. | George | 29.4% | 8.8%(+20.6)#71 | 11.1%(+18.4)#5,769 |
| 72. | Lewisville | 29.1% | 8.8%(+20.3)#72 | 11.1%(+18.1)#5,912 |
| 73. | Ione | 29.1% | 8.8%(+20.3)#73 | 11.1%(+18.1)#5,923 |
| 74. | Mansfield | 29.1% | 8.8%(+20.3)#74 | 11.1%(+18.0)#5,931 |
| 75. | East Cathlamet | 29.0% | 8.8%(+20.2)#75 | 11.1%(+17.9)#5,967 |
| 76. | Gleed | 28.9% | 8.8%(+20.1)#76 | 11.1%(+17.8)#6,017 |
| 77. | Napavine | 28.8% | 8.8%(+20.0)#77 | 11.1%(+17.8)#6,031 |
| 78. | Yacolt | 28.7% | 8.8%(+19.9)#78 | 11.1%(+17.7)#6,057 |
| 79. | Sunnyside | 28.7% | 8.8%(+19.9)#79 | 11.1%(+17.7)#6,060 |
| 80. | Hansville | 28.7% | 8.8%(+19.9)#80 | 11.1%(+17.6)#6,068 |
| 81. | Bay View | 28.7% | 8.8%(+19.8)#81 | 11.1%(+17.6)#6,077 |
| 82. | Kahlotus | 28.6% | 8.8%(+19.7)#82 | 11.1%(+17.5)#6,157 |
| 83. | Prosser | 28.3% | 8.8%(+19.5)#83 | 11.1%(+17.2)#6,268 |
| 84. | Jamestown | 28.3% | 8.8%(+19.4)#84 | 11.1%(+17.2)#6,280 |
| 85. | Loon Lake | 28.2% | 8.8%(+19.4)#85 | 11.1%(+17.1)#6,298 |
| 86. | Tekoa | 27.9% | 8.8%(+19.1)#86 | 11.1%(+16.9)#6,404 |
| 87. | Elmer City | 27.5% | 8.8%(+18.7)#87 | 11.1%(+16.4)#6,587 |
| 88. | Fords Prairie | 27.3% | 8.8%(+18.5)#88 | 11.1%(+16.2)#6,642 |
| 89. | Cathlamet | 27.3% | 8.8%(+18.4)#89 | 11.1%(+16.2)#6,661 |
| 90. | Darrington | 26.6% | 8.8%(+17.8)#90 | 11.1%(+15.6)#6,979 |
| 91. | Conconully | 26.1% | 8.8%(+17.3)#91 | 11.1%(+15.0)#7,206 |
| 92. | Vaughn | 25.9% | 8.8%(+17.1)#92 | 11.1%(+14.8)#7,284 |
| 93. | Burbank | 25.8% | 8.8%(+17.0)#93 | 11.1%(+14.8)#7,305 |
| 94. | Kittitas | 25.6% | 8.8%(+16.8)#94 | 11.1%(+14.5)#7,411 |
| 95. | West Clarkston Highland | 25.6% | 8.8%(+16.8)#95 | 11.1%(+14.5)#7,422 |
| 96. | Seabeck | 25.5% | 8.8%(+16.7)#96 | 11.1%(+14.5)#7,440 |
| 97. | Desert Aire | 25.5% | 8.8%(+16.7)#97 | 11.1%(+14.4)#7,443 |
| 98. | Kettle Falls | 25.3% | 8.8%(+16.5)#98 | 11.1%(+14.3)#7,521 |
| 99. | Clarkston Heights Vineland | 25.3% | 8.8%(+16.5)#99 | 11.1%(+14.2)#7,536 |
| 100. | Malone | 25.3% | 8.8%(+16.5)#100 | 11.1%(+14.2)#7,549 |
Common Questions
What are the Top 10 Cities with the Highest Percentage of Population with a Degree in Education in Washington?
Top 10 Cities with the Highest Percentage of Population with a Degree in Education in Washington are:
#1
100.0%
#2
100.0%
#3
100.0%
#4
100.0%
#5
100.0%
#6
100.0%
#7
100.0%
#8
88.0%
#9
75.0%
#10
72.2%
What city has the Highest Percentage of Population with a Degree in Education in Washington?
Outlook has the Highest Percentage of Population with a Degree in Education in Washington with 100.0%.
What is the Percentage of Population with a Degree in Education in the State of Washington?
Percentage of Population with a Degree in Education in Washington is 8.8%.
What is the Percentage of Population with a Degree in Education in the United States?
Percentage of Population with a Degree in Education in the United States is 11.1%.