Cities with the Largest Serbian Community in Washington
RELATED REPORTS & OPTIONS
Serbian
Washington
Compare Cities
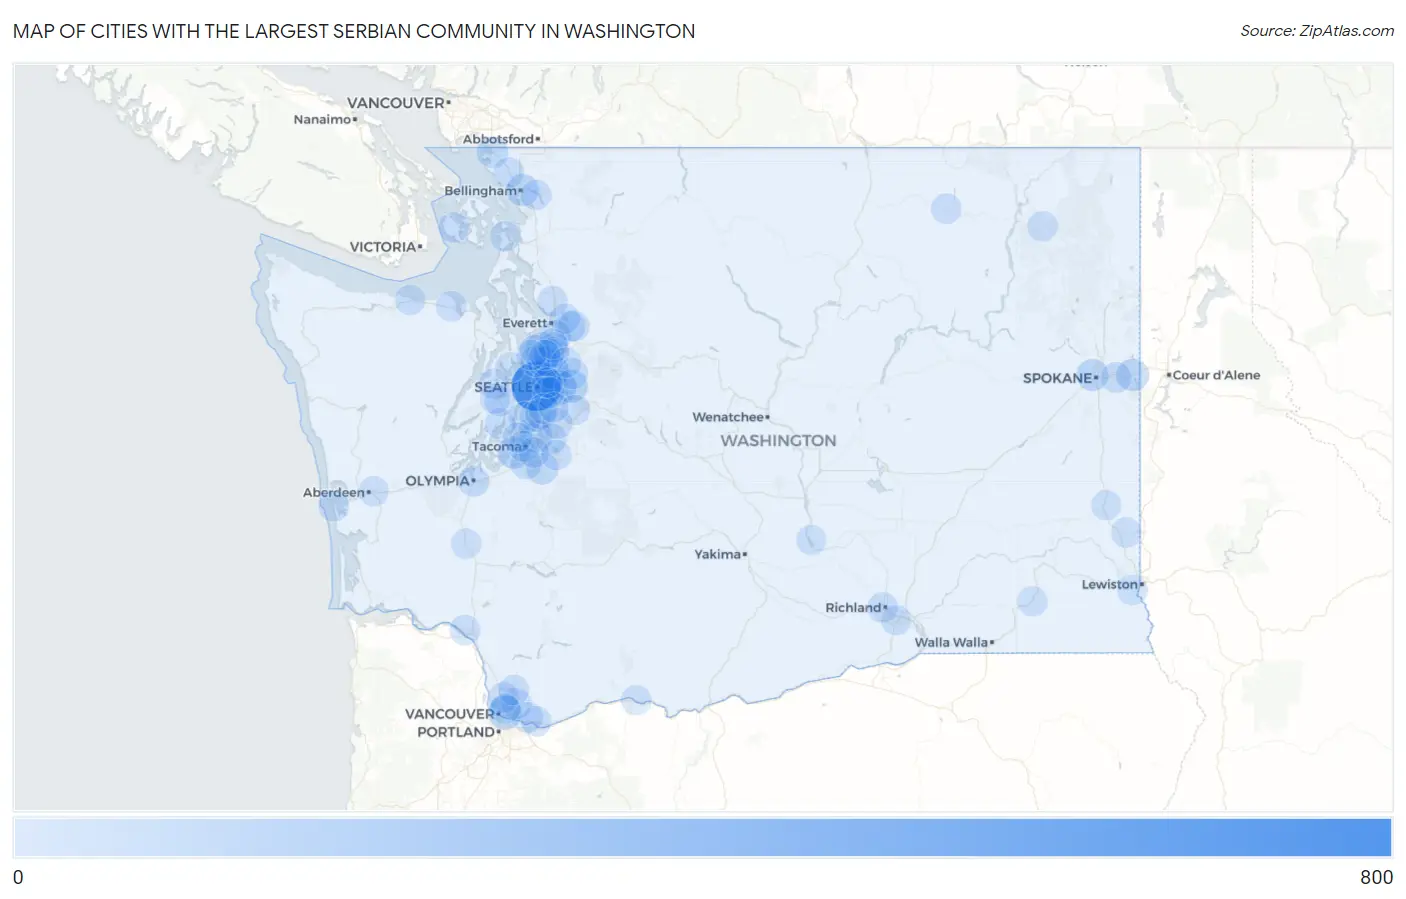
Map of Cities with the Largest Serbian Community in Washington
0
800
Cities with the Largest Serbian Community in Washington
| City | Serbian | vs State | vs National | |
| 1. | Seattle | 726 | 3,344(21.71%)#1 | 194,511(0.37%)#15 |
| 2. | Kirkland | 181 | 3,344(5.41%)#2 | 194,511(0.09%)#163 |
| 3. | Bellevue | 174 | 3,344(5.20%)#3 | 194,511(0.09%)#173 |
| 4. | Vancouver | 132 | 3,344(3.95%)#4 | 194,511(0.07%)#245 |
| 5. | Sammamish | 110 | 3,344(3.29%)#5 | 194,511(0.06%)#306 |
| 6. | Federal Way | 92 | 3,344(2.75%)#6 | 194,511(0.05%)#359 |
| 7. | Lynnwood | 85 | 3,344(2.54%)#7 | 194,511(0.04%)#397 |
| 8. | University Place | 82 | 3,344(2.45%)#8 | 194,511(0.04%)#411 |
| 9. | Bellingham | 78 | 3,344(2.33%)#9 | 194,511(0.04%)#430 |
| 10. | Liberty Lake | 73 | 3,344(2.18%)#10 | 194,511(0.04%)#464 |
| 11. | Spokane | 70 | 3,344(2.09%)#11 | 194,511(0.04%)#479 |
| 12. | Vashon | 60 | 3,344(1.79%)#12 | 194,511(0.03%)#581 |
| 13. | South Hill | 54 | 3,344(1.61%)#13 | 194,511(0.03%)#639 |
| 14. | Eastmont | 52 | 3,344(1.56%)#14 | 194,511(0.03%)#668 |
| 15. | Normandy Park | 49 | 3,344(1.47%)#15 | 194,511(0.03%)#708 |
| 16. | Mercer Island | 46 | 3,344(1.38%)#16 | 194,511(0.02%)#749 |
| 17. | Blaine | 46 | 3,344(1.38%)#17 | 194,511(0.02%)#757 |
| 18. | Shoreline | 45 | 3,344(1.35%)#18 | 194,511(0.02%)#764 |
| 19. | Snohomish | 42 | 3,344(1.26%)#19 | 194,511(0.02%)#814 |
| 20. | Parkland | 40 | 3,344(1.20%)#20 | 194,511(0.02%)#847 |
| 21. | Seatac | 39 | 3,344(1.17%)#21 | 194,511(0.02%)#862 |
| 22. | Tacoma | 38 | 3,344(1.14%)#22 | 194,511(0.02%)#871 |
| 23. | Fairwood Cdp King County | 36 | 3,344(1.08%)#23 | 194,511(0.02%)#908 |
| 24. | Union Hill Novelty Hill | 35 | 3,344(1.05%)#24 | 194,511(0.02%)#923 |
| 25. | Olympia | 34 | 3,344(1.02%)#25 | 194,511(0.02%)#937 |
| 26. | Bothell East | 34 | 3,344(1.02%)#26 | 194,511(0.02%)#943 |
| 27. | Everett | 30 | 3,344(0.90%)#27 | 194,511(0.02%)#1,010 |
| 28. | Ferndale | 28 | 3,344(0.84%)#28 | 194,511(0.01%)#1,074 |
| 29. | Orchards | 27 | 3,344(0.81%)#29 | 194,511(0.01%)#1,097 |
| 30. | Auburn | 24 | 3,344(0.72%)#30 | 194,511(0.01%)#1,179 |
| 31. | Camas | 24 | 3,344(0.72%)#31 | 194,511(0.01%)#1,189 |
| 32. | Mount Vista | 24 | 3,344(0.72%)#32 | 194,511(0.01%)#1,199 |
| 33. | Wauna | 23 | 3,344(0.69%)#33 | 194,511(0.01%)#1,239 |
| 34. | Spokane Valley | 22 | 3,344(0.66%)#34 | 194,511(0.01%)#1,246 |
| 35. | Richland | 21 | 3,344(0.63%)#35 | 194,511(0.01%)#1,294 |
| 36. | Lake Forest Park | 21 | 3,344(0.63%)#36 | 194,511(0.01%)#1,311 |
| 37. | Republic | 18 | 3,344(0.54%)#37 | 194,511(0.01%)#1,470 |
| 38. | Kenmore | 17 | 3,344(0.51%)#38 | 194,511(0.01%)#1,489 |
| 39. | Sudden Valley | 17 | 3,344(0.51%)#39 | 194,511(0.01%)#1,504 |
| 40. | Westport | 17 | 3,344(0.51%)#40 | 194,511(0.01%)#1,517 |
| 41. | Bothell West | 16 | 3,344(0.48%)#41 | 194,511(0.01%)#1,542 |
| 42. | Marysville | 15 | 3,344(0.45%)#42 | 194,511(0.01%)#1,579 |
| 43. | Longview | 15 | 3,344(0.45%)#43 | 194,511(0.01%)#1,586 |
| 44. | Tukwila | 15 | 3,344(0.45%)#44 | 194,511(0.01%)#1,592 |
| 45. | Port Orchard | 15 | 3,344(0.45%)#45 | 194,511(0.01%)#1,598 |
| 46. | Friday Harbor | 15 | 3,344(0.45%)#46 | 194,511(0.01%)#1,626 |
| 47. | Kent | 13 | 3,344(0.39%)#47 | 194,511(0.01%)#1,705 |
| 48. | Waller | 13 | 3,344(0.39%)#48 | 194,511(0.01%)#1,752 |
| 49. | Chico | 13 | 3,344(0.39%)#49 | 194,511(0.01%)#1,769 |
| 50. | Lake Stevens | 12 | 3,344(0.36%)#50 | 194,511(0.01%)#1,793 |
| 51. | Port Angeles | 12 | 3,344(0.36%)#51 | 194,511(0.01%)#1,811 |
| 52. | Edmonds | 11 | 3,344(0.33%)#52 | 194,511(0.01%)#1,869 |
| 53. | Battle Ground | 11 | 3,344(0.33%)#53 | 194,511(0.01%)#1,884 |
| 54. | Clarkston Heights Vineland | 11 | 3,344(0.33%)#54 | 194,511(0.01%)#1,906 |
| 55. | Kennewick | 10 | 3,344(0.30%)#55 | 194,511(0.01%)#1,945 |
| 56. | Bremerton | 10 | 3,344(0.30%)#56 | 194,511(0.01%)#1,952 |
| 57. | Mill Creek East | 10 | 3,344(0.30%)#57 | 194,511(0.01%)#1,967 |
| 58. | Bonney Lake | 10 | 3,344(0.30%)#58 | 194,511(0.01%)#1,972 |
| 59. | Mill Creek | 10 | 3,344(0.30%)#59 | 194,511(0.01%)#1,974 |
| 60. | Washougal | 10 | 3,344(0.30%)#60 | 194,511(0.01%)#1,983 |
| 61. | Sequim | 10 | 3,344(0.30%)#61 | 194,511(0.01%)#2,012 |
| 62. | Brier | 10 | 3,344(0.30%)#62 | 194,511(0.01%)#2,016 |
| 63. | Colville | 10 | 3,344(0.30%)#63 | 194,511(0.01%)#2,027 |
| 64. | Mirrormont | 10 | 3,344(0.30%)#64 | 194,511(0.01%)#2,035 |
| 65. | Renton | 9 | 3,344(0.27%)#65 | 194,511(0.00%)#2,069 |
| 66. | Cottage Lake | 9 | 3,344(0.27%)#66 | 194,511(0.00%)#2,091 |
| 67. | Anacortes | 9 | 3,344(0.27%)#67 | 194,511(0.00%)#2,096 |
| 68. | Chehalis | 9 | 3,344(0.27%)#68 | 194,511(0.00%)#2,119 |
| 69. | Desert Aire | 9 | 3,344(0.27%)#69 | 194,511(0.00%)#2,140 |
| 70. | Bingen | 9 | 3,344(0.27%)#70 | 194,511(0.00%)#2,152 |
| 71. | Woodway | 8 | 3,344(0.24%)#71 | 194,511(0.00%)#2,250 |
| 72. | Pullman | 7 | 3,344(0.21%)#72 | 194,511(0.00%)#2,276 |
| 73. | Colfax | 7 | 3,344(0.21%)#73 | 194,511(0.00%)#2,309 |
| 74. | Aberdeen | 6 | 3,344(0.18%)#74 | 194,511(0.00%)#2,353 |
| 75. | Minnehaha | 6 | 3,344(0.18%)#75 | 194,511(0.00%)#2,360 |
| 76. | Suquamish | 6 | 3,344(0.18%)#76 | 194,511(0.00%)#2,372 |
| 77. | Medina | 3 | 3,344(0.09%)#77 | 194,511(0.00%)#2,599 |
| 78. | Dayton | 3 | 3,344(0.09%)#78 | 194,511(0.00%)#2,602 |
| 79. | Ruston | 3 | 3,344(0.09%)#79 | 194,511(0.00%)#2,631 |
Common Questions
What are the Top 10 Cities with the Largest Serbian Community in Washington?
Top 10 Cities with the Largest Serbian Community in Washington are:
#1
726
#2
181
#3
174
#4
132
#5
110
#6
92
#7
85
#8
82
#9
78
#10
73
What city has the Largest Serbian Community in Washington?
Seattle has the Largest Serbian Community in Washington with 726.
What is the Total Serbian Population in the State of Washington?
Total Serbian Population in Washington is 3,344.
What is the Total Serbian Population in the United States?
Total Serbian Population in the United States is 194,511.