Cities with the Most Immigrants from Lebanon in Washington
RELATED REPORTS & OPTIONS
Lebanon
Washington
Compare Cities
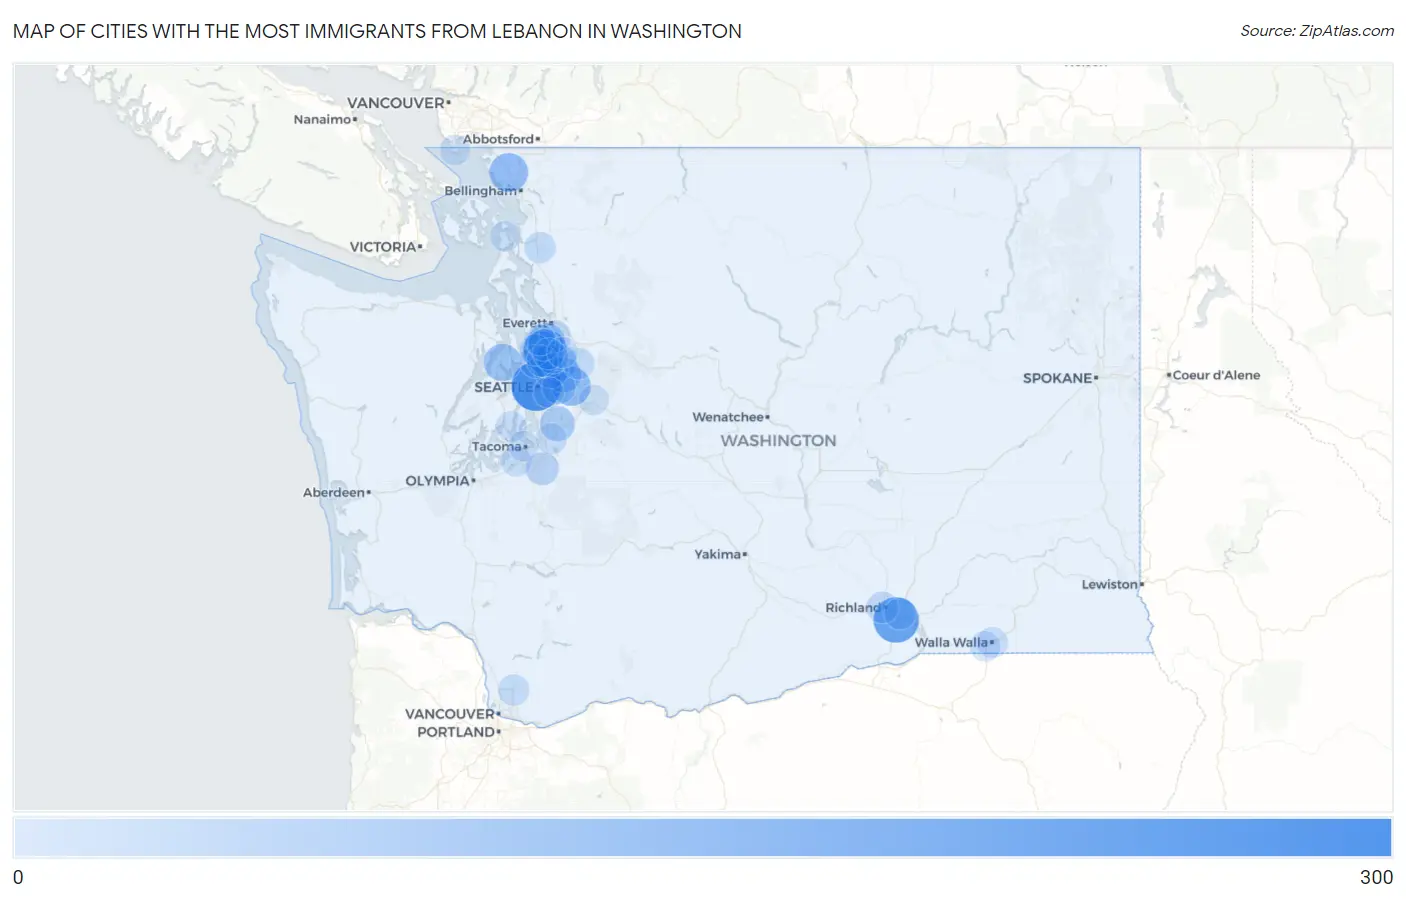
Map of Cities with the Most Immigrants from Lebanon in Washington
0
300
Cities with the Most Immigrants from Lebanon in Washington
| City | Lebanon | vs State | vs National | |
| 1. | Seattle | 288 | 2,031(14.18%)#1 | 133,021(0.22%)#55 |
| 2. | Kennewick | 225 | 2,031(11.08%)#2 | 133,021(0.17%)#79 |
| 3. | Alderwood Manor | 204 | 2,031(10.04%)#3 | 133,021(0.15%)#89 |
| 4. | Sammamish | 128 | 2,031(6.30%)#4 | 133,021(0.10%)#151 |
| 5. | Ferndale | 126 | 2,031(6.20%)#5 | 133,021(0.09%)#158 |
| 6. | Poulsbo | 105 | 2,031(5.17%)#6 | 133,021(0.08%)#185 |
| 7. | Lake Stickney | 89 | 2,031(4.38%)#7 | 133,021(0.07%)#233 |
| 8. | Woodinville | 88 | 2,031(4.33%)#8 | 133,021(0.07%)#235 |
| 9. | Lynnwood | 78 | 2,031(3.84%)#9 | 133,021(0.06%)#269 |
| 10. | Redmond | 75 | 2,031(3.69%)#10 | 133,021(0.06%)#283 |
| 11. | Kent | 69 | 2,031(3.40%)#11 | 133,021(0.05%)#307 |
| 12. | Kirkland | 50 | 2,031(2.46%)#12 | 133,021(0.04%)#414 |
| 13. | Kenmore | 49 | 2,031(2.41%)#13 | 133,021(0.04%)#425 |
| 14. | Bellevue | 45 | 2,031(2.22%)#14 | 133,021(0.03%)#457 |
| 15. | Shoreline | 45 | 2,031(2.22%)#15 | 133,021(0.03%)#460 |
| 16. | South Hill | 39 | 2,031(1.92%)#16 | 133,021(0.03%)#521 |
| 17. | Bothell | 27 | 2,031(1.33%)#17 | 133,021(0.02%)#699 |
| 18. | Richland | 23 | 2,031(1.13%)#18 | 133,021(0.02%)#778 |
| 19. | Eastmont | 23 | 2,031(1.13%)#19 | 133,021(0.02%)#782 |
| 20. | Pasco | 21 | 2,031(1.03%)#20 | 133,021(0.02%)#816 |
| 21. | Duvall | 18 | 2,031(0.89%)#21 | 133,021(0.01%)#925 |
| 22. | Edmonds | 17 | 2,031(0.84%)#22 | 133,021(0.01%)#938 |
| 23. | Mount Vernon | 17 | 2,031(0.84%)#23 | 133,021(0.01%)#940 |
| 24. | Lake Forest Park | 17 | 2,031(0.84%)#24 | 133,021(0.01%)#950 |
| 25. | North Lynnwood | 16 | 2,031(0.79%)#25 | 133,021(0.01%)#981 |
| 26. | Bothell West | 16 | 2,031(0.79%)#26 | 133,021(0.01%)#983 |
| 27. | Battle Ground | 15 | 2,031(0.74%)#27 | 133,021(0.01%)#1,008 |
| 28. | Auburn | 11 | 2,031(0.54%)#28 | 133,021(0.01%)#1,133 |
| 29. | Picnic Point | 11 | 2,031(0.54%)#29 | 133,021(0.01%)#1,165 |
| 30. | Walla Walla | 10 | 2,031(0.49%)#30 | 133,021(0.01%)#1,202 |
| 31. | Lakewood | 9 | 2,031(0.44%)#31 | 133,021(0.01%)#1,252 |
| 32. | Maltby | 9 | 2,031(0.44%)#32 | 133,021(0.01%)#1,275 |
| 33. | Maplewood | 7 | 2,031(0.34%)#33 | 133,021(0.01%)#1,378 |
| 34. | Tacoma | 4 | 2,031(0.20%)#34 | 133,021(0.00%)#1,446 |
| 35. | College Place | 4 | 2,031(0.20%)#35 | 133,021(0.00%)#1,462 |
| 36. | Point Roberts | 4 | 2,031(0.20%)#36 | 133,021(0.00%)#1,478 |
| 37. | Mercer Island | 3 | 2,031(0.15%)#37 | 133,021(0.00%)#1,491 |
| 38. | Snoqualmie | 3 | 2,031(0.15%)#38 | 133,021(0.00%)#1,497 |
| 39. | Anacortes | 2 | 2,031(0.10%)#39 | 133,021(0.00%)#1,519 |
Common Questions
What are the Top 10 Cities with the Most Immigrants from Lebanon in Washington?
Top 10 Cities with the Most Immigrants from Lebanon in Washington are:
#1
288
#2
225
#3
204
#4
128
#5
126
#6
105
#7
89
#8
88
#9
78
#10
75
What city has the Most Immigrants from Lebanon in Washington?
Seattle has the Most Immigrants from Lebanon in Washington with 288.
What is the Total Immigrants from Lebanon in the State of Washington?
Total Immigrants from Lebanon in Washington is 2,031.
What is the Total Immigrants from Lebanon in the United States?
Total Immigrants from Lebanon in the United States is 133,021.