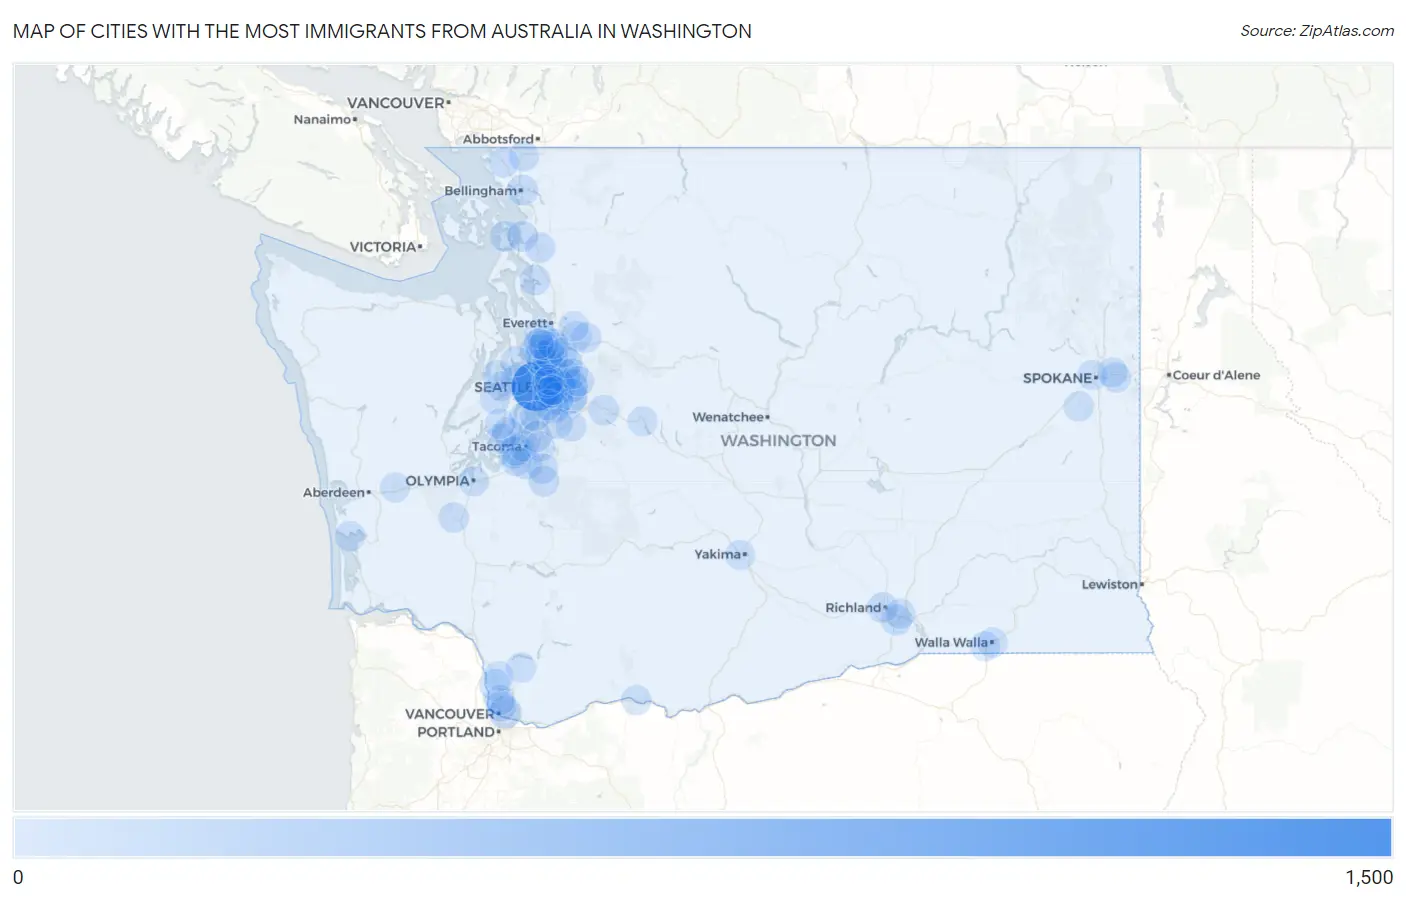
Cities with the Most Immigrants from Australia in Washington
RELATED REPORTS & OPTIONS
Australia
Washington
Compare Cities
Map of Cities with the Most Immigrants from Australia in Washington
0
1,500
Cities with the Most Immigrants from Australia in Washington
| City | Australia | vs State | vs National | |
| 1. | Seattle | 1,036 | 4,499(23.03%)#1 | 98,163(1.06%)#6 |
| 2. | Issaquah | 237 | 4,499(5.27%)#2 | 98,163(0.24%)#36 |
| 3. | Kirkland | 231 | 4,499(5.13%)#3 | 98,163(0.24%)#38 |
| 4. | Bellevue | 193 | 4,499(4.29%)#4 | 98,163(0.20%)#54 |
| 5. | Sammamish | 157 | 4,499(3.49%)#5 | 98,163(0.16%)#75 |
| 6. | Redmond | 141 | 4,499(3.13%)#6 | 98,163(0.14%)#88 |
| 7. | Vancouver | 134 | 4,499(2.98%)#7 | 98,163(0.14%)#92 |
| 8. | Newcastle | 130 | 4,499(2.89%)#8 | 98,163(0.13%)#96 |
| 9. | Cottage Lake | 80 | 4,499(1.78%)#9 | 98,163(0.08%)#178 |
| 10. | Renton | 78 | 4,499(1.73%)#10 | 98,163(0.08%)#182 |
| 11. | Vashon | 72 | 4,499(1.60%)#11 | 98,163(0.07%)#202 |
| 12. | Ridgefield | 67 | 4,499(1.49%)#12 | 98,163(0.07%)#213 |
| 13. | University Place | 65 | 4,499(1.44%)#13 | 98,163(0.07%)#218 |
| 14. | Lake Stickney | 56 | 4,499(1.24%)#14 | 98,163(0.06%)#263 |
| 15. | Parkland | 48 | 4,499(1.07%)#15 | 98,163(0.05%)#314 |
| 16. | Mercer Island | 47 | 4,499(1.04%)#16 | 98,163(0.05%)#323 |
| 17. | Fircrest | 47 | 4,499(1.04%)#17 | 98,163(0.05%)#326 |
| 18. | Kennewick | 43 | 4,499(0.96%)#18 | 98,163(0.04%)#352 |
| 19. | Bainbridge Island | 43 | 4,499(0.96%)#19 | 98,163(0.04%)#355 |
| 20. | Bothell | 39 | 4,499(0.87%)#20 | 98,163(0.04%)#403 |
| 21. | Edmonds | 38 | 4,499(0.84%)#21 | 98,163(0.04%)#424 |
| 22. | Tacoma | 33 | 4,499(0.73%)#22 | 98,163(0.03%)#482 |
| 23. | Anacortes | 32 | 4,499(0.71%)#23 | 98,163(0.03%)#508 |
| 24. | Federal Way | 30 | 4,499(0.67%)#24 | 98,163(0.03%)#527 |
| 25. | Bellingham | 30 | 4,499(0.67%)#25 | 98,163(0.03%)#528 |
| 26. | Bay View | 30 | 4,499(0.67%)#26 | 98,163(0.03%)#536 |
| 27. | Richland | 29 | 4,499(0.64%)#27 | 98,163(0.03%)#539 |
| 28. | Mill Creek East | 29 | 4,499(0.64%)#28 | 98,163(0.03%)#547 |
| 29. | Graham | 27 | 4,499(0.60%)#29 | 98,163(0.03%)#581 |
| 30. | Mountlake Terrace | 27 | 4,499(0.60%)#30 | 98,163(0.03%)#586 |
| 31. | Lake Forest Park | 27 | 4,499(0.60%)#31 | 98,163(0.03%)#591 |
| 32. | Union Hill Novelty Hill | 26 | 4,499(0.58%)#32 | 98,163(0.03%)#605 |
| 33. | Milton | 25 | 4,499(0.56%)#33 | 98,163(0.03%)#643 |
| 34. | Riverbend | 25 | 4,499(0.56%)#34 | 98,163(0.03%)#648 |
| 35. | Maple Valley | 23 | 4,499(0.51%)#35 | 98,163(0.02%)#684 |
| 36. | Bremerton | 22 | 4,499(0.49%)#36 | 98,163(0.02%)#707 |
| 37. | Hazel Dell | 21 | 4,499(0.47%)#37 | 98,163(0.02%)#741 |
| 38. | Artondale | 21 | 4,499(0.47%)#38 | 98,163(0.02%)#745 |
| 39. | Chain Lake | 21 | 4,499(0.47%)#39 | 98,163(0.02%)#754 |
| 40. | Stanwood | 20 | 4,499(0.44%)#40 | 98,163(0.02%)#779 |
| 41. | Lynnwood | 19 | 4,499(0.42%)#41 | 98,163(0.02%)#803 |
| 42. | Bryn Mawr Skyway | 18 | 4,499(0.40%)#42 | 98,163(0.02%)#851 |
| 43. | Gig Harbor | 18 | 4,499(0.40%)#43 | 98,163(0.02%)#858 |
| 44. | Kent | 15 | 4,499(0.33%)#44 | 98,163(0.02%)#948 |
| 45. | Silverdale | 15 | 4,499(0.33%)#45 | 98,163(0.02%)#961 |
| 46. | Lynden | 15 | 4,499(0.33%)#46 | 98,163(0.02%)#969 |
| 47. | South Hill | 14 | 4,499(0.31%)#47 | 98,163(0.01%)#1,008 |
| 48. | Kenmore | 14 | 4,499(0.31%)#48 | 98,163(0.01%)#1,023 |
| 49. | Bothell West | 14 | 4,499(0.31%)#49 | 98,163(0.01%)#1,026 |
| 50. | Woods Creek | 14 | 4,499(0.31%)#50 | 98,163(0.01%)#1,041 |
| 51. | Tokeland | 14 | 4,499(0.31%)#51 | 98,163(0.01%)#1,059 |
| 52. | Spokane Valley | 13 | 4,499(0.29%)#52 | 98,163(0.01%)#1,061 |
| 53. | Olympia | 13 | 4,499(0.29%)#53 | 98,163(0.01%)#1,071 |
| 54. | Custer | 13 | 4,499(0.29%)#54 | 98,163(0.01%)#1,116 |
| 55. | Mukilteo | 12 | 4,499(0.27%)#55 | 98,163(0.01%)#1,146 |
| 56. | Mill Creek | 12 | 4,499(0.27%)#56 | 98,163(0.01%)#1,148 |
| 57. | Normandy Park | 12 | 4,499(0.27%)#57 | 98,163(0.01%)#1,160 |
| 58. | Rochester | 12 | 4,499(0.27%)#58 | 98,163(0.01%)#1,162 |
| 59. | Wauna | 12 | 4,499(0.27%)#59 | 98,163(0.01%)#1,165 |
| 60. | Mount Vernon | 11 | 4,499(0.24%)#60 | 98,163(0.01%)#1,195 |
| 61. | North Lynnwood | 11 | 4,499(0.24%)#61 | 98,163(0.01%)#1,209 |
| 62. | Salmon Creek | 11 | 4,499(0.24%)#62 | 98,163(0.01%)#1,212 |
| 63. | Ames Lake | 11 | 4,499(0.24%)#63 | 98,163(0.01%)#1,247 |
| 64. | Pasco | 9 | 4,499(0.20%)#64 | 98,163(0.01%)#1,338 |
| 65. | Tracyton | 9 | 4,499(0.20%)#65 | 98,163(0.01%)#1,391 |
| 66. | Bingen | 9 | 4,499(0.20%)#66 | 98,163(0.01%)#1,411 |
| 67. | Yakima | 8 | 4,499(0.18%)#67 | 98,163(0.01%)#1,416 |
| 68. | Walla Walla | 8 | 4,499(0.18%)#68 | 98,163(0.01%)#1,432 |
| 69. | Cheney | 8 | 4,499(0.18%)#69 | 98,163(0.01%)#1,454 |
| 70. | Medina | 8 | 4,499(0.18%)#70 | 98,163(0.01%)#1,480 |
| 71. | Amboy | 8 | 4,499(0.18%)#71 | 98,163(0.01%)#1,483 |
| 72. | Snoqualmie Pass | 7 | 4,499(0.16%)#72 | 98,163(0.01%)#1,561 |
| 73. | Montesano | 6 | 4,499(0.13%)#73 | 98,163(0.01%)#1,617 |
| 74. | La Center | 6 | 4,499(0.13%)#74 | 98,163(0.01%)#1,618 |
| 75. | Spokane | 5 | 4,499(0.11%)#75 | 98,163(0.01%)#1,646 |
| 76. | Lakewood | 5 | 4,499(0.11%)#76 | 98,163(0.01%)#1,653 |
| 77. | Maltby | 5 | 4,499(0.11%)#77 | 98,163(0.01%)#1,672 |
| 78. | Snohomish | 5 | 4,499(0.11%)#78 | 98,163(0.01%)#1,675 |
| 79. | Meadowdale | 5 | 4,499(0.11%)#79 | 98,163(0.01%)#1,692 |
| 80. | College Place | 4 | 4,499(0.09%)#80 | 98,163(0.00%)#1,736 |
| 81. | Millwood | 4 | 4,499(0.09%)#81 | 98,163(0.00%)#1,755 |
| 82. | Yarrow Point | 4 | 4,499(0.09%)#82 | 98,163(0.00%)#1,763 |
| 83. | Indianola | 2 | 4,499(0.04%)#83 | 98,163(0.00%)#1,858 |
| 84. | Beaux Arts Village | 1 | 4,499(0.02%)#84 | 98,163(0.00%)#1,936 |
Common Questions
What are the Top 10 Cities with the Most Immigrants from Australia in Washington?
Top 10 Cities with the Most Immigrants from Australia in Washington are:
What city has the Most Immigrants from Australia in Washington?
Seattle has the Most Immigrants from Australia in Washington with 1,036.
What is the Total Immigrants from Australia in the State of Washington?
Total Immigrants from Australia in Washington is 4,499.
What is the Total Immigrants from Australia in the United States?
Total Immigrants from Australia in the United States is 98,163.