Cities with the Lowest Unemployment Rate Amomg Seniors Over the Age of 65 in Washington
RELATED REPORTS & OPTIONS
Lowest Unemployment | Senior > 65
Washington
Compare Cities
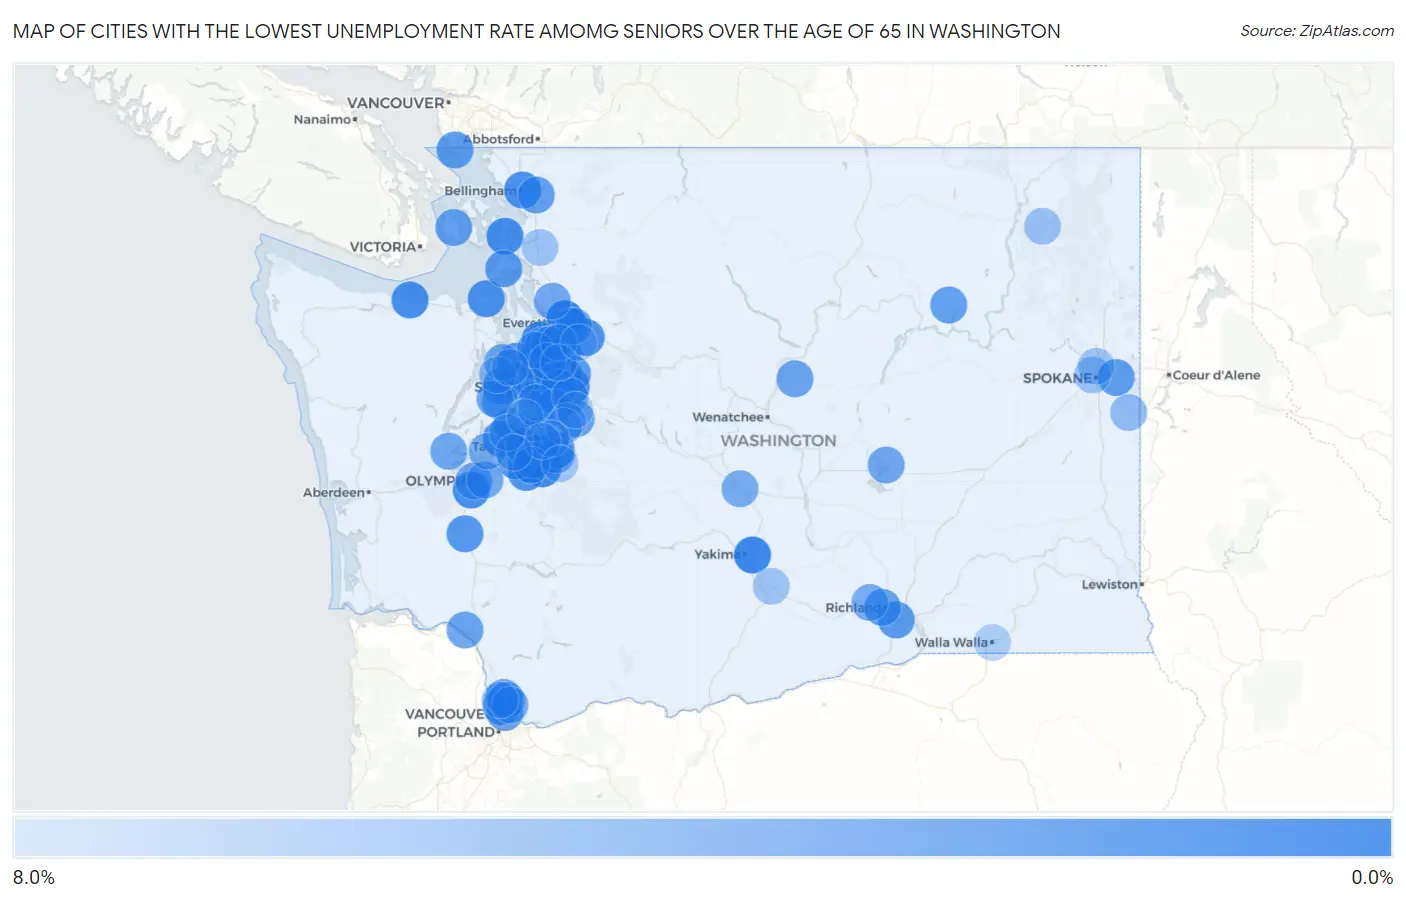
Map of Cities with the Lowest Unemployment Rate Amomg Seniors Over the Age of 65 in Washington
8.0%
0.0%
Cities with the Lowest Unemployment Rate Amomg Seniors Over the Age of 65 in Washington
| City | Senior Unemployment | vs State | vs National | |
| 1. | Lake Stevens | 0.30% | 3.4%(-3.10)#1 | 3.9%(-3.60)#16 |
| 2. | Sammamish | 0.50% | 3.4%(-2.90)#2 | 3.9%(-3.40)#48 |
| 3. | Puyallup | 0.50% | 3.4%(-2.90)#3 | 3.9%(-3.40)#55 |
| 4. | Picnic Point | 0.60% | 3.4%(-2.80)#4 | 3.9%(-3.30)#96 |
| 5. | Terrace Heights | 0.60% | 3.4%(-2.80)#5 | 3.9%(-3.30)#97 |
| 6. | South Hill | 0.70% | 3.4%(-2.70)#6 | 3.9%(-3.20)#104 |
| 7. | Parkland | 0.90% | 3.4%(-2.50)#7 | 3.9%(-3.00)#161 |
| 8. | Maltby | 0.90% | 3.4%(-2.50)#8 | 3.9%(-3.00)#184 |
| 9. | Shoreline | 1.0% | 3.4%(-2.40)#9 | 3.9%(-2.90)#197 |
| 10. | Anacortes | 1.1% | 3.4%(-2.30)#10 | 3.9%(-2.80)#266 |
| 11. | Tumwater | 1.2% | 3.4%(-2.20)#11 | 3.9%(-2.70)#297 |
| 12. | Mercer Island | 1.2% | 3.4%(-2.20)#12 | 3.9%(-2.70)#298 |
| 13. | Port Angeles | 1.2% | 3.4%(-2.20)#13 | 3.9%(-2.70)#303 |
| 14. | Lake Tapps | 1.2% | 3.4%(-2.20)#14 | 3.9%(-2.70)#319 |
| 15. | Port Townsend | 1.4% | 3.4%(-2.00)#15 | 3.9%(-2.50)#422 |
| 16. | Waller | 1.4% | 3.4%(-2.00)#16 | 3.9%(-2.50)#427 |
| 17. | Bellingham | 1.6% | 3.4%(-1.80)#17 | 3.9%(-2.30)#487 |
| 18. | Artondale | 1.6% | 3.4%(-1.80)#18 | 3.9%(-2.30)#524 |
| 19. | Woods Creek | 1.6% | 3.4%(-1.80)#19 | 3.9%(-2.30)#537 |
| 20. | Federal Way | 1.7% | 3.4%(-1.70)#20 | 3.9%(-2.20)#551 |
| 21. | Spanaway | 1.7% | 3.4%(-1.70)#21 | 3.9%(-2.20)#564 |
| 22. | Lynnwood | 1.9% | 3.4%(-1.50)#22 | 3.9%(-2.00)#683 |
| 23. | Hazel Dell | 2.0% | 3.4%(-1.40)#23 | 3.9%(-1.90)#757 |
| 24. | Tracyton | 2.1% | 3.4%(-1.30)#24 | 3.9%(-1.80)#846 |
| 25. | Indianola | 2.1% | 3.4%(-1.30)#25 | 3.9%(-1.80)#851 |
| 26. | Centralia | 2.2% | 3.4%(-1.20)#26 | 3.9%(-1.70)#897 |
| 27. | Kennewick | 2.3% | 3.4%(-1.10)#27 | 3.9%(-1.60)#935 |
| 28. | Oak Harbor | 2.3% | 3.4%(-1.10)#28 | 3.9%(-1.60)#955 |
| 29. | Everett | 2.4% | 3.4%(-1.00)#29 | 3.9%(-1.50)#1,002 |
| 30. | Spokane Valley | 2.4% | 3.4%(-1.00)#30 | 3.9%(-1.50)#1,003 |
| 31. | Redmond | 2.4% | 3.4%(-1.00)#31 | 3.9%(-1.50)#1,010 |
| 32. | Lakewood | 2.4% | 3.4%(-1.00)#32 | 3.9%(-1.50)#1,013 |
| 33. | Union Hill Novelty Hill | 2.5% | 3.4%(-0.900)#33 | 3.9%(-1.40)#1,112 |
| 34. | Point Roberts | 2.5% | 3.4%(-0.900)#34 | 3.9%(-1.40)#1,151 |
| 35. | Seattle | 2.8% | 3.4%(-0.600)#35 | 3.9%(-1.10)#1,293 |
| 36. | Richland | 2.8% | 3.4%(-0.600)#36 | 3.9%(-1.10)#1,310 |
| 37. | Sudden Valley | 2.8% | 3.4%(-0.600)#37 | 3.9%(-1.10)#1,348 |
| 38. | Keller | 2.8% | 3.4%(-0.600)#38 | 3.9%(-1.10)#1,372 |
| 39. | Vancouver | 2.9% | 3.4%(-0.500)#39 | 3.9%(-1.00)#1,377 |
| 40. | Maplewood | 2.9% | 3.4%(-0.500)#40 | 3.9%(-1.00)#1,428 |
| 41. | Friday Harbor | 3.0% | 3.4%(-0.400)#41 | 3.9%(-0.900)#1,517 |
| 42. | Tacoma | 3.1% | 3.4%(-0.300)#42 | 3.9%(-0.800)#1,529 |
| 43. | Hobart | 3.2% | 3.4%(-0.200)#43 | 3.9%(-0.700)#1,676 |
| 44. | Waterville | 3.2% | 3.4%(-0.200)#44 | 3.9%(-0.700)#1,694 |
| 45. | Longview | 3.3% | 3.4%(-0.100)#45 | 3.9%(-0.600)#1,722 |
| 46. | Mill Creek | 3.3% | 3.4%(-0.100)#46 | 3.9%(-0.600)#1,734 |
| 47. | Mount Vista | 3.3% | 3.4%(-0.100)#47 | 3.9%(-0.600)#1,752 |
| 48. | Burien | 3.4% | 3.4%(=0.000)#48 | 3.9%(-0.500)#1,794 |
| 49. | Bainbridge Island | 3.4% | 3.4%(=0.000)#49 | 3.9%(-0.500)#1,807 |
| 50. | Port Orchard | 3.4% | 3.4%(=0.000)#50 | 3.9%(-0.500)#1,815 |
| 51. | Bremerton | 3.5% | 3.4%(+0.100)#51 | 3.9%(-0.400)#1,875 |
| 52. | Poulsbo | 3.5% | 3.4%(+0.100)#52 | 3.9%(-0.400)#1,899 |
| 53. | Shelton | 3.5% | 3.4%(+0.100)#53 | 3.9%(-0.400)#1,904 |
| 54. | Snohomish | 3.5% | 3.4%(+0.100)#54 | 3.9%(-0.400)#1,905 |
| 55. | Barberton | 3.5% | 3.4%(+0.100)#55 | 3.9%(-0.400)#1,911 |
| 56. | Olympia | 3.6% | 3.4%(+0.200)#56 | 3.9%(-0.300)#1,942 |
| 57. | Moses Lake | 3.6% | 3.4%(+0.200)#57 | 3.9%(-0.300)#1,953 |
| 58. | Kirkland | 3.7% | 3.4%(+0.300)#58 | 3.9%(-0.200)#2,006 |
| 59. | Marysville | 3.7% | 3.4%(+0.300)#59 | 3.9%(-0.200)#2,009 |
| 60. | Bothell | 3.8% | 3.4%(+0.400)#60 | 3.9%(-0.100)#2,083 |
| 61. | Lacey | 3.9% | 3.4%(+0.500)#61 | 3.9%(=0.000)#2,159 |
| 62. | Bothell West | 4.0% | 3.4%(+0.600)#62 | 3.9%(+0.100)#2,259 |
| 63. | Ellensburg | 4.1% | 3.4%(+0.700)#63 | 3.9%(+0.200)#2,347 |
| 64. | West Richland | 4.1% | 3.4%(+0.700)#64 | 3.9%(+0.200)#2,350 |
| 65. | Bellevue | 4.2% | 3.4%(+0.800)#65 | 3.9%(+0.300)#2,398 |
| 66. | Summit | 4.2% | 3.4%(+0.800)#66 | 3.9%(+0.300)#2,434 |
| 67. | Five Corners | 4.3% | 3.4%(+0.900)#67 | 3.9%(+0.400)#2,489 |
| 68. | Fairwood Cdp King County | 4.3% | 3.4%(+0.900)#68 | 3.9%(+0.400)#2,493 |
| 69. | Longbranch | 4.3% | 3.4%(+0.900)#69 | 3.9%(+0.400)#2,515 |
| 70. | Renton | 4.4% | 3.4%(+1.00)#70 | 3.9%(+0.500)#2,540 |
| 71. | North Lynnwood | 4.4% | 3.4%(+1.00)#71 | 3.9%(+0.500)#2,554 |
| 72. | Gig Harbor | 4.4% | 3.4%(+1.00)#72 | 3.9%(+0.500)#2,572 |
| 73. | Martha Lake | 4.6% | 3.4%(+1.20)#73 | 3.9%(+0.700)#2,722 |
| 74. | White Center | 4.8% | 3.4%(+1.40)#74 | 3.9%(+0.900)#2,865 |
| 75. | Bonney Lake | 4.9% | 3.4%(+1.50)#75 | 3.9%(+1.00)#2,917 |
| 76. | Edmonds | 5.0% | 3.4%(+1.60)#76 | 3.9%(+1.10)#2,973 |
| 77. | Issaquah | 5.1% | 3.4%(+1.70)#77 | 3.9%(+1.20)#3,035 |
| 78. | Clover Creek | 5.2% | 3.4%(+1.80)#78 | 3.9%(+1.30)#3,125 |
| 79. | Silverdale | 5.4% | 3.4%(+2.00)#79 | 3.9%(+1.50)#3,247 |
| 80. | Kenmore | 5.5% | 3.4%(+2.10)#80 | 3.9%(+1.60)#3,288 |
| 81. | Rockford | 5.5% | 3.4%(+2.10)#81 | 3.9%(+1.60)#3,325 |
| 82. | Shadow Lake | 5.6% | 3.4%(+2.20)#82 | 3.9%(+1.70)#3,376 |
| 83. | Silver Firs | 5.9% | 3.4%(+2.50)#83 | 3.9%(+2.00)#3,503 |
| 84. | Covington | 6.1% | 3.4%(+2.70)#84 | 3.9%(+2.20)#3,610 |
| 85. | Colville | 6.1% | 3.4%(+2.70)#85 | 3.9%(+2.20)#3,625 |
| 86. | Spokane | 6.2% | 3.4%(+2.80)#86 | 3.9%(+2.30)#3,637 |
| 87. | Woodinville | 6.2% | 3.4%(+2.80)#87 | 3.9%(+2.30)#3,656 |
| 88. | Vashon | 6.2% | 3.4%(+2.80)#88 | 3.9%(+2.30)#3,660 |
| 89. | Suquamish | 6.3% | 3.4%(+2.90)#89 | 3.9%(+2.40)#3,732 |
| 90. | Mount Vernon | 6.4% | 3.4%(+3.00)#90 | 3.9%(+2.50)#3,749 |
| 91. | Town And Country | 6.4% | 3.4%(+3.00)#91 | 3.9%(+2.50)#3,784 |
| 92. | Zillah | 6.5% | 3.4%(+3.10)#92 | 3.9%(+2.60)#3,851 |
| 93. | Auburn | 6.6% | 3.4%(+3.20)#93 | 3.9%(+2.70)#3,862 |
| 94. | Lakeland South | 6.6% | 3.4%(+3.20)#94 | 3.9%(+2.70)#3,880 |
| 95. | Prairie Ridge | 6.6% | 3.4%(+3.20)#95 | 3.9%(+2.70)#3,881 |
| 96. | Salmon Creek | 6.8% | 3.4%(+3.40)#96 | 3.9%(+2.90)#3,978 |
| 97. | University Place | 7.4% | 3.4%(+4.00)#97 | 3.9%(+3.50)#4,213 |
| 98. | Walla Walla | 7.4% | 3.4%(+4.00)#98 | 3.9%(+3.50)#4,214 |
| 99. | Monroe | 7.8% | 3.4%(+4.40)#99 | 3.9%(+3.90)#4,362 |
| 100. | Mirrormont | 7.9% | 3.4%(+4.50)#100 | 3.9%(+4.00)#4,421 |
Common Questions
What are the Top 10 Cities with the Lowest Unemployment Rate Amomg Seniors Over the Age of 65 in Washington?
Top 10 Cities with the Lowest Unemployment Rate Amomg Seniors Over the Age of 65 in Washington are:
#1
0.30%
#2
0.50%
#3
0.50%
#4
0.60%
#5
0.60%
#6
0.70%
#7
0.90%
#8
0.90%
#9
1.0%
#10
1.1%
What city has the Lowest Unemployment Rate Amomg Seniors Over the Age of 65 in Washington?
Lake Stevens has the Lowest Unemployment Rate Amomg Seniors Over the Age of 65 in Washington with 0.30%.
What is the Unemployment Rate Amomg Seniors Over the Age of 65 in the State of Washington?
Unemployment Rate Amomg Seniors Over the Age of 65 in Washington is 3.4%.
What is the Unemployment Rate Amomg Seniors Over the Age of 65 in the United States?
Unemployment Rate Amomg Seniors Over the Age of 65 in the United States is 3.9%.