Cities with the Highest Percentage of Households Heated by Fuel Oil / Kerosene in Washington
RELATED REPORTS & OPTIONS
Fuel Oil Heating
Washington
Compare Cities
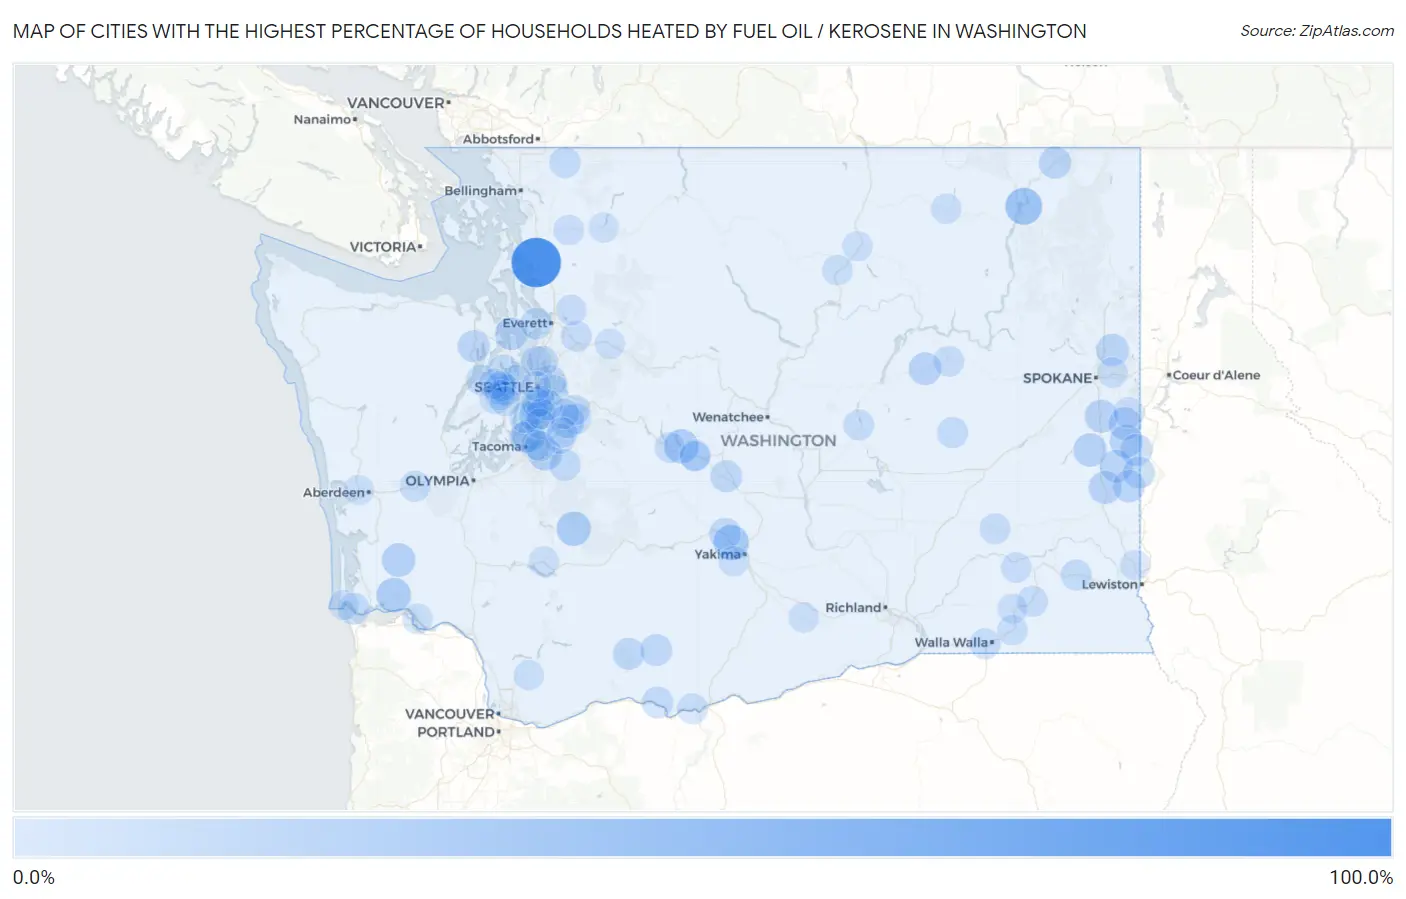
Map of Cities with the Highest Percentage of Households Heated by Fuel Oil / Kerosene in Washington
0.0%
100.0%
Cities with the Highest Percentage of Households Heated by Fuel Oil / Kerosene in Washington
| City | Fuel Oil Heating | vs State | vs National | |
| 1. | Conway | 100.0% | 1.5%(+98.5)#1 | 4.2%(+95.8)#65 |
| 2. | Marcus | 35.4% | 1.5%(+33.9)#2 | 4.2%(+31.2)#2,230 |
| 3. | Eschbach | 27.6% | 1.5%(+26.1)#3 | 4.2%(+23.4)#2,708 |
| 4. | Grays River | 23.6% | 1.5%(+22.1)#4 | 4.2%(+19.4)#3,027 |
| 5. | Ashford | 23.5% | 1.5%(+22.0)#5 | 4.2%(+19.3)#3,032 |
| 6. | Roslyn | 22.0% | 1.5%(+20.5)#6 | 4.2%(+17.8)#3,156 |
| 7. | North Puyallup | 19.5% | 1.5%(+18.0)#7 | 4.2%(+15.3)#3,392 |
| 8. | Lebam | 19.5% | 1.5%(+18.0)#8 | 4.2%(+15.3)#3,395 |
| 9. | Shadow Lake | 18.8% | 1.5%(+17.3)#9 | 4.2%(+14.6)#3,457 |
| 10. | Malden | 18.5% | 1.5%(+17.0)#10 | 4.2%(+14.3)#3,493 |
| 11. | Latah | 16.9% | 1.5%(+15.4)#11 | 4.2%(+12.7)#3,660 |
| 12. | Spangle | 16.8% | 1.5%(+15.3)#12 | 4.2%(+12.6)#3,669 |
| 13. | Fairfield | 15.8% | 1.5%(+14.3)#13 | 4.2%(+11.6)#3,808 |
| 14. | Almira | 15.6% | 1.5%(+14.1)#14 | 4.2%(+11.4)#3,842 |
| 15. | Dash Point | 15.4% | 1.5%(+13.9)#15 | 4.2%(+11.2)#3,859 |
| 16. | Steptoe | 15.3% | 1.5%(+13.8)#16 | 4.2%(+11.1)#3,876 |
| 17. | Oakesdale | 15.0% | 1.5%(+13.5)#17 | 4.2%(+10.8)#3,912 |
| 18. | Green Bluff | 14.6% | 1.5%(+13.1)#18 | 4.2%(+10.4)#3,975 |
| 19. | Hansville | 13.9% | 1.5%(+12.4)#19 | 4.2%(+9.70)#4,058 |
| 20. | Garfield | 13.5% | 1.5%(+12.0)#20 | 4.2%(+9.30)#4,108 |
| 21. | Northport | 13.3% | 1.5%(+11.8)#21 | 4.2%(+9.10)#4,139 |
| 22. | Erlands Point | 13.0% | 1.5%(+11.5)#22 | 4.2%(+8.80)#4,177 |
| 23. | Tekoa | 12.5% | 1.5%(+11.0)#23 | 4.2%(+8.30)#4,252 |
| 24. | Quilcene | 12.5% | 1.5%(+11.0)#24 | 4.2%(+8.30)#4,254 |
| 25. | Glenwood | 12.0% | 1.5%(+10.5)#25 | 4.2%(+7.80)#4,338 |
| 26. | Thorp | 12.0% | 1.5%(+10.5)#26 | 4.2%(+7.80)#4,343 |
| 27. | Clyde Hill | 11.6% | 1.5%(+10.1)#27 | 4.2%(+7.40)#4,419 |
| 28. | Farmington | 11.4% | 1.5%(+9.90)#28 | 4.2%(+7.20)#4,458 |
| 29. | Trout Lake | 11.3% | 1.5%(+9.80)#29 | 4.2%(+7.10)#4,469 |
| 30. | Sunland Estates | 11.1% | 1.5%(+9.60)#30 | 4.2%(+6.90)#4,511 |
| 31. | Normandy Park | 11.0% | 1.5%(+9.50)#31 | 4.2%(+6.80)#4,529 |
| 32. | Naches | 10.8% | 1.5%(+9.30)#32 | 4.2%(+6.60)#4,567 |
| 33. | Chinook | 10.4% | 1.5%(+8.90)#33 | 4.2%(+6.20)#4,633 |
| 34. | Lyle | 10.2% | 1.5%(+8.70)#34 | 4.2%(+6.00)#4,676 |
| 35. | Rocky Point | 9.6% | 1.5%(+8.10)#35 | 4.2%(+5.40)#4,791 |
| 36. | South Prairie | 9.4% | 1.5%(+7.90)#36 | 4.2%(+5.20)#4,847 |
| 37. | Clinton | 9.3% | 1.5%(+7.80)#37 | 4.2%(+5.10)#4,871 |
| 38. | Burien | 9.1% | 1.5%(+7.60)#38 | 4.2%(+4.90)#4,909 |
| 39. | Cle Elum | 8.4% | 1.5%(+6.90)#39 | 4.2%(+4.20)#5,084 |
| 40. | Keyport | 8.4% | 1.5%(+6.90)#40 | 4.2%(+4.20)#5,094 |
| 41. | Browns Point | 7.8% | 1.5%(+6.30)#41 | 4.2%(+3.60)#5,232 |
| 42. | Odessa | 7.7% | 1.5%(+6.20)#42 | 4.2%(+3.50)#5,255 |
| 43. | Vashon | 7.6% | 1.5%(+6.10)#43 | 4.2%(+3.40)#5,277 |
| 44. | Pomeroy | 7.5% | 1.5%(+6.00)#44 | 4.2%(+3.30)#5,308 |
| 45. | Maple Falls | 7.5% | 1.5%(+6.00)#45 | 4.2%(+3.30)#5,325 |
| 46. | Beaux Arts Village | 7.3% | 1.5%(+5.80)#46 | 4.2%(+3.10)#5,380 |
| 47. | Enetai | 7.2% | 1.5%(+5.70)#47 | 4.2%(+3.00)#5,393 |
| 48. | Lake Forest Park | 7.0% | 1.5%(+5.50)#48 | 4.2%(+2.80)#5,448 |
| 49. | Dayton | 6.9% | 1.5%(+5.40)#49 | 4.2%(+2.70)#5,482 |
| 50. | Bainbridge Island | 6.8% | 1.5%(+5.30)#50 | 4.2%(+2.60)#5,511 |
| 51. | Wishram | 6.8% | 1.5%(+5.30)#51 | 4.2%(+2.60)#5,528 |
| 52. | Garrett | 6.7% | 1.5%(+5.20)#52 | 4.2%(+2.50)#5,557 |
| 53. | Bryn Mawr Skyway | 6.6% | 1.5%(+5.10)#53 | 4.2%(+2.40)#5,578 |
| 54. | Wilbur | 6.5% | 1.5%(+5.00)#54 | 4.2%(+2.30)#5,628 |
| 55. | Chain Lake | 6.2% | 1.5%(+4.70)#55 | 4.2%(+2.00)#5,716 |
| 56. | Clear Lake Cdp Skagit County | 6.2% | 1.5%(+4.70)#56 | 4.2%(+2.00)#5,729 |
| 57. | Seabeck | 6.1% | 1.5%(+4.60)#57 | 4.2%(+1.90)#5,765 |
| 58. | Washtucna | 6.1% | 1.5%(+4.60)#58 | 4.2%(+1.90)#5,782 |
| 59. | Lakeview | 6.0% | 1.5%(+4.50)#59 | 4.2%(+1.80)#5,806 |
| 60. | Bremerton | 5.9% | 1.5%(+4.40)#60 | 4.2%(+1.70)#5,828 |
| 61. | Rockford | 5.9% | 1.5%(+4.40)#61 | 4.2%(+1.70)#5,846 |
| 62. | Elma | 5.8% | 1.5%(+4.30)#62 | 4.2%(+1.60)#5,863 |
| 63. | Easton | 5.8% | 1.5%(+4.30)#63 | 4.2%(+1.60)#5,880 |
| 64. | Tracyton | 5.6% | 1.5%(+4.10)#64 | 4.2%(+1.40)#5,931 |
| 65. | Starbuck | 5.6% | 1.5%(+4.10)#65 | 4.2%(+1.40)#5,959 |
| 66. | Hobart | 5.5% | 1.5%(+4.00)#66 | 4.2%(+1.30)#5,966 |
| 67. | Lochsloy | 5.1% | 1.5%(+3.60)#67 | 4.2%(+0.900)#6,121 |
| 68. | Millwood | 5.1% | 1.5%(+3.60)#68 | 4.2%(+0.900)#6,126 |
| 69. | White Center | 5.0% | 1.5%(+3.50)#69 | 4.2%(+0.800)#6,155 |
| 70. | Lyman | 4.9% | 1.5%(+3.40)#70 | 4.2%(+0.700)#6,235 |
| 71. | Shoreline | 4.6% | 1.5%(+3.10)#71 | 4.2%(+0.400)#6,346 |
| 72. | Malott | 4.6% | 1.5%(+3.10)#72 | 4.2%(+0.400)#6,369 |
| 73. | South Cle Elum | 4.6% | 1.5%(+3.10)#73 | 4.2%(+0.400)#6,372 |
| 74. | Dixie | 4.6% | 1.5%(+3.10)#74 | 4.2%(+0.400)#6,385 |
| 75. | Mirrormont | 4.4% | 1.5%(+2.90)#75 | 4.2%(+0.200)#6,448 |
| 76. | Republic | 4.4% | 1.5%(+2.90)#76 | 4.2%(+0.200)#6,455 |
| 77. | Yacolt | 4.3% | 1.5%(+2.80)#77 | 4.2%(+0.100)#6,491 |
| 78. | Ahtanum | 4.2% | 1.5%(+2.70)#78 | 4.2%(=0.000)#6,541 |
| 79. | Boulevard Park | 4.1% | 1.5%(+2.60)#79 | 4.2%(-0.100)#6,597 |
| 80. | Lake Holm | 4.1% | 1.5%(+2.60)#80 | 4.2%(-0.100)#6,601 |
| 81. | Maple Heights Lake Desire | 4.1% | 1.5%(+2.60)#81 | 4.2%(-0.100)#6,602 |
| 82. | Chico | 4.1% | 1.5%(+2.60)#82 | 4.2%(-0.100)#6,604 |
| 83. | Navy Yard City | 4.1% | 1.5%(+2.60)#83 | 4.2%(-0.100)#6,606 |
| 84. | Cathlamet | 4.1% | 1.5%(+2.60)#84 | 4.2%(-0.100)#6,621 |
| 85. | Gold Bar | 4.0% | 1.5%(+2.50)#85 | 4.2%(-0.200)#6,663 |
| 86. | Fife Heights | 4.0% | 1.5%(+2.50)#86 | 4.2%(-0.200)#6,667 |
| 87. | Des Moines | 3.9% | 1.5%(+2.40)#87 | 4.2%(-0.300)#6,709 |
| 88. | Seatac | 3.9% | 1.5%(+2.40)#88 | 4.2%(-0.300)#6,710 |
| 89. | Mabton | 3.9% | 1.5%(+2.40)#89 | 4.2%(-0.300)#6,726 |
| 90. | Morton | 3.8% | 1.5%(+2.30)#90 | 4.2%(-0.400)#6,774 |
| 91. | Uniontown | 3.7% | 1.5%(+2.20)#91 | 4.2%(-0.500)#6,855 |
| 92. | Hoquiam | 3.6% | 1.5%(+2.10)#92 | 4.2%(-0.600)#6,870 |
| 93. | Milton | 3.6% | 1.5%(+2.10)#93 | 4.2%(-0.600)#6,871 |
| 94. | Seattle | 3.5% | 1.5%(+2.00)#94 | 4.2%(-0.700)#6,920 |
| 95. | Lake Morton Berrydale | 3.5% | 1.5%(+2.00)#95 | 4.2%(-0.700)#6,925 |
| 96. | Omak | 3.5% | 1.5%(+2.00)#96 | 4.2%(-0.700)#6,932 |
| 97. | Waitsburg | 3.5% | 1.5%(+2.00)#97 | 4.2%(-0.700)#6,948 |
| 98. | East Port Orchard | 3.4% | 1.5%(+1.90)#98 | 4.2%(-0.800)#6,982 |
| 99. | Concrete | 3.4% | 1.5%(+1.90)#99 | 4.2%(-0.800)#7,005 |
| 100. | Ilwaco | 3.2% | 1.5%(+1.70)#100 | 4.2%(-1.00)#7,130 |
Common Questions
What are the Top 10 Cities with the Highest Percentage of Households Heated by Fuel Oil / Kerosene in Washington?
Top 10 Cities with the Highest Percentage of Households Heated by Fuel Oil / Kerosene in Washington are:
#1
100.0%
#2
35.4%
#3
27.6%
#4
23.6%
#5
23.5%
#6
22.0%
#7
19.5%
#8
19.5%
#9
18.8%
#10
18.5%
What city has the Highest Percentage of Households Heated by Fuel Oil / Kerosene in Washington?
Conway has the Highest Percentage of Households Heated by Fuel Oil / Kerosene in Washington with 100.0%.
What is the Percentage of Households Heated by Fuel Oil / Kerosene in the State of Washington?
Percentage of Households Heated by Fuel Oil / Kerosene in Washington is 1.5%.
What is the Percentage of Households Heated by Fuel Oil / Kerosene in the United States?
Percentage of Households Heated by Fuel Oil / Kerosene in the United States is 4.2%.