Cities with the Highest Percentage of Mexican American Indian Population in Washington
RELATED REPORTS & OPTIONS
Mexican American Indian
Washington
Compare Cities
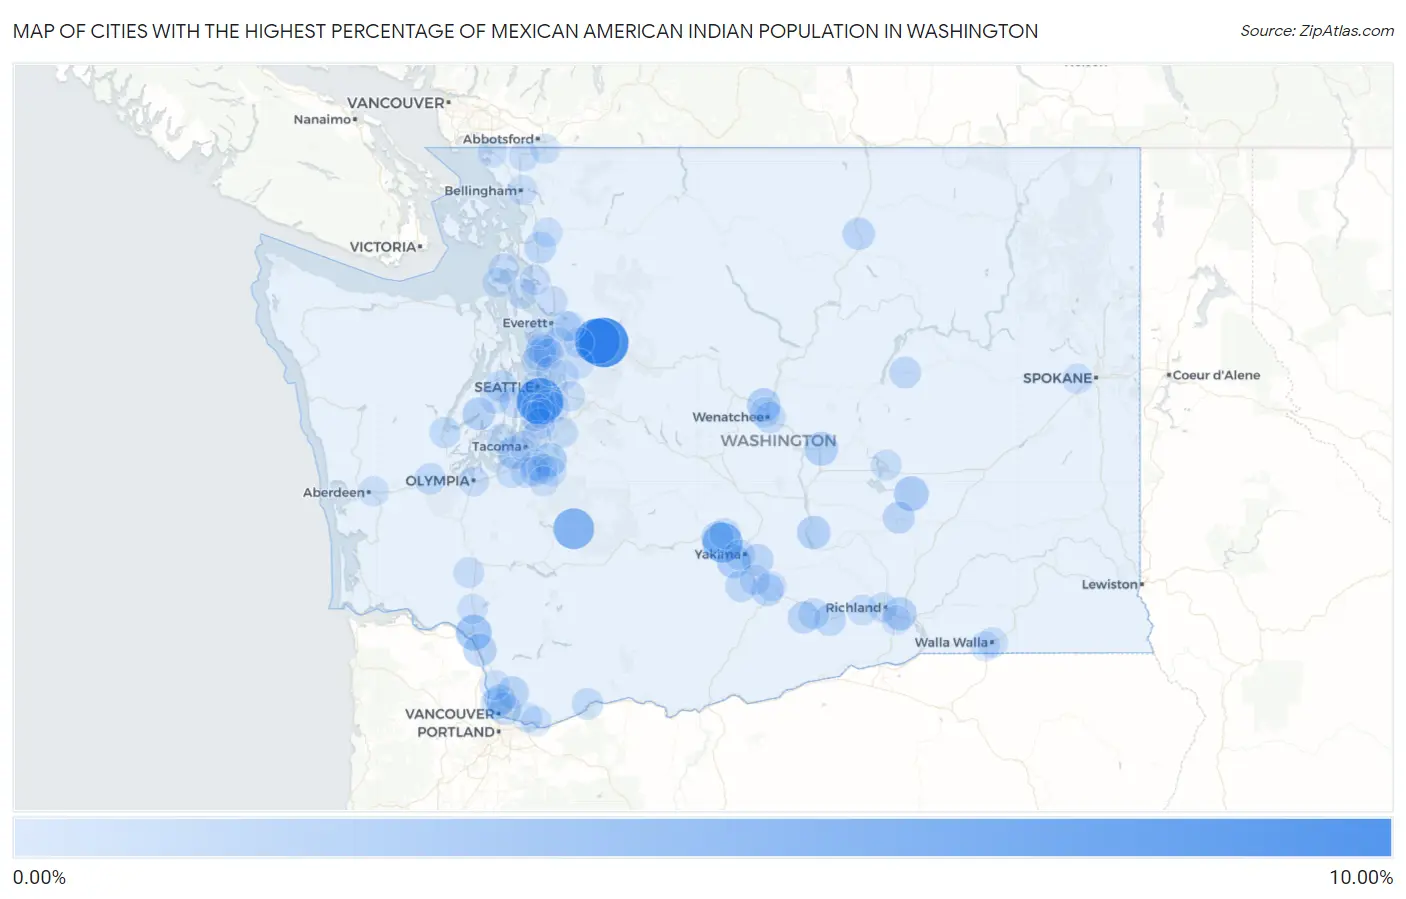
Map of Cities with the Highest Percentage of Mexican American Indian Population in Washington
0.00%
10.00%
Cities with the Highest Percentage of Mexican American Indian Population in Washington
| City | Mexican American Indian | vs State | vs National | |
| 1. | Startup | 9.83% | 0.20%(+9.63)#1 | 0.16%(+9.67)#22 |
| 2. | Boulevard Park | 8.21% | 0.20%(+8.01)#2 | 0.16%(+8.05)#29 |
| 3. | Sultan | 7.74% | 0.20%(+7.55)#3 | 0.16%(+7.59)#36 |
| 4. | Ashford | 5.33% | 0.20%(+5.14)#4 | 0.16%(+5.18)#58 |
| 5. | Cowiche | 4.94% | 0.20%(+4.75)#5 | 0.16%(+4.79)#71 |
| 6. | Kelso | 2.80% | 0.20%(+2.60)#6 | 0.16%(+2.64)#154 |
| 7. | Warden | 2.42% | 0.20%(+2.22)#7 | 0.16%(+2.26)#187 |
| 8. | Ahtanum | 2.00% | 0.20%(+1.80)#8 | 0.16%(+1.84)#241 |
| 9. | Alderton | 1.90% | 0.20%(+1.70)#9 | 0.16%(+1.74)#258 |
| 10. | Quincy | 1.90% | 0.20%(+1.70)#10 | 0.16%(+1.74)#259 |
| 11. | Sunnyslope | 1.75% | 0.20%(+1.55)#11 | 0.16%(+1.59)#287 |
| 12. | Mattawa | 1.71% | 0.20%(+1.51)#12 | 0.16%(+1.56)#296 |
| 13. | Pasco | 1.61% | 0.20%(+1.41)#13 | 0.16%(+1.45)#322 |
| 14. | Kalama | 1.56% | 0.20%(+1.36)#14 | 0.16%(+1.40)#337 |
| 15. | University Place | 1.42% | 0.20%(+1.22)#15 | 0.16%(+1.26)#380 |
| 16. | Belfair | 1.37% | 0.20%(+1.17)#16 | 0.16%(+1.21)#395 |
| 17. | Toppenish | 1.26% | 0.20%(+1.06)#17 | 0.16%(+1.10)#433 |
| 18. | Meadow Glade | 1.21% | 0.20%(+1.02)#18 | 0.16%(+1.06)#450 |
| 19. | Riverside | 1.18% | 0.20%(+0.983)#19 | 0.16%(+1.02)#466 |
| 20. | Minnehaha | 1.17% | 0.20%(+0.969)#20 | 0.16%(+1.01)#478 |
| 21. | Tieton | 1.16% | 0.20%(+0.968)#21 | 0.16%(+1.01)#479 |
| 22. | Mabton | 1.12% | 0.20%(+0.927)#22 | 0.16%(+0.967)#496 |
| 23. | Moxee | 1.02% | 0.20%(+0.824)#23 | 0.16%(+0.864)#556 |
| 24. | Othello | 1.01% | 0.20%(+0.817)#24 | 0.16%(+0.858)#560 |
| 25. | Hartline | 0.99% | 0.20%(+0.794)#25 | 0.16%(+0.834)#579 |
| 26. | Mountlake Terrace | 0.96% | 0.20%(+0.764)#26 | 0.16%(+0.804)#591 |
| 27. | Mount Vernon | 0.95% | 0.20%(+0.749)#27 | 0.16%(+0.789)#606 |
| 28. | Prosser | 0.94% | 0.20%(+0.749)#28 | 0.16%(+0.789)#607 |
| 29. | Harrah | 0.94% | 0.20%(+0.741)#29 | 0.16%(+0.781)#610 |
| 30. | Tracyton | 0.93% | 0.20%(+0.730)#30 | 0.16%(+0.770)#625 |
| 31. | Alderwood Manor | 0.90% | 0.20%(+0.706)#31 | 0.16%(+0.746)#634 |
| 32. | Tukwila | 0.79% | 0.20%(+0.592)#32 | 0.16%(+0.632)#717 |
| 33. | Lake Shore | 0.77% | 0.20%(+0.578)#33 | 0.16%(+0.618)#735 |
| 34. | Salmon Creek | 0.77% | 0.20%(+0.572)#34 | 0.16%(+0.612)#743 |
| 35. | Stevenson | 0.77% | 0.20%(+0.570)#35 | 0.16%(+0.610)#744 |
| 36. | East Wenatchee | 0.75% | 0.20%(+0.550)#36 | 0.16%(+0.590)#765 |
| 37. | Mccleary | 0.74% | 0.20%(+0.546)#37 | 0.16%(+0.586)#769 |
| 38. | Grandview | 0.62% | 0.20%(+0.426)#38 | 0.16%(+0.466)#901 |
| 39. | Skokomish | 0.62% | 0.20%(+0.425)#39 | 0.16%(+0.465)#904 |
| 40. | Naches | 0.61% | 0.20%(+0.418)#40 | 0.16%(+0.458)#915 |
| 41. | Bryn Mawr Skyway | 0.59% | 0.20%(+0.391)#41 | 0.16%(+0.432)#949 |
| 42. | Bunk Foss | 0.58% | 0.20%(+0.381)#42 | 0.16%(+0.421)#963 |
| 43. | Yakima | 0.54% | 0.20%(+0.347)#43 | 0.16%(+0.387)#1,003 |
| 44. | Summit View | 0.53% | 0.20%(+0.329)#44 | 0.16%(+0.370)#1,037 |
| 45. | Southworth | 0.51% | 0.20%(+0.316)#45 | 0.16%(+0.356)#1,058 |
| 46. | Winlock | 0.51% | 0.20%(+0.314)#46 | 0.16%(+0.355)#1,060 |
| 47. | Wapato | 0.48% | 0.20%(+0.282)#47 | 0.16%(+0.322)#1,123 |
| 48. | Lynnwood | 0.48% | 0.20%(+0.280)#48 | 0.16%(+0.320)#1,126 |
| 49. | Fort Lewis | 0.46% | 0.20%(+0.265)#49 | 0.16%(+0.305)#1,161 |
| 50. | Spanaway | 0.45% | 0.20%(+0.251)#50 | 0.16%(+0.291)#1,199 |
| 51. | Wenatchee | 0.42% | 0.20%(+0.228)#51 | 0.16%(+0.268)#1,239 |
| 52. | Oak Harbor | 0.40% | 0.20%(+0.204)#52 | 0.16%(+0.244)#1,276 |
| 53. | Renton | 0.40% | 0.20%(+0.203)#53 | 0.16%(+0.243)#1,279 |
| 54. | Moses Lake | 0.39% | 0.20%(+0.197)#54 | 0.16%(+0.237)#1,304 |
| 55. | Lake Morton Berrydale | 0.39% | 0.20%(+0.196)#55 | 0.16%(+0.236)#1,308 |
| 56. | Silver Firs | 0.39% | 0.20%(+0.191)#56 | 0.16%(+0.231)#1,321 |
| 57. | Benton City | 0.37% | 0.20%(+0.175)#57 | 0.16%(+0.215)#1,346 |
| 58. | Bothell West | 0.36% | 0.20%(+0.159)#58 | 0.16%(+0.199)#1,382 |
| 59. | Tacoma | 0.35% | 0.20%(+0.154)#59 | 0.16%(+0.194)#1,391 |
| 60. | Bremerton | 0.34% | 0.20%(+0.142)#60 | 0.16%(+0.183)#1,421 |
| 61. | Des Moines | 0.33% | 0.20%(+0.137)#61 | 0.16%(+0.177)#1,439 |
| 62. | Marysville | 0.31% | 0.20%(+0.116)#62 | 0.16%(+0.156)#1,495 |
| 63. | Camano | 0.31% | 0.20%(+0.115)#63 | 0.16%(+0.156)#1,496 |
| 64. | Stanwood | 0.30% | 0.20%(+0.102)#64 | 0.16%(+0.142)#1,527 |
| 65. | Monroe | 0.29% | 0.20%(+0.094)#65 | 0.16%(+0.134)#1,541 |
| 66. | Frederickson | 0.27% | 0.20%(+0.070)#66 | 0.16%(+0.111)#1,624 |
| 67. | Olympia | 0.26% | 0.20%(+0.065)#67 | 0.16%(+0.105)#1,641 |
| 68. | Airway Heights | 0.25% | 0.20%(+0.050)#68 | 0.16%(+0.090)#1,690 |
| 69. | Mukilteo | 0.24% | 0.20%(+0.047)#69 | 0.16%(+0.087)#1,701 |
| 70. | Walla Walla | 0.22% | 0.20%(+0.022)#70 | 0.16%(+0.062)#1,796 |
| 71. | Shoreline | 0.21% | 0.20%(+0.017)#71 | 0.16%(+0.057)#1,817 |
| 72. | Duvall | 0.21% | 0.20%(+0.013)#72 | 0.16%(+0.053)#1,830 |
| 73. | Lynden | 0.20% | 0.20%(+0.007)#73 | 0.16%(+0.047)#1,861 |
| 74. | Seattle | 0.20% | 0.20%(+0.007)#74 | 0.16%(+0.047)#1,865 |
| 75. | Orting | 0.20% | 0.20%(+0.006)#75 | 0.16%(+0.046)#1,868 |
| 76. | Artondale | 0.20% | 0.20%(+0.006)#76 | 0.16%(+0.046)#1,871 |
| 77. | Castle Rock | 0.19% | 0.20%(-0.006)#77 | 0.16%(+0.034)#1,920 |
| 78. | Federal Way | 0.19% | 0.20%(-0.008)#78 | 0.16%(+0.033)#1,936 |
| 79. | Aberdeen | 0.19% | 0.20%(-0.008)#79 | 0.16%(+0.032)#1,937 |
| 80. | Kirkland | 0.18% | 0.20%(-0.015)#80 | 0.16%(+0.025)#1,973 |
| 81. | Everett | 0.17% | 0.20%(-0.027)#81 | 0.16%(+0.013)#2,033 |
| 82. | Burien | 0.16% | 0.20%(-0.033)#82 | 0.16%(+0.007)#2,069 |
| 83. | Redmond | 0.16% | 0.20%(-0.034)#83 | 0.16%(+0.007)#2,072 |
| 84. | South Hill | 0.16% | 0.20%(-0.036)#84 | 0.16%(+0.004)#2,081 |
| 85. | Zillah | 0.16% | 0.20%(-0.038)#85 | 0.16%(+0.002)#2,097 |
| 86. | Ridgefield | 0.16% | 0.20%(-0.040)#86 | 0.16%(+0.000)#2,102 |
| 87. | Washougal | 0.15% | 0.20%(-0.048)#87 | 0.16%(-0.008)#2,151 |
| 88. | Coupeville | 0.15% | 0.20%(-0.049)#88 | 0.16%(-0.009)#2,158 |
| 89. | Issaquah | 0.14% | 0.20%(-0.052)#89 | 0.16%(-0.012)#2,170 |
| 90. | Sumas | 0.14% | 0.20%(-0.053)#90 | 0.16%(-0.013)#2,177 |
| 91. | Richland | 0.14% | 0.20%(-0.055)#91 | 0.16%(-0.015)#2,188 |
| 92. | Kennewick | 0.14% | 0.20%(-0.057)#92 | 0.16%(-0.017)#2,196 |
| 93. | Bellingham | 0.14% | 0.20%(-0.057)#93 | 0.16%(-0.017)#2,200 |
| 94. | Sedro Woolley | 0.14% | 0.20%(-0.060)#94 | 0.16%(-0.020)#2,217 |
| 95. | Graham | 0.14% | 0.20%(-0.061)#95 | 0.16%(-0.021)#2,221 |
| 96. | College Place | 0.13% | 0.20%(-0.064)#96 | 0.16%(-0.024)#2,230 |
| 97. | Camas | 0.13% | 0.20%(-0.064)#97 | 0.16%(-0.024)#2,231 |
| 98. | Normandy Park | 0.12% | 0.20%(-0.077)#98 | 0.16%(-0.037)#2,302 |
| 99. | Blaine | 0.12% | 0.20%(-0.077)#99 | 0.16%(-0.037)#2,303 |
| 100. | Seatac | 0.12% | 0.20%(-0.080)#100 | 0.16%(-0.040)#2,316 |
Common Questions
What are the Top 10 Cities with the Highest Percentage of Mexican American Indian Population in Washington?
Top 10 Cities with the Highest Percentage of Mexican American Indian Population in Washington are:
What city has the Highest Percentage of Mexican American Indian Population in Washington?
Startup has the Highest Percentage of Mexican American Indian Population in Washington with 9.83%.
What is the Percentage of Mexican American Indian Population in the State of Washington?
Percentage of Mexican American Indian Population in Washington is 0.20%.
What is the Percentage of Mexican American Indian Population in the United States?
Percentage of Mexican American Indian Population in the United States is 0.16%.