Cities with the Highest Percentage of Japanese Population in Washington
RELATED REPORTS & OPTIONS
Japanese
Washington
Compare Cities
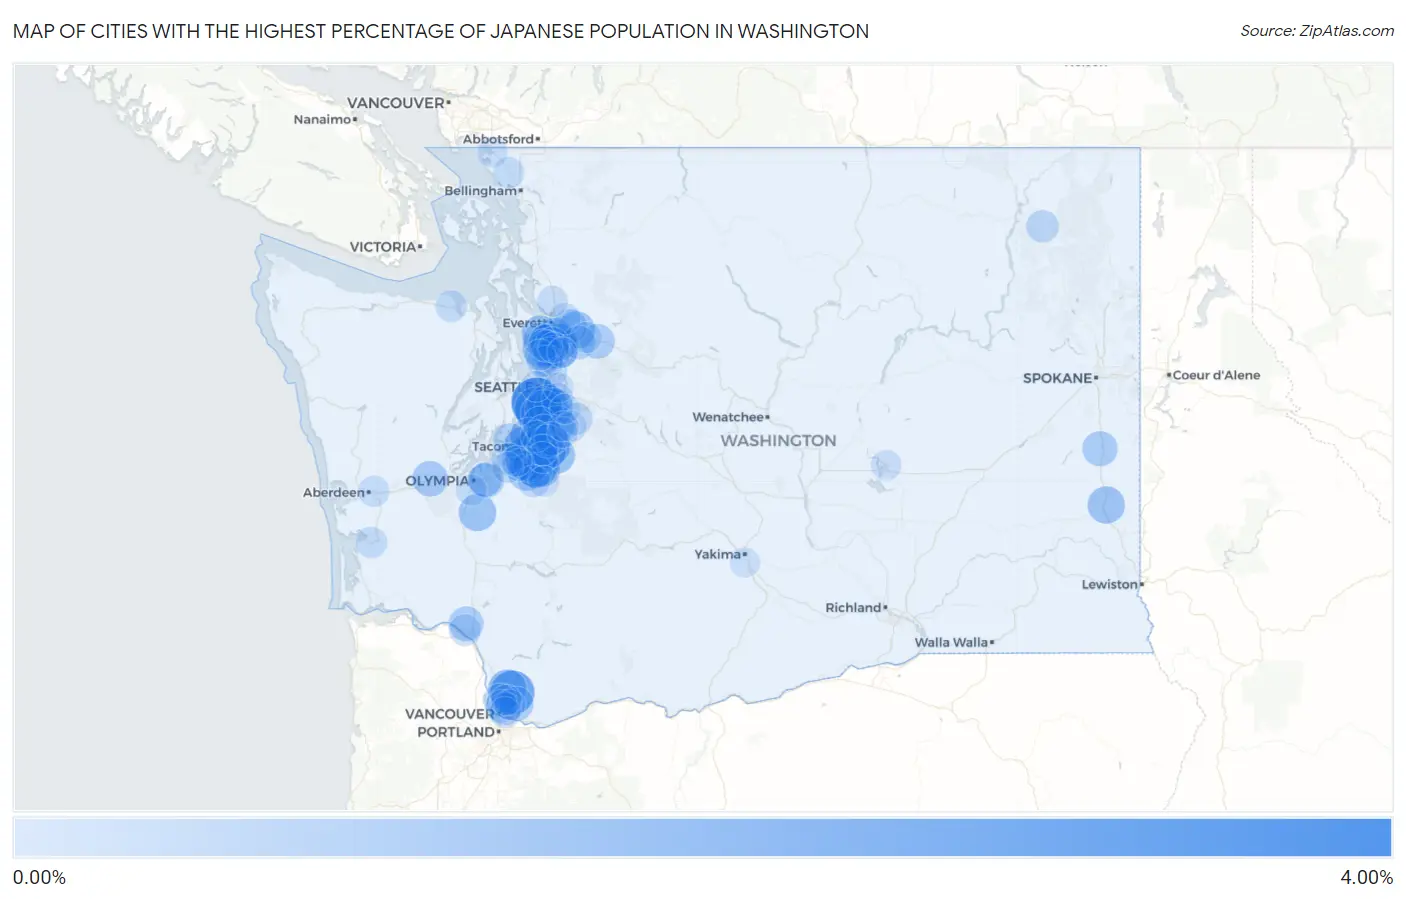
Map of Cities with the Highest Percentage of Japanese Population in Washington
0.00%
4.00%
Cities with the Highest Percentage of Japanese Population in Washington
| City | Japanese | vs State | vs National | |
| 1. | White Center | 3.62% | 0.37%(+3.25)#1 | 0.11%(+3.51)#44 |
| 2. | Pacific | 2.76% | 0.37%(+2.40)#2 | 0.11%(+2.66)#64 |
| 3. | Meadow Glade | 2.59% | 0.37%(+2.23)#3 | 0.11%(+2.49)#68 |
| 4. | Summit View | 2.58% | 0.37%(+2.22)#4 | 0.11%(+2.48)#69 |
| 5. | Midland | 2.52% | 0.37%(+2.16)#5 | 0.11%(+2.42)#71 |
| 6. | Burien | 2.48% | 0.37%(+2.11)#6 | 0.11%(+2.37)#74 |
| 7. | Fife | 2.42% | 0.37%(+2.06)#7 | 0.11%(+2.32)#75 |
| 8. | Martha Lake | 2.26% | 0.37%(+1.89)#8 | 0.11%(+2.15)#82 |
| 9. | Waller | 2.15% | 0.37%(+1.79)#9 | 0.11%(+2.05)#86 |
| 10. | Seatac | 2.03% | 0.37%(+1.66)#10 | 0.11%(+1.92)#94 |
| 11. | Bryn Mawr Skyway | 1.92% | 0.37%(+1.56)#11 | 0.11%(+1.82)#98 |
| 12. | Tacoma | 1.73% | 0.37%(+1.36)#12 | 0.11%(+1.62)#111 |
| 13. | Clearview | 1.73% | 0.37%(+1.36)#13 | 0.11%(+1.62)#112 |
| 14. | Renton | 1.61% | 0.37%(+1.24)#14 | 0.11%(+1.50)#126 |
| 15. | Fife Heights | 1.59% | 0.37%(+1.22)#15 | 0.11%(+1.48)#127 |
| 16. | Dollars Corner | 1.58% | 0.37%(+1.21)#16 | 0.11%(+1.47)#128 |
| 17. | Lynnwood | 1.46% | 0.37%(+1.10)#17 | 0.11%(+1.36)#145 |
| 18. | Bonney Lake | 1.45% | 0.37%(+1.09)#18 | 0.11%(+1.35)#147 |
| 19. | Tukwila | 1.44% | 0.37%(+1.07)#19 | 0.11%(+1.33)#150 |
| 20. | Three Lakes | 1.43% | 0.37%(+1.06)#20 | 0.11%(+1.32)#151 |
| 21. | Tenino | 1.42% | 0.37%(+1.05)#21 | 0.11%(+1.31)#152 |
| 22. | Dash Point | 1.41% | 0.37%(+1.04)#22 | 0.11%(+1.30)#155 |
| 23. | Colfax | 1.39% | 0.37%(+1.03)#23 | 0.11%(+1.29)#158 |
| 24. | Silver Firs | 1.37% | 0.37%(+1.01)#24 | 0.11%(+1.27)#162 |
| 25. | Lakeland South | 1.32% | 0.37%(+0.951)#25 | 0.11%(+1.21)#172 |
| 26. | Eastmont | 1.28% | 0.37%(+0.916)#26 | 0.11%(+1.18)#182 |
| 27. | Mukilteo | 1.25% | 0.37%(+0.889)#27 | 0.11%(+1.15)#189 |
| 28. | Milton | 1.24% | 0.37%(+0.875)#28 | 0.11%(+1.13)#192 |
| 29. | Spanaway | 1.21% | 0.37%(+0.846)#29 | 0.11%(+1.10)#195 |
| 30. | Kent | 1.16% | 0.37%(+0.794)#30 | 0.11%(+1.05)#206 |
| 31. | South Hill | 1.15% | 0.37%(+0.781)#31 | 0.11%(+1.04)#208 |
| 32. | Tanglewilde | 1.11% | 0.37%(+0.742)#32 | 0.11%(+1.00)#214 |
| 33. | Mccleary | 1.07% | 0.37%(+0.706)#33 | 0.11%(+0.965)#227 |
| 34. | Rosalia | 1.00% | 0.37%(+0.636)#34 | 0.11%(+0.895)#247 |
| 35. | Clover Creek | 0.98% | 0.37%(+0.613)#35 | 0.11%(+0.873)#254 |
| 36. | Longview Heights | 0.95% | 0.37%(+0.587)#36 | 0.11%(+0.846)#259 |
| 37. | Parkland | 0.94% | 0.37%(+0.576)#37 | 0.11%(+0.835)#264 |
| 38. | Sumner | 0.93% | 0.37%(+0.569)#38 | 0.11%(+0.829)#266 |
| 39. | Sultan | 0.93% | 0.37%(+0.568)#39 | 0.11%(+0.827)#267 |
| 40. | Des Moines | 0.93% | 0.37%(+0.568)#40 | 0.11%(+0.827)#268 |
| 41. | Orchards | 0.91% | 0.37%(+0.541)#41 | 0.11%(+0.801)#277 |
| 42. | Everett | 0.87% | 0.37%(+0.499)#42 | 0.11%(+0.759)#290 |
| 43. | Picnic Point | 0.84% | 0.37%(+0.478)#43 | 0.11%(+0.738)#300 |
| 44. | Frederickson | 0.83% | 0.37%(+0.463)#44 | 0.11%(+0.722)#307 |
| 45. | Lake Stickney | 0.79% | 0.37%(+0.425)#45 | 0.11%(+0.685)#318 |
| 46. | Monroe | 0.76% | 0.37%(+0.393)#46 | 0.11%(+0.653)#337 |
| 47. | Lakeland North | 0.75% | 0.37%(+0.383)#47 | 0.11%(+0.642)#342 |
| 48. | Fairwood Cdp King County | 0.74% | 0.37%(+0.370)#48 | 0.11%(+0.630)#349 |
| 49. | Auburn | 0.73% | 0.37%(+0.369)#49 | 0.11%(+0.628)#352 |
| 50. | Lacey | 0.73% | 0.37%(+0.365)#50 | 0.11%(+0.624)#353 |
| 51. | Wollochet | 0.71% | 0.37%(+0.349)#51 | 0.11%(+0.608)#361 |
| 52. | Mill Creek | 0.69% | 0.37%(+0.327)#52 | 0.11%(+0.586)#369 |
| 53. | Bothell East | 0.69% | 0.37%(+0.323)#53 | 0.11%(+0.582)#373 |
| 54. | Algona | 0.67% | 0.37%(+0.308)#54 | 0.11%(+0.568)#377 |
| 55. | Salmon Creek | 0.61% | 0.37%(+0.245)#55 | 0.11%(+0.504)#418 |
| 56. | Minnehaha | 0.55% | 0.37%(+0.187)#56 | 0.11%(+0.446)#446 |
| 57. | Colville | 0.55% | 0.37%(+0.182)#57 | 0.11%(+0.442)#448 |
| 58. | Hobart | 0.53% | 0.37%(+0.165)#58 | 0.11%(+0.425)#464 |
| 59. | Hazel Dell | 0.52% | 0.37%(+0.158)#59 | 0.11%(+0.418)#472 |
| 60. | Mcchord Afb | 0.48% | 0.37%(+0.117)#60 | 0.11%(+0.377)#499 |
| 61. | Bothell West | 0.48% | 0.37%(+0.117)#61 | 0.11%(+0.376)#500 |
| 62. | Kirkland | 0.47% | 0.37%(+0.108)#62 | 0.11%(+0.368)#505 |
| 63. | Elk Plain | 0.47% | 0.37%(+0.105)#63 | 0.11%(+0.365)#507 |
| 64. | Longview | 0.46% | 0.37%(+0.090)#64 | 0.11%(+0.350)#520 |
| 65. | Kenmore | 0.44% | 0.37%(+0.071)#65 | 0.11%(+0.330)#540 |
| 66. | Steilacoom | 0.43% | 0.37%(+0.068)#66 | 0.11%(+0.328)#542 |
| 67. | Newcastle | 0.42% | 0.37%(+0.052)#67 | 0.11%(+0.311)#562 |
| 68. | Lake Forest Park | 0.42% | 0.37%(+0.050)#68 | 0.11%(+0.310)#566 |
| 69. | Larch Way | 0.39% | 0.37%(+0.021)#69 | 0.11%(+0.280)#602 |
| 70. | Sequim | 0.38% | 0.37%(+0.018)#70 | 0.11%(+0.278)#606 |
| 71. | North Lynnwood | 0.38% | 0.37%(+0.018)#71 | 0.11%(+0.277)#607 |
| 72. | South Bend | 0.38% | 0.37%(+0.011)#72 | 0.11%(+0.270)#617 |
| 73. | Suncrest | 0.37% | 0.37%(+0.009)#73 | 0.11%(+0.268)#621 |
| 74. | Federal Way | 0.37% | 0.37%(+0.006)#74 | 0.11%(+0.265)#628 |
| 75. | Lake Stevens | 0.35% | 0.37%(-0.015)#75 | 0.11%(+0.244)#659 |
| 76. | Woods Creek | 0.33% | 0.37%(-0.039)#76 | 0.11%(+0.220)#690 |
| 77. | Puyallup | 0.33% | 0.37%(-0.039)#77 | 0.11%(+0.220)#691 |
| 78. | Ferndale | 0.32% | 0.37%(-0.048)#78 | 0.11%(+0.211)#703 |
| 79. | North Fort Lewis | 0.32% | 0.37%(-0.050)#79 | 0.11%(+0.209)#705 |
| 80. | Vancouver | 0.32% | 0.37%(-0.051)#80 | 0.11%(+0.209)#706 |
| 81. | Mountlake Terrace | 0.31% | 0.37%(-0.052)#81 | 0.11%(+0.208)#710 |
| 82. | Aberdeen | 0.30% | 0.37%(-0.065)#82 | 0.11%(+0.194)#734 |
| 83. | Edgewood | 0.30% | 0.37%(-0.067)#83 | 0.11%(+0.192)#742 |
| 84. | Tumwater | 0.30% | 0.37%(-0.069)#84 | 0.11%(+0.190)#745 |
| 85. | Maple Valley | 0.29% | 0.37%(-0.075)#85 | 0.11%(+0.184)#757 |
| 86. | Seattle | 0.27% | 0.37%(-0.095)#86 | 0.11%(+0.164)#804 |
| 87. | Lake Morton Berrydale | 0.27% | 0.37%(-0.098)#87 | 0.11%(+0.161)#809 |
| 88. | Marysville | 0.26% | 0.37%(-0.103)#88 | 0.11%(+0.156)#822 |
| 89. | Graham | 0.25% | 0.37%(-0.118)#89 | 0.11%(+0.141)#854 |
| 90. | Blaine | 0.24% | 0.37%(-0.127)#90 | 0.11%(+0.132)#872 |
| 91. | Lakewood | 0.23% | 0.37%(-0.131)#91 | 0.11%(+0.128)#880 |
| 92. | Five Corners | 0.23% | 0.37%(-0.131)#92 | 0.11%(+0.128)#881 |
| 93. | Barberton | 0.21% | 0.37%(-0.152)#93 | 0.11%(+0.108)#933 |
| 94. | Moses Lake | 0.21% | 0.37%(-0.155)#94 | 0.11%(+0.104)#941 |
| 95. | Mill Creek East | 0.20% | 0.37%(-0.164)#95 | 0.11%(+0.095)#964 |
| 96. | Covington | 0.17% | 0.37%(-0.198)#96 | 0.11%(+0.062)#1,042 |
| 97. | Maltby | 0.17% | 0.37%(-0.198)#97 | 0.11%(+0.061)#1,046 |
| 98. | Bellevue | 0.16% | 0.37%(-0.208)#98 | 0.11%(+0.051)#1,079 |
| 99. | East Renton Highlands | 0.16% | 0.37%(-0.208)#99 | 0.11%(+0.051)#1,080 |
| 100. | Union Gap | 0.15% | 0.37%(-0.212)#100 | 0.11%(+0.047)#1,087 |
Common Questions
What are the Top 10 Cities with the Highest Percentage of Japanese Population in Washington?
Top 10 Cities with the Highest Percentage of Japanese Population in Washington are:
#1
3.62%
#2
2.76%
#3
2.59%
#4
2.58%
#5
2.52%
#6
2.48%
#7
2.42%
#8
2.26%
#9
2.15%
#10
2.03%
What city has the Highest Percentage of Japanese Population in Washington?
White Center has the Highest Percentage of Japanese Population in Washington with 3.62%.
What is the Percentage of Japanese Population in the State of Washington?
Percentage of Japanese Population in Washington is 0.37%.
What is the Percentage of Japanese Population in the United States?
Percentage of Japanese Population in the United States is 0.11%.