Cities with the Highest Percentage of Population Walking to Work in Washington
RELATED REPORTS & OPTIONS
Walk to Work
Washington
Compare Cities
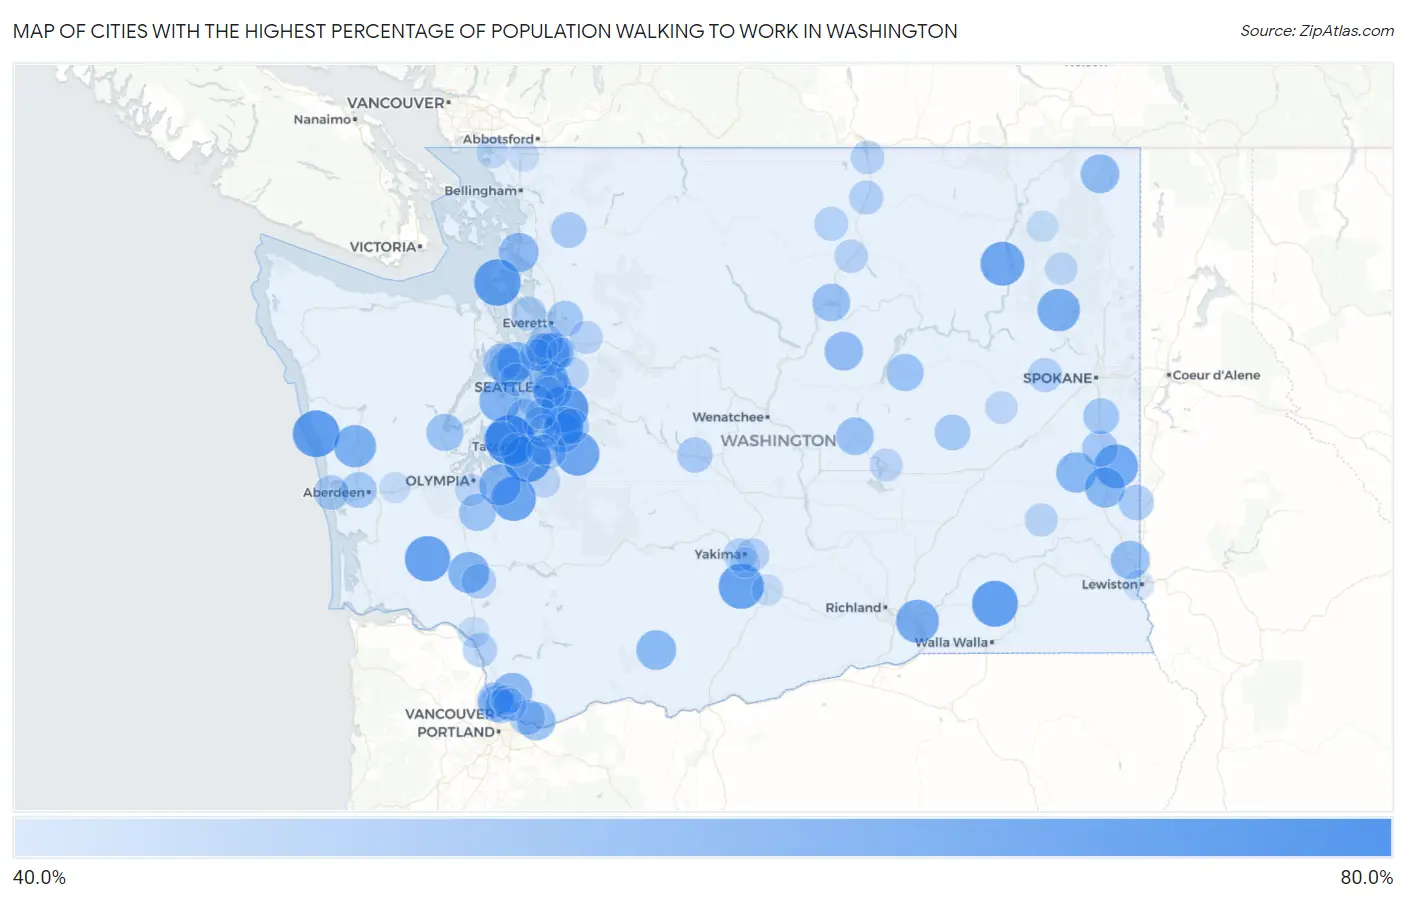
Map of Cities with the Highest Percentage of Population Walking to Work in Washington
0.0%
80.0%
Cities with the Highest Percentage of Population Walking to Work in Washington
| City | % Walk to Work | vs State | vs National | |
| 1. | Wollochet | 76.9% | 31.9%(+45.0)#1 | 33.4%(+43.5)#29 |
| 2. | Midland | 72.5% | 31.9%(+40.6)#2 | 33.4%(+39.1)#67 |
| 3. | Taholah | 72.1% | 31.9%(+40.2)#3 | 33.4%(+38.7)#73 |
| 4. | East Renton Highlands | 72.0% | 31.9%(+40.1)#4 | 33.4%(+38.6)#75 |
| 5. | Coupeville | 71.6% | 31.9%(+39.7)#5 | 33.4%(+38.2)#78 |
| 6. | Prescott | 70.5% | 31.9%(+38.6)#6 | 33.4%(+37.1)#105 |
| 7. | Pe Ell | 69.5% | 31.9%(+37.6)#7 | 33.4%(+36.1)#122 |
| 8. | Harrah | 69.3% | 31.9%(+37.4)#8 | 33.4%(+35.9)#134 |
| 9. | Mckenna | 67.9% | 31.9%(+36.0)#9 | 33.4%(+34.5)#189 |
| 10. | Enumclaw | 67.2% | 31.9%(+35.3)#10 | 33.4%(+33.8)#224 |
| 11. | Inchelium | 67.2% | 31.9%(+35.3)#11 | 33.4%(+33.8)#230 |
| 12. | Tehaleh | 66.7% | 31.9%(+34.8)#12 | 33.4%(+33.3)#239 |
| 13. | Oakesdale | 66.5% | 31.9%(+34.6)#13 | 33.4%(+33.1)#253 |
| 14. | Burbank | 65.3% | 31.9%(+33.4)#14 | 33.4%(+31.9)#326 |
| 15. | Roche Harbor | 64.8% | 31.9%(+32.9)#15 | 33.4%(+31.4)#362 |
| 16. | Springdale | 64.5% | 31.9%(+32.6)#16 | 33.4%(+31.1)#379 |
| 17. | Humptulips | 64.1% | 31.9%(+32.2)#17 | 33.4%(+30.7)#414 |
| 18. | Bothell West | 63.2% | 31.9%(+31.3)#18 | 33.4%(+29.8)#483 |
| 19. | Nisqually Indian Community | 62.5% | 31.9%(+30.6)#19 | 33.4%(+29.1)#548 |
| 20. | Port Orchard | 62.4% | 31.9%(+30.5)#20 | 33.4%(+29.0)#556 |
| 21. | Winlock | 62.1% | 31.9%(+30.2)#21 | 33.4%(+28.7)#606 |
| 22. | St John | 60.5% | 31.9%(+28.6)#22 | 33.4%(+27.1)#786 |
| 23. | Steptoe | 60.5% | 31.9%(+28.6)#23 | 33.4%(+27.1)#795 |
| 24. | Lake Morton Berrydale | 60.4% | 31.9%(+28.5)#24 | 33.4%(+27.0)#799 |
| 25. | Glenwood | 60.1% | 31.9%(+28.2)#25 | 33.4%(+26.7)#866 |
| 26. | Meadow Glade | 59.5% | 31.9%(+27.6)#26 | 33.4%(+26.1)#914 |
| 27. | Beaux Arts Village | 59.5% | 31.9%(+27.6)#27 | 33.4%(+26.1)#929 |
| 28. | La Conner | 59.3% | 31.9%(+27.4)#28 | 33.4%(+25.9)#958 |
| 29. | Bothell East | 59.2% | 31.9%(+27.3)#29 | 33.4%(+25.8)#973 |
| 30. | Suquamish | 59.0% | 31.9%(+27.1)#30 | 33.4%(+25.6)#1,015 |
| 31. | Covington | 58.8% | 31.9%(+26.9)#31 | 33.4%(+25.4)#1,025 |
| 32. | Hunts Point | 58.8% | 31.9%(+26.9)#32 | 33.4%(+25.4)#1,035 |
| 33. | Indianola | 58.5% | 31.9%(+26.6)#33 | 33.4%(+25.1)#1,071 |
| 34. | Metaline | 58.3% | 31.9%(+26.4)#34 | 33.4%(+24.9)#1,133 |
| 35. | Mansfield | 57.8% | 31.9%(+25.9)#35 | 33.4%(+24.4)#1,185 |
| 36. | Colton | 57.4% | 31.9%(+25.5)#36 | 33.4%(+24.0)#1,255 |
| 37. | Washougal | 57.2% | 31.9%(+25.3)#37 | 33.4%(+23.8)#1,283 |
| 38. | Poulsbo | 57.0% | 31.9%(+25.1)#38 | 33.4%(+23.6)#1,320 |
| 39. | Brewster | 56.4% | 31.9%(+24.5)#39 | 33.4%(+23.0)#1,428 |
| 40. | Ephrata | 56.2% | 31.9%(+24.3)#40 | 33.4%(+22.8)#1,468 |
| 41. | Skokomish | 55.5% | 31.9%(+23.6)#41 | 33.4%(+22.1)#1,569 |
| 42. | Hartline | 55.5% | 31.9%(+23.6)#42 | 33.4%(+22.1)#1,583 |
| 43. | Vashon | 55.3% | 31.9%(+23.4)#43 | 33.4%(+21.9)#1,612 |
| 44. | Tenino | 55.0% | 31.9%(+23.1)#44 | 33.4%(+21.6)#1,682 |
| 45. | Lake Shore | 53.9% | 31.9%(+22.0)#45 | 33.4%(+20.5)#1,854 |
| 46. | Rosalia | 53.5% | 31.9%(+21.6)#46 | 33.4%(+20.1)#1,936 |
| 47. | Spangle | 53.4% | 31.9%(+21.5)#47 | 33.4%(+20.0)#1,960 |
| 48. | Lake Stevens | 53.1% | 31.9%(+21.2)#48 | 33.4%(+19.7)#2,005 |
| 49. | Hoquiam | 53.0% | 31.9%(+21.1)#49 | 33.4%(+19.6)#2,025 |
| 50. | Maple Valley | 52.8% | 31.9%(+20.9)#50 | 33.4%(+19.4)#2,056 |
| 51. | Odessa | 52.8% | 31.9%(+20.9)#51 | 33.4%(+19.4)#2,066 |
| 52. | Felida | 52.7% | 31.9%(+20.8)#52 | 33.4%(+19.3)#2,079 |
| 53. | Artondale | 52.5% | 31.9%(+20.6)#53 | 33.4%(+19.1)#2,106 |
| 54. | Cle Elum | 52.5% | 31.9%(+20.6)#54 | 33.4%(+19.1)#2,117 |
| 55. | Lyman | 52.5% | 31.9%(+20.6)#55 | 33.4%(+19.1)#2,137 |
| 56. | Palouse | 52.3% | 31.9%(+20.4)#56 | 33.4%(+18.9)#2,177 |
| 57. | Camas | 52.2% | 31.9%(+20.3)#57 | 33.4%(+18.8)#2,189 |
| 58. | Sumner | 52.2% | 31.9%(+20.3)#58 | 33.4%(+18.8)#2,193 |
| 59. | Ocean Shores | 51.2% | 31.9%(+19.3)#59 | 33.4%(+17.8)#2,367 |
| 60. | Toledo | 51.1% | 31.9%(+19.2)#60 | 33.4%(+17.7)#2,393 |
| 61. | White Center | 51.0% | 31.9%(+19.1)#61 | 33.4%(+17.6)#2,398 |
| 62. | Langley | 50.7% | 31.9%(+18.8)#62 | 33.4%(+17.3)#2,457 |
| 63. | Lake Stickney | 50.5% | 31.9%(+18.6)#63 | 33.4%(+17.1)#2,485 |
| 64. | Hazel Dell | 50.4% | 31.9%(+18.5)#64 | 33.4%(+17.0)#2,514 |
| 65. | Kalama | 50.4% | 31.9%(+18.5)#65 | 33.4%(+17.0)#2,526 |
| 66. | Reardan | 50.3% | 31.9%(+18.4)#66 | 33.4%(+16.9)#2,554 |
| 67. | Tonasket | 50.2% | 31.9%(+18.3)#67 | 33.4%(+16.8)#2,575 |
| 68. | Conconully | 49.8% | 31.9%(+17.9)#68 | 33.4%(+16.4)#2,647 |
| 69. | Des Moines | 49.6% | 31.9%(+17.7)#69 | 33.4%(+16.2)#2,665 |
| 70. | Fircrest | 49.3% | 31.9%(+17.4)#70 | 33.4%(+15.9)#2,744 |
| 71. | Oroville | 49.2% | 31.9%(+17.3)#71 | 33.4%(+15.8)#2,772 |
| 72. | Okanogan | 49.1% | 31.9%(+17.2)#72 | 33.4%(+15.7)#2,787 |
| 73. | Yakima | 48.8% | 31.9%(+16.9)#73 | 33.4%(+15.4)#2,828 |
| 74. | Terrace Heights | 48.8% | 31.9%(+16.9)#74 | 33.4%(+15.4)#2,834 |
| 75. | Five Corners | 48.6% | 31.9%(+16.7)#75 | 33.4%(+15.2)#2,854 |
| 76. | Lacrosse | 48.6% | 31.9%(+16.7)#76 | 33.4%(+15.2)#2,870 |
| 77. | Woods Creek | 48.5% | 31.9%(+16.6)#77 | 33.4%(+15.1)#2,877 |
| 78. | Moses Lake | 48.2% | 31.9%(+16.3)#78 | 33.4%(+14.8)#2,956 |
| 79. | Lakeland North | 48.2% | 31.9%(+16.3)#79 | 33.4%(+14.8)#2,960 |
| 80. | Graham | 48.1% | 31.9%(+16.2)#80 | 33.4%(+14.7)#2,975 |
| 81. | Union Hill Novelty Hill | 47.9% | 31.9%(+16.0)#81 | 33.4%(+14.5)#3,015 |
| 82. | Bainbridge Island | 47.7% | 31.9%(+15.8)#82 | 33.4%(+14.3)#3,040 |
| 83. | Esperance | 47.5% | 31.9%(+15.6)#83 | 33.4%(+14.1)#3,076 |
| 84. | Tumwater | 47.4% | 31.9%(+15.5)#84 | 33.4%(+14.0)#3,103 |
| 85. | Chewelah | 47.4% | 31.9%(+15.5)#85 | 33.4%(+14.0)#3,115 |
| 86. | Harrington | 47.3% | 31.9%(+15.4)#86 | 33.4%(+13.9)#3,142 |
| 87. | Lynnwood | 46.8% | 31.9%(+14.9)#87 | 33.4%(+13.4)#3,212 |
| 88. | Blaine | 46.4% | 31.9%(+14.5)#88 | 33.4%(+13.0)#3,286 |
| 89. | Colville | 45.7% | 31.9%(+13.8)#89 | 33.4%(+12.3)#3,416 |
| 90. | Mercer Island | 45.6% | 31.9%(+13.7)#90 | 33.4%(+12.2)#3,424 |
| 91. | Kelso | 45.5% | 31.9%(+13.6)#91 | 33.4%(+12.1)#3,451 |
| 92. | Toppenish | 45.5% | 31.9%(+13.6)#92 | 33.4%(+12.1)#3,452 |
| 93. | Montesano | 45.4% | 31.9%(+13.5)#93 | 33.4%(+12.0)#3,502 |
| 94. | Edgewood | 45.1% | 31.9%(+13.2)#94 | 33.4%(+11.7)#3,561 |
| 95. | Seatac | 44.9% | 31.9%(+13.0)#95 | 33.4%(+11.5)#3,593 |
| 96. | Lynden | 44.8% | 31.9%(+12.9)#96 | 33.4%(+11.4)#3,615 |
| 97. | Clarkston | 44.7% | 31.9%(+12.8)#97 | 33.4%(+11.3)#3,632 |
| 98. | Union Gap | 44.7% | 31.9%(+12.8)#98 | 33.4%(+11.3)#3,633 |
| 99. | Barberton | 44.3% | 31.9%(+12.4)#99 | 33.4%(+10.9)#3,723 |
| 100. | Maltby | 43.5% | 31.9%(+11.6)#100 | 33.4%(+10.1)#3,870 |
Common Questions
What are the Top 10 Cities with the Highest Percentage of Population Walking to Work in Washington?
Top 10 Cities with the Highest Percentage of Population Walking to Work in Washington are:
#1
76.9%
#2
72.5%
#3
72.1%
#4
72.0%
#5
71.6%
#6
70.5%
#7
69.5%
#8
69.3%
#9
67.9%
#10
67.2%
What city has the Highest Percentage of Population Walking to Work in Washington?
Wollochet has the Highest Percentage of Population Walking to Work in Washington with 76.9%.
What is the Percentage of Population Walking to Work in the State of Washington?
Percentage of Population Walking to Work in Washington is 31.9%.
What is the Percentage of Population Walking to Work in the United States?
Percentage of Population Walking to Work in the United States is 33.4%.