Cities with the Highest Percentage of Immigrants from South America in Washington
RELATED REPORTS & OPTIONS
South America
Washington
Compare Cities
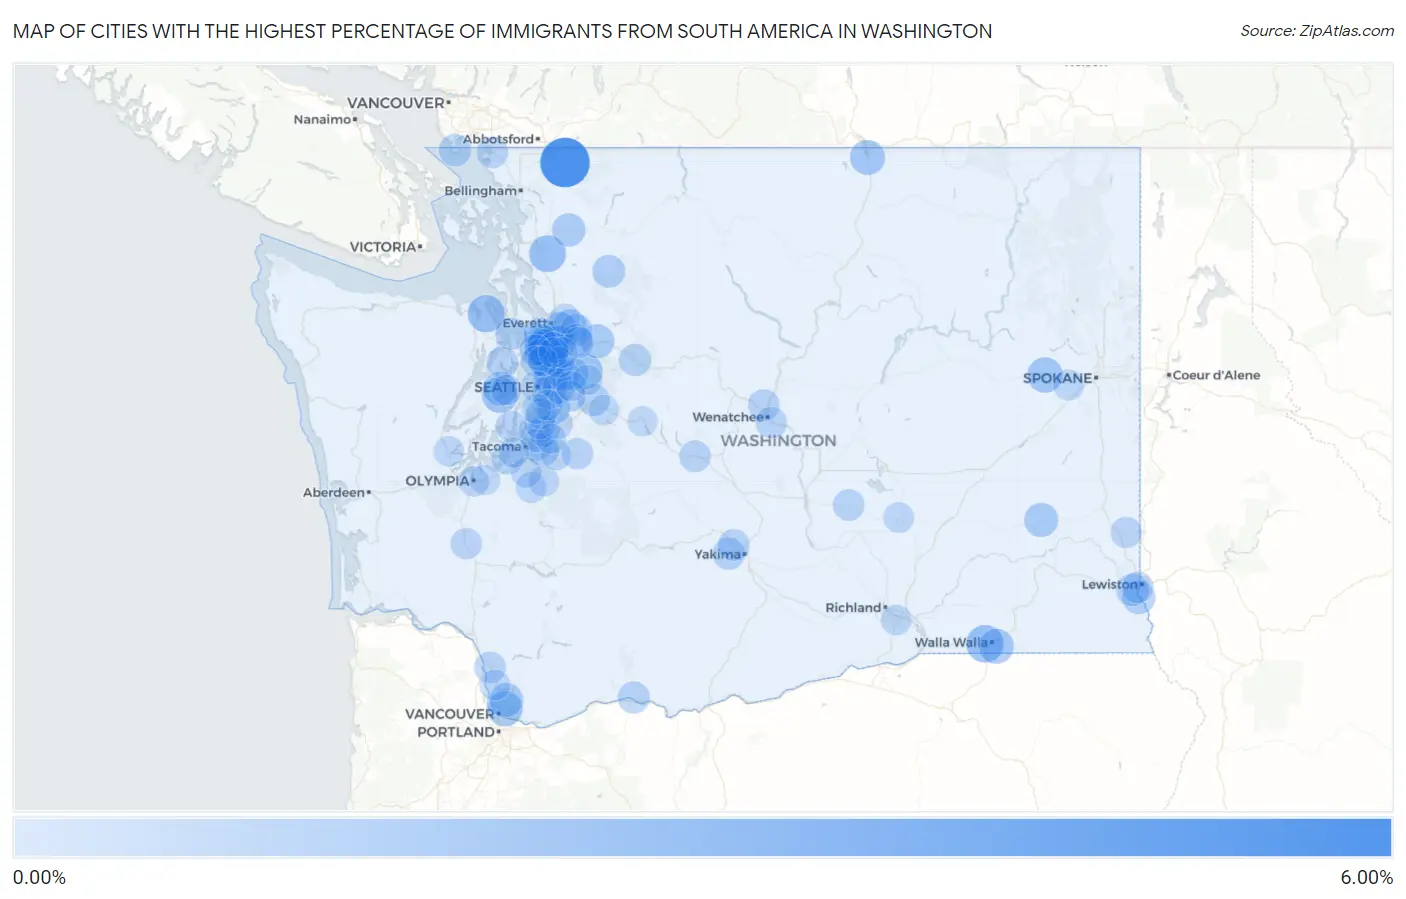
Map of Cities with the Highest Percentage of Immigrants from South America in Washington
0.00%
6.00%
Cities with the Highest Percentage of Immigrants from South America in Washington
| City | South America | vs State | vs National | |
| 1. | Maple Falls | 5.63% | 0.40%(+5.22)#-1 | 1.10%(+4.53)#0 |
| 2. | Larch Way | 3.00% | 0.40%(+2.60)#128 | 1.10%(+1.90)#4,042 |
| 3. | Garrett | 2.30% | 0.40%(+1.89)#129 | 1.10%(+1.20)#4,043 |
| 4. | Port Hadlock Irondale | 2.25% | 0.40%(+1.85)#130 | 1.10%(+1.16)#4,044 |
| 5. | Big Lake | 2.16% | 0.40%(+1.76)#131 | 1.10%(+1.06)#4,045 |
| 6. | Navy Yard City | 1.93% | 0.40%(+1.53)#150 | 1.10%(+0.831)#4,673 |
| 7. | Mill Creek | 1.83% | 0.40%(+1.42)#210 | 1.10%(+0.729)#6,602 |
| 8. | Reardan | 1.80% | 0.40%(+1.40)#211 | 1.10%(+0.702)#6,603 |
| 9. | Lake Marcel Stillwater | 1.79% | 0.40%(+1.39)#212 | 1.10%(+0.693)#6,604 |
| 10. | Minnehaha | 1.77% | 0.40%(+1.37)#213 | 1.10%(+0.672)#6,605 |
| 11. | Oroville | 1.71% | 0.40%(+1.31)#214 | 1.10%(+0.613)#6,606 |
| 12. | Walla Walla East | 1.70% | 0.40%(+1.29)#215 | 1.10%(+0.599)#6,607 |
| 13. | Kirkland | 1.68% | 0.40%(+1.28)#216 | 1.10%(+0.583)#6,608 |
| 14. | Kenmore | 1.52% | 0.40%(+1.12)#217 | 1.10%(+0.422)#6,609 |
| 15. | Rocky Point | 1.49% | 0.40%(+1.08)#218 | 1.10%(+0.389)#6,610 |
| 16. | Bothell | 1.48% | 0.40%(+1.07)#219 | 1.10%(+0.377)#6,611 |
| 17. | Lacrosse | 1.44% | 0.40%(+1.03)#220 | 1.10%(+0.341)#6,612 |
| 18. | Tehaleh | 1.44% | 0.40%(+1.03)#221 | 1.10%(+0.339)#6,613 |
| 19. | Everett | 1.43% | 0.40%(+1.02)#222 | 1.10%(+0.327)#6,614 |
| 20. | Barberton | 1.42% | 0.40%(+1.02)#337 | 1.10%(+0.324)#10,656 |
| 21. | Sultan | 1.39% | 0.40%(+0.987)#338 | 1.10%(+0.293)#10,657 |
| 22. | Lynnwood | 1.37% | 0.40%(+0.968)#339 | 1.10%(+0.274)#10,658 |
| 23. | Silver Firs | 1.34% | 0.40%(+0.932)#340 | 1.10%(+0.238)#10,659 |
| 24. | Mercer Island | 1.30% | 0.40%(+0.892)#341 | 1.10%(+0.198)#10,660 |
| 25. | Lyman | 1.30% | 0.40%(+0.891)#342 | 1.10%(+0.197)#10,661 |
| 26. | Asotin | 1.26% | 0.40%(+0.854)#343 | 1.10%(+0.160)#10,662 |
| 27. | Fobes Hill | 1.25% | 0.40%(+0.847)#361 | 1.10%(+0.153)#11,582 |
| 28. | Yarrow Point | 1.25% | 0.40%(+0.846)#362 | 1.10%(+0.152)#11,583 |
| 29. | Alderwood Manor | 1.19% | 0.40%(+0.784)#363 | 1.10%(+0.089)#11,584 |
| 30. | Renton | 1.19% | 0.40%(+0.782)#364 | 1.10%(+0.087)#11,585 |
| 31. | Union Hill Novelty Hill | 1.14% | 0.40%(+0.740)#384 | 1.10%(+0.045)#13,205 |
| 32. | Swede Heaven | 1.10% | 0.40%(+0.695)#385 | 1.10%(+0.001)#13,206 |
| 33. | Clarkston Heights Vineland | 1.09% | 0.40%(+0.687)#386 | 1.10%(-0.007)#13,207 |
| 34. | Picnic Point | 1.05% | 0.40%(+0.641)#387 | 1.10%(-0.053)#13,210 |
| 35. | Point Roberts | 1.04% | 0.40%(+0.637)#388 | 1.10%(-0.057)#13,211 |
| 36. | Edgewood | 1.03% | 0.40%(+0.629)#389 | 1.10%(-0.066)#13,212 |
| 37. | Bellevue | 1.01% | 0.40%(+0.608)#390 | 1.10%(-0.086)#13,213 |
| 38. | Mukilteo | 0.99% | 0.40%(+0.584)#391 | 1.10%(-0.111)#13,214 |
| 39. | Three Lakes | 0.98% | 0.40%(+0.576)#392 | 1.10%(-0.118)#13,215 |
| 40. | Summitview | 0.97% | 0.40%(+0.567)#393 | 1.10%(-0.127)#13,216 |
| 41. | Baring | 0.97% | 0.40%(+0.567)#394 | 1.10%(-0.127)#13,217 |
| 42. | White Salmon | 0.96% | 0.40%(+0.554)#395 | 1.10%(-0.140)#13,218 |
| 43. | Hansville | 0.96% | 0.40%(+0.551)#396 | 1.10%(-0.143)#13,219 |
| 44. | Snoqualmie | 0.92% | 0.40%(+0.519)#397 | 1.10%(-0.175)#13,220 |
| 45. | Monroe North | 0.90% | 0.40%(+0.500)#398 | 1.10%(-0.194)#13,221 |
| 46. | Fife Heights | 0.89% | 0.40%(+0.486)#399 | 1.10%(-0.208)#13,222 |
| 47. | North Lynnwood | 0.88% | 0.40%(+0.479)#400 | 1.10%(-0.215)#13,223 |
| 48. | Federal Way | 0.88% | 0.40%(+0.476)#401 | 1.10%(-0.218)#13,224 |
| 49. | Poulsbo | 0.87% | 0.40%(+0.467)#402 | 1.10%(-0.227)#13,225 |
| 50. | Gleed | 0.87% | 0.40%(+0.463)#403 | 1.10%(-0.232)#13,226 |
| 51. | Mountlake Terrace | 0.85% | 0.40%(+0.448)#404 | 1.10%(-0.246)#13,227 |
| 52. | Sunnyslope | 0.84% | 0.40%(+0.440)#405 | 1.10%(-0.254)#13,228 |
| 53. | South Cle Elum | 0.84% | 0.40%(+0.435)#406 | 1.10%(-0.259)#13,229 |
| 54. | Royal City | 0.83% | 0.40%(+0.421)#407 | 1.10%(-0.273)#13,230 |
| 55. | Steilacoom | 0.82% | 0.40%(+0.419)#408 | 1.10%(-0.275)#13,231 |
| 56. | Redmond | 0.81% | 0.40%(+0.408)#409 | 1.10%(-0.286)#13,232 |
| 57. | Woodland | 0.80% | 0.40%(+0.401)#410 | 1.10%(-0.294)#13,233 |
| 58. | South Wenatchee | 0.79% | 0.40%(+0.385)#411 | 1.10%(-0.309)#13,234 |
| 59. | Mill Creek East | 0.79% | 0.40%(+0.383)#412 | 1.10%(-0.312)#13,235 |
| 60. | West Clarkston Highland | 0.77% | 0.40%(+0.369)#413 | 1.10%(-0.325)#13,236 |
| 61. | Blaine | 0.77% | 0.40%(+0.363)#414 | 1.10%(-0.331)#13,237 |
| 62. | Lakeland North | 0.75% | 0.40%(+0.345)#415 | 1.10%(-0.350)#13,238 |
| 63. | Enumclaw | 0.74% | 0.40%(+0.340)#416 | 1.10%(-0.354)#13,239 |
| 64. | Issaquah | 0.73% | 0.40%(+0.330)#417 | 1.10%(-0.365)#13,240 |
| 65. | Monroe | 0.73% | 0.40%(+0.330)#418 | 1.10%(-0.365)#13,241 |
| 66. | Pullman | 0.71% | 0.40%(+0.309)#419 | 1.10%(-0.385)#13,242 |
| 67. | Maplewood | 0.71% | 0.40%(+0.303)#420 | 1.10%(-0.392)#13,860 |
| 68. | Chehalis | 0.71% | 0.40%(+0.302)#421 | 1.10%(-0.393)#13,861 |
| 69. | Edmonds | 0.70% | 0.40%(+0.291)#422 | 1.10%(-0.403)#13,862 |
| 70. | Woodinville | 0.68% | 0.40%(+0.273)#423 | 1.10%(-0.422)#13,863 |
| 71. | Des Moines | 0.66% | 0.40%(+0.260)#424 | 1.10%(-0.434)#13,864 |
| 72. | Seatac | 0.64% | 0.40%(+0.239)#425 | 1.10%(-0.455)#13,865 |
| 73. | South Creek | 0.64% | 0.40%(+0.235)#426 | 1.10%(-0.459)#13,866 |
| 74. | Shoreline | 0.63% | 0.40%(+0.227)#427 | 1.10%(-0.468)#13,867 |
| 75. | Fairchild Afb | 0.63% | 0.40%(+0.224)#428 | 1.10%(-0.470)#13,868 |
| 76. | Seattle | 0.63% | 0.40%(+0.222)#429 | 1.10%(-0.472)#13,869 |
| 77. | Kennewick | 0.60% | 0.40%(+0.197)#430 | 1.10%(-0.497)#13,870 |
| 78. | Ridgefield | 0.60% | 0.40%(+0.197)#431 | 1.10%(-0.498)#13,871 |
| 79. | Maltby | 0.60% | 0.40%(+0.195)#432 | 1.10%(-0.499)#13,872 |
| 80. | Olympia | 0.58% | 0.40%(+0.176)#433 | 1.10%(-0.518)#13,873 |
| 81. | Kent | 0.57% | 0.40%(+0.171)#434 | 1.10%(-0.523)#13,874 |
| 82. | Othello | 0.57% | 0.40%(+0.167)#435 | 1.10%(-0.527)#13,875 |
| 83. | Graham | 0.56% | 0.40%(+0.160)#436 | 1.10%(-0.535)#13,876 |
| 84. | Shelton | 0.56% | 0.40%(+0.159)#437 | 1.10%(-0.536)#13,877 |
| 85. | Bryn Mawr Skyway | 0.56% | 0.40%(+0.156)#438 | 1.10%(-0.538)#13,878 |
| 86. | Bonney Lake | 0.56% | 0.40%(+0.154)#439 | 1.10%(-0.541)#13,879 |
| 87. | Enetai | 0.54% | 0.40%(+0.131)#440 | 1.10%(-0.563)#13,880 |
| 88. | Spanaway | 0.52% | 0.40%(+0.113)#441 | 1.10%(-0.581)#13,881 |
| 89. | University Place | 0.52% | 0.40%(+0.112)#442 | 1.10%(-0.582)#13,882 |
| 90. | Fairwood Cdp King County | 0.51% | 0.40%(+0.101)#443 | 1.10%(-0.593)#13,883 |
| 91. | Lacey | 0.49% | 0.40%(+0.090)#444 | 1.10%(-0.604)#13,884 |
| 92. | Burien | 0.49% | 0.40%(+0.087)#445 | 1.10%(-0.607)#13,885 |
| 93. | Riverbend | 0.49% | 0.40%(+0.086)#446 | 1.10%(-0.608)#13,886 |
| 94. | Sammamish | 0.48% | 0.40%(+0.074)#447 | 1.10%(-0.621)#13,887 |
| 95. | Carnation | 0.48% | 0.40%(+0.073)#448 | 1.10%(-0.621)#13,888 |
| 96. | Snoqualmie Pass | 0.48% | 0.40%(+0.072)#449 | 1.10%(-0.622)#13,889 |
| 97. | Lake Stevens | 0.47% | 0.40%(+0.067)#450 | 1.10%(-0.627)#13,890 |
| 98. | Auburn | 0.46% | 0.40%(+0.057)#451 | 1.10%(-0.637)#13,891 |
| 99. | Lake Forest Park | 0.46% | 0.40%(+0.057)#452 | 1.10%(-0.638)#13,892 |
| 100. | Bothell East | 0.46% | 0.40%(+0.055)#453 | 1.10%(-0.639)#13,893 |
Common Questions
What are the Top 10 Cities with the Highest Percentage of Immigrants from South America in Washington?
Top 10 Cities with the Highest Percentage of Immigrants from South America in Washington are:
#1
5.63%
#2
3.00%
#3
2.30%
#4
2.25%
#5
2.16%
#6
1.93%
#7
1.83%
#8
1.80%
#9
1.79%
#10
1.77%
What city has the Highest Percentage of Immigrants from South America in Washington?
Maple Falls has the Highest Percentage of Immigrants from South America in Washington with 5.63%.
What is the Percentage of Immigrants from South America in the State of Washington?
Percentage of Immigrants from South America in Washington is 0.40%.
What is the Percentage of Immigrants from South America in the United States?
Percentage of Immigrants from South America in the United States is 1.10%.