Cities with the Most Immigrants from Kenya in Washington
RELATED REPORTS & OPTIONS
Kenya
Washington
Compare Cities
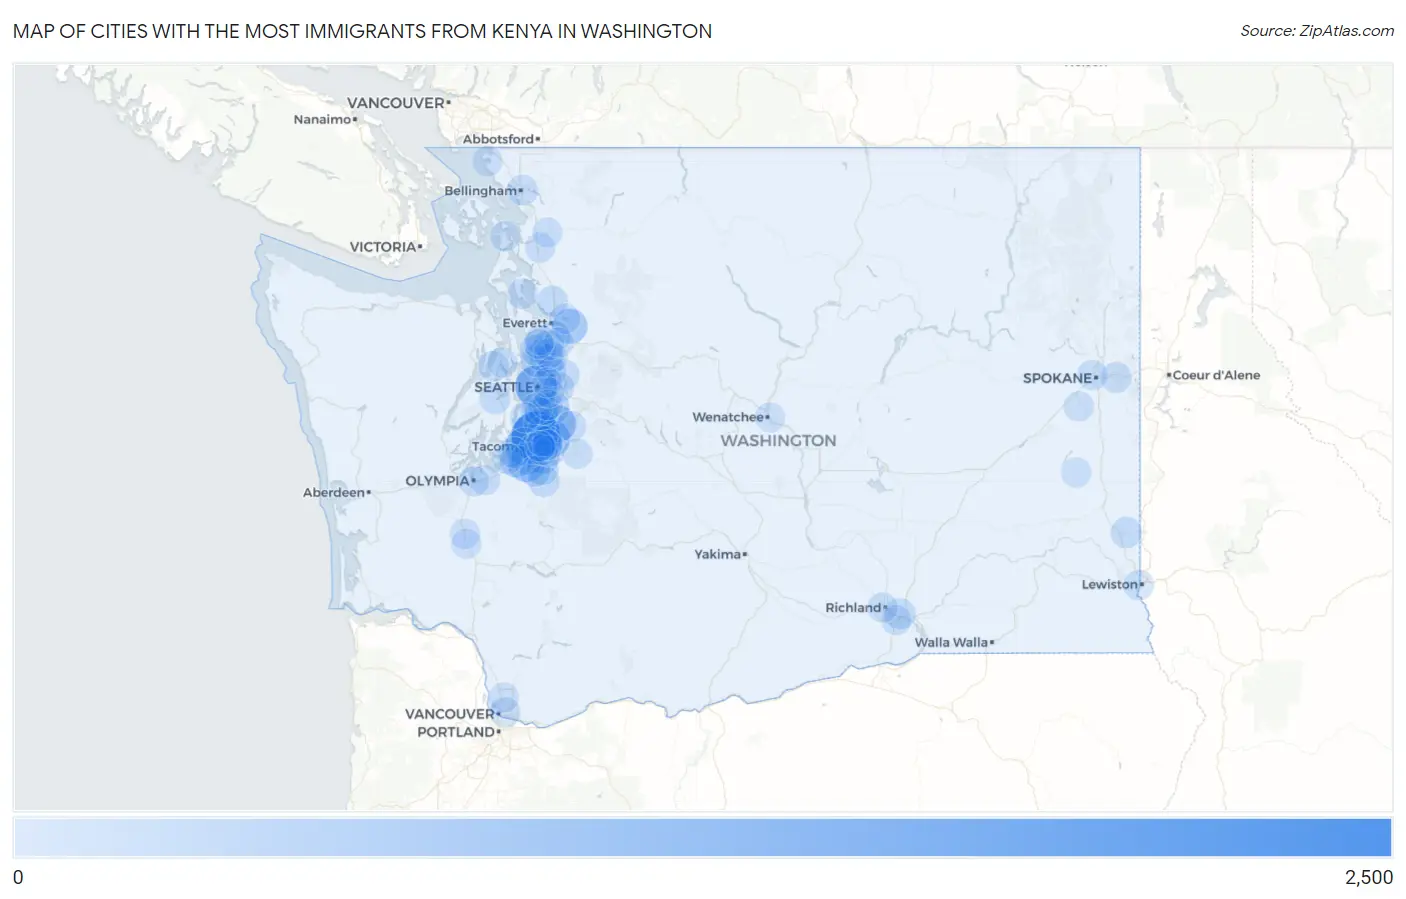
Map of Cities with the Most Immigrants from Kenya in Washington
0
2,500
Cities with the Most Immigrants from Kenya in Washington
| City | Kenya | vs State | vs National | |
| 1. | Federal Way | 2,212 | 12,735(17.37%)#1 | 158,590(1.39%)#4 |
| 2. | Seattle | 1,308 | 12,735(10.27%)#2 | 158,590(0.82%)#11 |
| 3. | Auburn | 823 | 12,735(6.46%)#3 | 158,590(0.52%)#26 |
| 4. | Kent | 793 | 12,735(6.23%)#4 | 158,590(0.50%)#28 |
| 5. | Tacoma | 781 | 12,735(6.13%)#5 | 158,590(0.49%)#29 |
| 6. | Parkland | 695 | 12,735(5.46%)#6 | 158,590(0.44%)#34 |
| 7. | Everett | 543 | 12,735(4.26%)#7 | 158,590(0.34%)#42 |
| 8. | Seatac | 353 | 12,735(2.77%)#8 | 158,590(0.22%)#73 |
| 9. | Puyallup | 318 | 12,735(2.50%)#9 | 158,590(0.20%)#81 |
| 10. | Kenmore | 288 | 12,735(2.26%)#10 | 158,590(0.18%)#93 |
| 11. | Midland | 274 | 12,735(2.15%)#11 | 158,590(0.17%)#101 |
| 12. | Lakewood | 267 | 12,735(2.10%)#12 | 158,590(0.17%)#105 |
| 13. | Renton | 227 | 12,735(1.78%)#13 | 158,590(0.14%)#124 |
| 14. | Des Moines | 200 | 12,735(1.57%)#14 | 158,590(0.13%)#150 |
| 15. | South Hill | 198 | 12,735(1.55%)#15 | 158,590(0.12%)#153 |
| 16. | Lakeland North | 195 | 12,735(1.53%)#16 | 158,590(0.12%)#161 |
| 17. | Tukwila | 168 | 12,735(1.32%)#17 | 158,590(0.11%)#188 |
| 18. | Shoreline | 159 | 12,735(1.25%)#18 | 158,590(0.10%)#202 |
| 19. | Graham | 145 | 12,735(1.14%)#19 | 158,590(0.09%)#223 |
| 20. | Fife | 145 | 12,735(1.14%)#20 | 158,590(0.09%)#224 |
| 21. | Fairwood Cdp King County | 143 | 12,735(1.12%)#21 | 158,590(0.09%)#230 |
| 22. | Pullman | 128 | 12,735(1.01%)#22 | 158,590(0.08%)#247 |
| 23. | Redmond | 120 | 12,735(0.94%)#23 | 158,590(0.08%)#268 |
| 24. | Pasco | 117 | 12,735(0.92%)#24 | 158,590(0.07%)#279 |
| 25. | Marysville | 112 | 12,735(0.88%)#25 | 158,590(0.07%)#285 |
| 26. | University Place | 104 | 12,735(0.82%)#26 | 158,590(0.07%)#300 |
| 27. | Burien | 101 | 12,735(0.79%)#27 | 158,590(0.06%)#308 |
| 28. | Eastmont | 99 | 12,735(0.78%)#28 | 158,590(0.06%)#315 |
| 29. | Bremerton | 96 | 12,735(0.75%)#29 | 158,590(0.06%)#321 |
| 30. | Frederickson | 94 | 12,735(0.74%)#30 | 158,590(0.06%)#327 |
| 31. | Bellevue | 86 | 12,735(0.68%)#31 | 158,590(0.05%)#352 |
| 32. | Spokane Valley | 85 | 12,735(0.67%)#32 | 158,590(0.05%)#356 |
| 33. | Sumner | 69 | 12,735(0.54%)#33 | 158,590(0.04%)#413 |
| 34. | Steilacoom | 68 | 12,735(0.53%)#34 | 158,590(0.04%)#418 |
| 35. | Lynnwood | 65 | 12,735(0.51%)#35 | 158,590(0.04%)#431 |
| 36. | Bellingham | 60 | 12,735(0.47%)#36 | 158,590(0.04%)#464 |
| 37. | Bangor Base | 60 | 12,735(0.47%)#37 | 158,590(0.04%)#468 |
| 38. | Camano | 52 | 12,735(0.41%)#38 | 158,590(0.03%)#525 |
| 39. | Vancouver | 50 | 12,735(0.39%)#39 | 158,590(0.03%)#534 |
| 40. | Mountlake Terrace | 50 | 12,735(0.39%)#40 | 158,590(0.03%)#540 |
| 41. | Lake Stevens | 48 | 12,735(0.38%)#41 | 158,590(0.03%)#552 |
| 42. | Bothell | 45 | 12,735(0.35%)#42 | 158,590(0.03%)#577 |
| 43. | Algona | 43 | 12,735(0.34%)#43 | 158,590(0.03%)#600 |
| 44. | Lacey | 42 | 12,735(0.33%)#44 | 158,590(0.03%)#605 |
| 45. | Edgewood | 42 | 12,735(0.33%)#45 | 158,590(0.03%)#611 |
| 46. | Kirkland | 41 | 12,735(0.32%)#46 | 158,590(0.03%)#622 |
| 47. | Olympia | 37 | 12,735(0.29%)#47 | 158,590(0.02%)#674 |
| 48. | Edmonds | 36 | 12,735(0.28%)#48 | 158,590(0.02%)#685 |
| 49. | Maple Valley | 33 | 12,735(0.26%)#49 | 158,590(0.02%)#717 |
| 50. | Kennewick | 28 | 12,735(0.22%)#50 | 158,590(0.02%)#787 |
| 51. | Bryn Mawr Skyway | 27 | 12,735(0.21%)#51 | 158,590(0.02%)#815 |
| 52. | Lakeland South | 27 | 12,735(0.21%)#52 | 158,590(0.02%)#818 |
| 53. | Spokane | 24 | 12,735(0.19%)#53 | 158,590(0.02%)#859 |
| 54. | Mount Vernon | 24 | 12,735(0.19%)#54 | 158,590(0.02%)#866 |
| 55. | Enumclaw | 24 | 12,735(0.19%)#55 | 158,590(0.02%)#871 |
| 56. | Martha Lake | 23 | 12,735(0.18%)#56 | 158,590(0.01%)#884 |
| 57. | Bothell West | 23 | 12,735(0.18%)#57 | 158,590(0.01%)#886 |
| 58. | Pacific | 23 | 12,735(0.18%)#58 | 158,590(0.01%)#889 |
| 59. | Milton | 22 | 12,735(0.17%)#59 | 158,590(0.01%)#904 |
| 60. | Clarkston | 22 | 12,735(0.17%)#60 | 158,590(0.01%)#906 |
| 61. | Mercer Island | 20 | 12,735(0.16%)#61 | 158,590(0.01%)#936 |
| 62. | Picnic Point | 17 | 12,735(0.13%)#62 | 158,590(0.01%)#1,020 |
| 63. | Poulsbo | 12 | 12,735(0.09%)#63 | 158,590(0.01%)#1,173 |
| 64. | Birch Bay | 11 | 12,735(0.09%)#64 | 158,590(0.01%)#1,201 |
| 65. | Centralia | 9 | 12,735(0.07%)#65 | 158,590(0.01%)#1,257 |
| 66. | Silver Firs | 8 | 12,735(0.06%)#66 | 158,590(0.01%)#1,284 |
| 67. | Anacortes | 8 | 12,735(0.06%)#67 | 158,590(0.01%)#1,285 |
| 68. | Meadowdale | 8 | 12,735(0.06%)#68 | 158,590(0.01%)#1,300 |
| 69. | St John | 8 | 12,735(0.06%)#69 | 158,590(0.01%)#1,305 |
| 70. | Cheney | 7 | 12,735(0.05%)#70 | 158,590(0.00%)#1,338 |
| 71. | Mount Vista | 7 | 12,735(0.05%)#71 | 158,590(0.00%)#1,342 |
| 72. | Richland | 6 | 12,735(0.05%)#72 | 158,590(0.00%)#1,365 |
| 73. | Medina | 4 | 12,735(0.03%)#73 | 158,590(0.00%)#1,444 |
| 74. | Chehalis | 3 | 12,735(0.02%)#74 | 158,590(0.00%)#1,463 |
| 75. | East Wenatchee | 2 | 12,735(0.02%)#75 | 158,590(0.00%)#1,493 |
| 76. | Sedro Woolley | 1 | 12,735(0.01%)#76 | 158,590(0.00%)#1,528 |
| 77. | Vashon | 1 | 12,735(0.01%)#77 | 158,590(0.00%)#1,529 |
Common Questions
What are the Top 10 Cities with the Most Immigrants from Kenya in Washington?
Top 10 Cities with the Most Immigrants from Kenya in Washington are:
What city has the Most Immigrants from Kenya in Washington?
Federal Way has the Most Immigrants from Kenya in Washington with 2,212.
What is the Total Immigrants from Kenya in the State of Washington?
Total Immigrants from Kenya in Washington is 12,735.
What is the Total Immigrants from Kenya in the United States?
Total Immigrants from Kenya in the United States is 158,590.