Cities with the Highest Poverty Level Among Single Fathers in Washington
RELATED REPORTS & OPTIONS
Highest Poverty | Single Father
Washington
Compare Cities
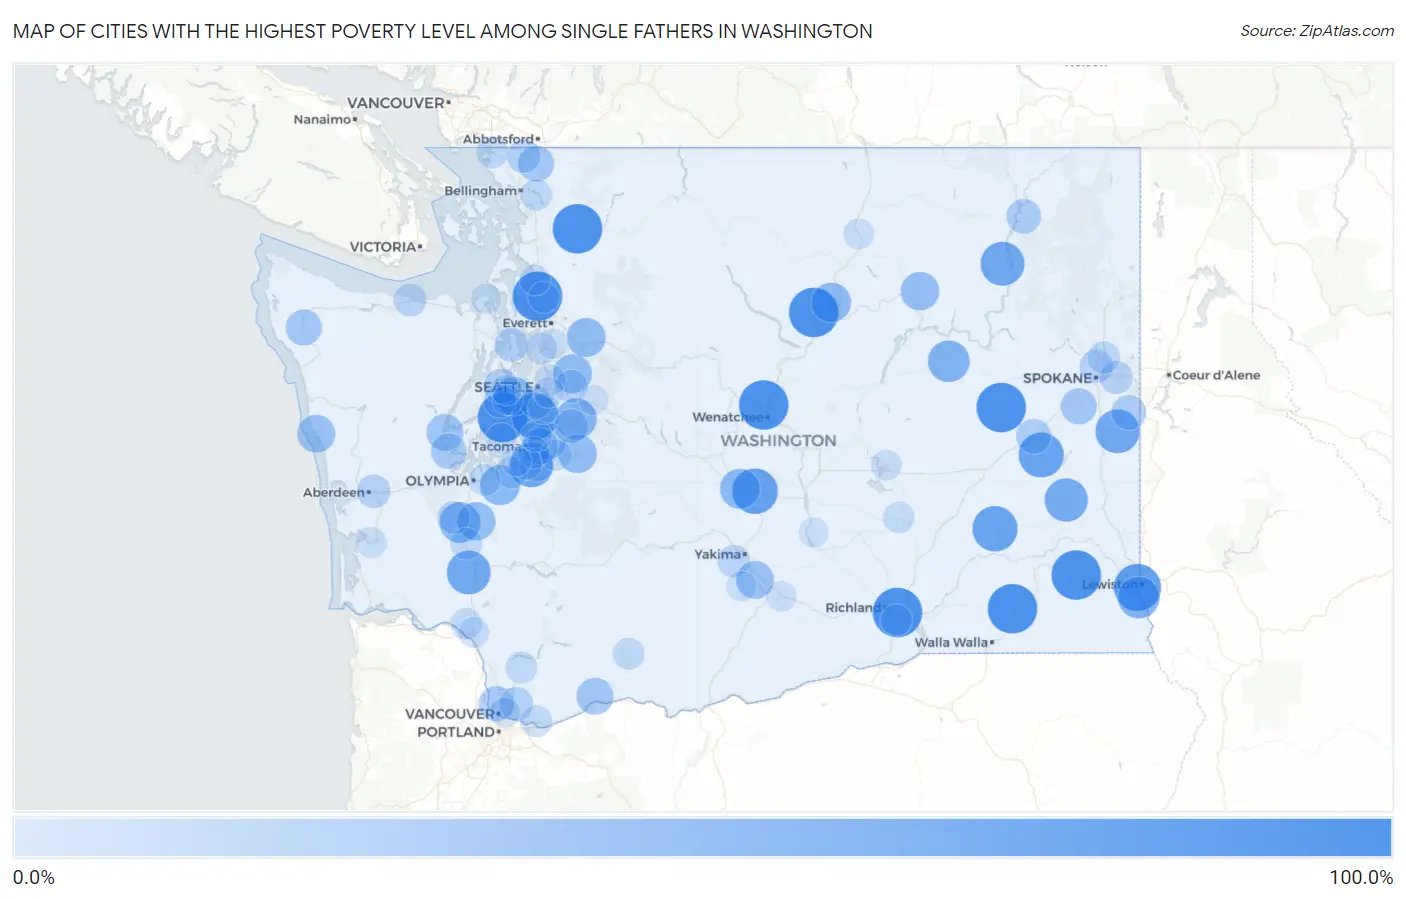
Map of Cities with the Highest Poverty Level Among Single Fathers in Washington
0.0%
100.0%
Cities with the Highest Poverty Level Among Single Fathers in Washington
| City | Single Father Poverty | vs State | vs National | |
| 1. | Sunnyslope | 100.0% | 10.6%(+89.4)#1 | 13.7%(+86.3)#127 |
| 2. | Burley | 100.0% | 10.6%(+89.4)#2 | 13.7%(+86.3)#184 |
| 3. | West Pasco | 100.0% | 10.6%(+89.4)#3 | 13.7%(+86.3)#280 |
| 4. | Kayak Point | 100.0% | 10.6%(+89.4)#4 | 13.7%(+86.3)#313 |
| 5. | Pomeroy | 100.0% | 10.6%(+89.4)#5 | 13.7%(+86.3)#364 |
| 6. | Waitsburg | 100.0% | 10.6%(+89.4)#6 | 13.7%(+86.3)#502 |
| 7. | Pateros | 100.0% | 10.6%(+89.4)#7 | 13.7%(+86.3)#632 |
| 8. | Harrington | 100.0% | 10.6%(+89.4)#8 | 13.7%(+86.3)#758 |
| 9. | Hamilton | 100.0% | 10.6%(+89.4)#9 | 13.7%(+86.3)#821 |
| 10. | Clear Lake Cdp Skagit County | 90.6% | 10.6%(+80.1)#10 | 13.7%(+76.9)#1,230 |
| 11. | West Clarkston Highland | 89.0% | 10.6%(+78.4)#11 | 13.7%(+75.2)#1,240 |
| 12. | Normandy Park | 85.4% | 10.6%(+74.9)#12 | 13.7%(+71.7)#1,286 |
| 13. | Kittitas | 82.6% | 10.6%(+72.1)#13 | 13.7%(+68.9)#1,329 |
| 14. | Washtucna | 80.0% | 10.6%(+69.4)#14 | 13.7%(+66.3)#1,388 |
| 15. | Lamont | 80.0% | 10.6%(+69.4)#15 | 13.7%(+66.3)#1,389 |
| 16. | Clover Creek | 76.7% | 10.6%(+66.1)#16 | 13.7%(+63.0)#1,436 |
| 17. | Inchelium | 75.0% | 10.6%(+64.4)#17 | 13.7%(+61.3)#1,485 |
| 18. | Waverly | 75.0% | 10.6%(+64.4)#18 | 13.7%(+61.3)#1,488 |
| 19. | Winlock | 73.9% | 10.6%(+63.4)#19 | 13.7%(+60.2)#1,500 |
| 20. | Endicott | 71.4% | 10.6%(+60.9)#20 | 13.7%(+57.7)#1,575 |
| 21. | Asotin | 64.3% | 10.6%(+53.7)#21 | 13.7%(+50.6)#1,793 |
| 22. | Wilbur | 64.0% | 10.6%(+53.4)#22 | 13.7%(+50.3)#1,807 |
| 23. | Hobart | 61.1% | 10.6%(+50.6)#23 | 13.7%(+47.4)#1,888 |
| 24. | Grand Mound | 60.0% | 10.6%(+49.4)#24 | 13.7%(+46.3)#1,919 |
| 25. | Nisqually Indian Community | 57.1% | 10.6%(+46.6)#25 | 13.7%(+43.4)#2,065 |
| 26. | Ellensburg | 56.2% | 10.6%(+45.6)#26 | 13.7%(+42.5)#2,102 |
| 27. | Brewster | 54.8% | 10.6%(+44.3)#27 | 13.7%(+41.1)#2,149 |
| 28. | Union Hill Novelty Hill | 52.4% | 10.6%(+41.9)#28 | 13.7%(+38.7)#2,259 |
| 29. | Manchester | 51.9% | 10.6%(+41.3)#29 | 13.7%(+38.2)#2,277 |
| 30. | Woods Creek | 51.7% | 10.6%(+41.1)#30 | 13.7%(+38.0)#2,293 |
| 31. | Enumclaw | 50.8% | 10.6%(+40.2)#31 | 13.7%(+37.1)#2,316 |
| 32. | Bucoda | 50.0% | 10.6%(+39.4)#32 | 13.7%(+36.3)#2,427 |
| 33. | Nespelem | 50.0% | 10.6%(+39.4)#33 | 13.7%(+36.3)#2,497 |
| 34. | Taholah | 47.1% | 10.6%(+36.5)#34 | 13.7%(+33.3)#2,605 |
| 35. | Wapato | 46.5% | 10.6%(+35.9)#35 | 13.7%(+32.8)#2,625 |
| 36. | Carson | 42.9% | 10.6%(+32.3)#36 | 13.7%(+29.1)#2,796 |
| 37. | Skokomish | 42.9% | 10.6%(+32.3)#37 | 13.7%(+29.1)#2,813 |
| 38. | Algona | 42.5% | 10.6%(+32.0)#38 | 13.7%(+28.8)#2,829 |
| 39. | Cheney | 39.4% | 10.6%(+28.9)#39 | 13.7%(+25.7)#3,034 |
| 40. | Milton | 39.4% | 10.6%(+28.9)#40 | 13.7%(+25.7)#3,035 |
| 41. | Forks | 38.9% | 10.6%(+28.3)#41 | 13.7%(+25.2)#3,063 |
| 42. | Everson | 38.1% | 10.6%(+27.5)#42 | 13.7%(+24.4)#3,105 |
| 43. | Shelton | 37.0% | 10.6%(+26.5)#43 | 13.7%(+23.3)#3,180 |
| 44. | Lake Shore | 36.0% | 10.6%(+25.4)#44 | 13.7%(+22.3)#3,255 |
| 45. | Tracyton | 33.3% | 10.6%(+22.8)#45 | 13.7%(+19.6)#3,438 |
| 46. | Kettle Falls | 33.3% | 10.6%(+22.8)#46 | 13.7%(+19.6)#3,455 |
| 47. | Sprague | 33.3% | 10.6%(+22.8)#47 | 13.7%(+19.6)#3,500 |
| 48. | Rockford | 33.3% | 10.6%(+22.8)#48 | 13.7%(+19.6)#3,527 |
| 49. | Maple Valley | 29.3% | 10.6%(+18.8)#49 | 13.7%(+15.6)#3,861 |
| 50. | Orchards | 29.1% | 10.6%(+18.5)#50 | 13.7%(+15.4)#3,879 |
| 51. | Lynden | 28.6% | 10.6%(+18.0)#51 | 13.7%(+14.9)#3,904 |
| 52. | Port Gamble Tribal Community | 28.6% | 10.6%(+18.0)#52 | 13.7%(+14.9)#3,916 |
| 53. | Aberdeen | 28.2% | 10.6%(+17.6)#53 | 13.7%(+14.5)#3,958 |
| 54. | Town And Country | 26.8% | 10.6%(+16.2)#54 | 13.7%(+13.0)#4,085 |
| 55. | Summit View | 26.4% | 10.6%(+15.8)#55 | 13.7%(+12.7)#4,120 |
| 56. | Spokane Valley | 25.9% | 10.6%(+15.3)#56 | 13.7%(+12.2)#4,168 |
| 57. | Port Orchard | 25.5% | 10.6%(+14.9)#57 | 13.7%(+11.8)#4,191 |
| 58. | Port Angeles | 25.5% | 10.6%(+14.9)#58 | 13.7%(+11.7)#4,193 |
| 59. | Sammamish | 24.6% | 10.6%(+14.1)#59 | 13.7%(+10.9)#4,313 |
| 60. | Rochester | 24.6% | 10.6%(+14.0)#60 | 13.7%(+10.9)#4,315 |
| 61. | Mead | 23.3% | 10.6%(+12.7)#61 | 13.7%(+9.60)#4,425 |
| 62. | Ahtanum | 23.0% | 10.6%(+12.4)#62 | 13.7%(+9.24)#4,472 |
| 63. | White Center | 21.5% | 10.6%(+11.0)#63 | 13.7%(+7.80)#4,631 |
| 64. | Washougal | 20.9% | 10.6%(+10.3)#64 | 13.7%(+7.15)#4,709 |
| 65. | Sudden Valley | 20.8% | 10.6%(+10.2)#65 | 13.7%(+7.08)#4,722 |
| 66. | Amboy | 20.7% | 10.6%(+10.1)#66 | 13.7%(+6.98)#4,739 |
| 67. | Fort Lewis | 20.7% | 10.6%(+10.1)#67 | 13.7%(+6.94)#4,742 |
| 68. | Chehalis | 20.6% | 10.6%(+10.0)#68 | 13.7%(+6.88)#4,747 |
| 69. | Lynnwood | 20.6% | 10.6%(+10.0)#69 | 13.7%(+6.86)#4,752 |
| 70. | Blaine | 20.3% | 10.6%(+9.78)#70 | 13.7%(+6.63)#4,773 |
| 71. | Waller | 20.3% | 10.6%(+9.76)#71 | 13.7%(+6.61)#4,776 |
| 72. | Parkland | 20.3% | 10.6%(+9.70)#72 | 13.7%(+6.55)#4,780 |
| 73. | Trout Lake | 20.0% | 10.6%(+9.44)#73 | 13.7%(+6.29)#4,838 |
| 74. | Lacey | 19.6% | 10.6%(+9.06)#74 | 13.7%(+5.91)#4,899 |
| 75. | Othello | 19.3% | 10.6%(+8.74)#75 | 13.7%(+5.59)#4,939 |
| 76. | Longview Heights | 19.2% | 10.6%(+8.63)#76 | 13.7%(+5.48)#4,954 |
| 77. | Artondale | 18.7% | 10.6%(+8.11)#77 | 13.7%(+4.95)#5,022 |
| 78. | Kennewick | 18.7% | 10.6%(+8.09)#78 | 13.7%(+4.94)#5,025 |
| 79. | Yarrow Point | 18.2% | 10.6%(+7.62)#79 | 13.7%(+4.47)#5,089 |
| 80. | Bonney Lake | 17.3% | 10.6%(+6.78)#80 | 13.7%(+3.63)#5,201 |
| 81. | Federal Way | 17.1% | 10.6%(+6.51)#81 | 13.7%(+3.36)#5,225 |
| 82. | Kitsap Lake | 17.0% | 10.6%(+6.46)#82 | 13.7%(+3.31)#5,234 |
| 83. | Lake Goodwin | 16.9% | 10.6%(+6.36)#83 | 13.7%(+3.21)#5,242 |
| 84. | Kelso | 16.8% | 10.6%(+6.23)#84 | 13.7%(+3.08)#5,256 |
| 85. | Riverside | 16.7% | 10.6%(+6.11)#85 | 13.7%(+2.95)#5,318 |
| 86. | South Bend | 16.5% | 10.6%(+5.90)#86 | 13.7%(+2.74)#5,351 |
| 87. | Tukwila | 16.4% | 10.6%(+5.84)#87 | 13.7%(+2.69)#5,355 |
| 88. | Moses Lake | 16.1% | 10.6%(+5.52)#88 | 13.7%(+2.36)#5,393 |
| 89. | Stanwood | 16.0% | 10.6%(+5.41)#89 | 13.7%(+2.26)#5,407 |
| 90. | Granger | 15.0% | 10.6%(+4.44)#90 | 13.7%(+1.29)#5,542 |
| 91. | Enetai | 14.8% | 10.6%(+4.26)#91 | 13.7%(+1.10)#5,565 |
| 92. | Vancouver | 14.3% | 10.6%(+3.73)#92 | 13.7%(+0.580)#5,625 |
| 93. | Mercer Island | 14.3% | 10.6%(+3.73)#93 | 13.7%(+0.573)#5,629 |
| 94. | Mill Creek | 14.3% | 10.6%(+3.73)#94 | 13.7%(+0.573)#5,630 |
| 95. | Harrah | 14.3% | 10.6%(+3.73)#95 | 13.7%(+0.573)#5,655 |
| 96. | Lakewood | 13.8% | 10.6%(+3.27)#96 | 13.7%(+0.114)#5,720 |
| 97. | Port Townsend | 13.7% | 10.6%(+3.17)#97 | 13.7%(+0.013)#5,734 |
| 98. | Snoqualmie | 13.6% | 10.6%(+3.08)#98 | 13.7%(-0.076)#5,748 |
| 99. | Parkwood | 13.6% | 10.6%(+3.08)#99 | 13.7%(-0.076)#5,751 |
| 100. | Mattawa | 13.3% | 10.6%(+2.77)#100 | 13.7%(-0.379)#5,798 |
Common Questions
What are the Top 10 Cities with the Highest Poverty Level Among Single Fathers in Washington?
Top 10 Cities with the Highest Poverty Level Among Single Fathers in Washington are:
#1
100.0%
#2
100.0%
#3
100.0%
#4
100.0%
#5
100.0%
#6
100.0%
#7
100.0%
#8
100.0%
#9
100.0%
#10
89.0%
What city has the Highest Poverty Level Among Single Fathers in Washington?
Sunnyslope has the Highest Poverty Level Among Single Fathers in Washington with 100.0%.
What is the Poverty Level Among Single Fathers in the State of Washington?
Poverty Level Among Single Fathers in Washington is 10.6%.
What is the Poverty Level Among Single Fathers in the United States?
Poverty Level Among Single Fathers in the United States is 13.7%.