Cities with the Largest Luxembourger Community in Washington

RELATED REPORTS & OPTIONS

Luxembourger
Population
Families and Households
Female Fertility
Female Fertility (Unmarried)
Race (Community Size)
Race (Percentage)
Ancestry (Community Size)
AfghanAfricanAlaska NativeAlaskan AthabascanAlbanianAleutAlsatianAmericanApacheArabArapahoArgentineanArmenianAssyrian / Chaldean / SyriacAustralianAustrianBahamianBangladeshiBarbadianBasqueBelgianBelizeanBermudanBhutaneseBlackfeetBolivianBrazilianBritishBritish West IndianBulgarianBurmeseCajunCambodianCanadianCape VerdeanCarpatho RusynCelticCentral AmericanCentral American IndianCherokeeCheyenneChickasawChileanChineseChippewaChoctawColombianColvilleComancheCosta RicanCreeCreekCroatianCrowCubanCypriotCzechCzechoslovakianDanishDelawareDominicanDutchDutch West IndianEastern EuropeanEcuadorianEgyptianEnglishEstonianEthiopianEuropeanFijianFilipinoFinnishFrenchFrench American IndianFrench CanadianGermanGerman RussianGhanaianGreekGuamanian / ChamorroGuatemalanGuyaneseHaitianHmongHonduranHopiHoumaHungarianIcelanderIndian (Asian)IndonesianInupiatIranianIraqiIrishIroquoisIsraeliItalianJamaicanJapaneseJordanianKenyanKiowaKoreanLaotianLatvianLebaneseLiberianLithuanianLumbeeLuxembourgerMacedonianMalaysianMalteseMarshalleseMenomineeMexicanMexican American IndianMongolianMoroccanNative HawaiianNavajoNepaleseNew ZealanderNicaraguanNigerianNorthern EuropeanNorwegianOkinawanOsageOttawaPaiutePakistaniPalestinianPanamanianParaguayanPennsylvania GermanPeruvianPimaPolishPortuguesePotawatomiPuebloPuerto RicanPuget Sound SalishRomanianRussianSalvadoranSamoanScandinavianScotch-IrishScottishSeminoleSenegaleseSerbianShoshoneSierra LeoneanSiouxSlavicSlovakSloveneSomaliSouth AfricanSouth AmericanSouth American IndianSoviet UnionSpaniardSpanishSpanish AmericanSpanish American IndianSri LankanSubsaharan AfricanSudaneseSwedishSwissSyrianTaiwaneseThaiTlingit-HaidaTohono O'OdhamTonganTrinidadian and TobagonianTsimshianTurkishU.S. Virgin IslanderUgandanUkrainianUruguayanUteVenezuelanVietnameseWelshWest IndianYakamaYaquiYugoslavianYumanYup'ikZimbabwean
Ancestry (Percentage)
AfghanAfricanAlaska NativeAlaskan AthabascanAlbanianAleutAlsatianAmericanApacheArabArapahoArgentineanArmenianAssyrian / Chaldean / SyriacAustralianAustrianBahamianBangladeshiBarbadianBasqueBelgianBelizeanBermudanBhutaneseBlackfeetBolivianBrazilianBritishBritish West IndianBulgarianBurmeseCajunCambodianCanadianCape VerdeanCarpatho RusynCelticCentral AmericanCentral American IndianCherokeeCheyenneChickasawChileanChineseChippewaChoctawColombianColvilleComancheCosta RicanCreeCreekCroatianCrowCubanCypriotCzechCzechoslovakianDanishDelawareDominicanDutchDutch West IndianEastern EuropeanEcuadorianEgyptianEnglishEstonianEthiopianEuropeanFijianFilipinoFinnishFrenchFrench American IndianFrench CanadianGermanGerman RussianGhanaianGreekGuamanian / ChamorroGuatemalanGuyaneseHaitianHmongHonduranHopiHoumaHungarianIcelanderIndian (Asian)IndonesianInupiatIranianIraqiIrishIroquoisIsraeliItalianJamaicanJapaneseJordanianKenyanKiowaKoreanLaotianLatvianLebaneseLiberianLithuanianLumbeeLuxembourgerMacedonianMalaysianMalteseMarshalleseMenomineeMexicanMexican American IndianMongolianMoroccanNative HawaiianNavajoNepaleseNew ZealanderNicaraguanNigerianNorthern EuropeanNorwegianOkinawanOsageOttawaPaiutePakistaniPalestinianPanamanianParaguayanPennsylvania GermanPeruvianPimaPolishPortuguesePotawatomiPuebloPuerto RicanPuget Sound SalishRomanianRussianSalvadoranSamoanScandinavianScotch-IrishScottishSeminoleSenegaleseSerbianShoshoneSierra LeoneanSiouxSlavicSlovakSloveneSomaliSouth AfricanSouth AmericanSouth American IndianSoviet UnionSpaniardSpanishSpanish AmericanSpanish American IndianSri LankanSubsaharan AfricanSudaneseSwedishSwissSyrianTaiwaneseThaiTlingit-HaidaTohono O'OdhamTonganTrinidadian and TobagonianTsimshianTurkishU.S. Virgin IslanderUgandanUkrainianUruguayanUteVenezuelanVietnameseWelshWest IndianYakamaYaquiYugoslavianYumanYup'ikZimbabwean
Immigrant Origin (Total)
AfghanistanAfricaAlbaniaArgentinaArmeniaAsiaAustraliaAustriaAzoresBahamasBangladeshBarbadosBelarusBelgiumBelizeBoliviaBosnia and HerzegovinaBrazilBulgariaBurma / MyanmarCabo VerdeCambodiaCameroonCanadaCaribbeanCentral AmericaChileChinaColombiaCongoCosta RicaCroatiaCubaCzechoslovakiaDenmarkDominicaDominican RepublicEastern AfricaEastern AsiaEastern EuropeEcuadorEgyptEl SalvadorEnglandEritreaEthiopiaEuropeFijiFranceGermanyGhanaGreeceGrenadaGuatemalaGuyanaHaitiHondurasHong KongHungaryIndiaIndonesiaIranIraqIrelandIsraelItalyJamaicaJapanJordanKazakhstanKenyaKoreaKuwaitLaosLatin AmericaLatviaLebanonLiberiaLithuaniaMalaysiaMexicoMicronesiaMiddle AfricaMoldovaMoroccoNepalNetherlandsNicaraguaNigeriaNorth MacedoniaNorthern AfricaNorthern EuropeNorwayOceaniaPakistanPanamaPeruPhilippinesPolandPortugalRomaniaRussiaSaudi ArabiaScotlandSenegalSerbiaSierra LeoneSingaporeSomaliaSouth AfricaSouth AmericaSouth Central AsiaSouth Eastern AsiaSouthern EuropeSpainSri LankaSt. Vincent and the GrenadinesSudanSwedenSwitzerlandSyriaTaiwanThailandTrinidad and TobagoTurkeyUgandaUkraineUruguayUzbekistanVenezuelaVietnamWest IndiesWestern AfricaWestern AsiaWestern EuropeYemenZaireZimbabwe
Immigrant Origin (Percentage)
AfghanistanAfricaAlbaniaArgentinaArmeniaAsiaAustraliaAustriaAzoresBahamasBangladeshBarbadosBelarusBelgiumBelizeBoliviaBosnia and HerzegovinaBrazilBulgariaBurma / MyanmarCabo VerdeCambodiaCameroonCanadaCaribbeanCentral AmericaChileChinaColombiaCongoCosta RicaCroatiaCubaCzechoslovakiaDenmarkDominicaDominican RepublicEastern AfricaEastern AsiaEastern EuropeEcuadorEgyptEl SalvadorEnglandEritreaEthiopiaEuropeFijiFranceGermanyGhanaGreeceGrenadaGuatemalaGuyanaHaitiHondurasHong KongHungaryIndiaIndonesiaIranIraqIrelandIsraelItalyJamaicaJapanJordanKazakhstanKenyaKoreaKuwaitLaosLatin AmericaLatviaLebanonLiberiaLithuaniaMalaysiaMexicoMicronesiaMiddle AfricaMoldovaMoroccoNepalNetherlandsNicaraguaNigeriaNorth MacedoniaNorthern AfricaNorthern EuropeNorwayOceaniaPakistanPanamaPeruPhilippinesPolandPortugalRomaniaRussiaSaudi ArabiaScotlandSenegalSerbiaSierra LeoneSingaporeSomaliaSouth AfricaSouth AmericaSouth Central AsiaSouth Eastern AsiaSouthern EuropeSpainSri LankaSt. Vincent and the GrenadinesSudanSwedenSwitzerlandSyriaTaiwanThailandTrinidad and TobagoTurkeyUgandaUkraineUruguayUzbekistanVenezuelaVietnamWest IndiesWestern AfricaWestern AsiaWestern EuropeYemenZaireZimbabwe
Income
Income (Families)
Income (Households)
Poverty
Poverty (Families)
Unemployment
Employment Occupations
Employment Industries
Employer Class
Commute Time
Commute Means
School Enrollment
Education by Degree Field
Occupancy
Finances
Physical Characteristics
Washington
Compare Cities
Comparison Subject

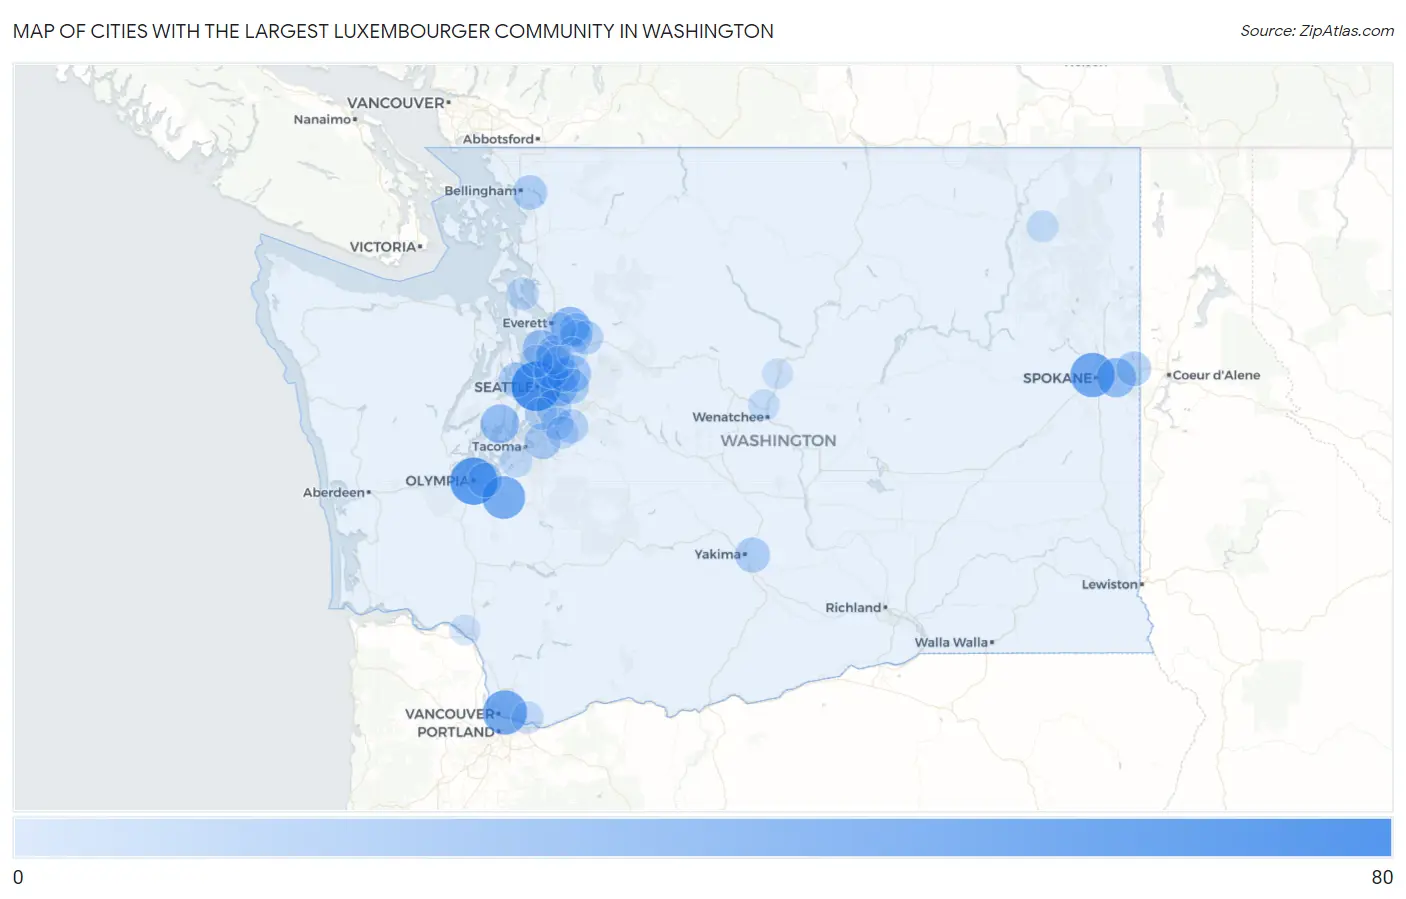
Map of Cities with the Largest Luxembourger Community in Washington

0
80
Cities with the Largest Luxembourger Community in Washington Map

Cities with the Largest Luxembourger Community in Washington

City Luxembourger vs State vs National
1.Seattle69899(7.68%)#142,059(0.16%)#82
2.Olympia61899(6.79%)#242,059(0.15%)#102
3.Spokane50899(5.56%)#342,059(0.12%)#135
4.Vancouver50899(5.56%)#442,059(0.12%)#136
5.Yelm45899(5.01%)#542,059(0.11%)#166
6.Spokane Valley32899(3.56%)#642,059(0.08%)#244
7.Everett31899(3.45%)#742,059(0.07%)#258
8.Wauna30899(3.34%)#842,059(0.07%)#275
9.Bellevue26899(2.89%)#942,059(0.06%)#308
10.Lynnwood25899(2.78%)#1042,059(0.06%)#324
11.Union Hill Novelty Hill24899(2.67%)#1142,059(0.06%)#331
12.Lakeland South20899(2.22%)#1242,059(0.05%)#400
13.Renton18899(2.00%)#1342,059(0.04%)#437
14.Sammamish18899(2.00%)#1442,059(0.04%)#439
15.Fairwood Cdp King County18899(2.00%)#1542,059(0.04%)#449
16.Bainbridge Island17899(1.89%)#1642,059(0.04%)#469
17.Terrace Heights17899(1.89%)#1742,059(0.04%)#475
18.Lacey16899(1.78%)#1842,059(0.04%)#488
19.Otis Orchards East Farms16899(1.78%)#1942,059(0.04%)#498
20.Geneva16899(1.78%)#2042,059(0.04%)#502
21.Kirkland15899(1.67%)#2142,059(0.04%)#511
22.Bothell East15899(1.67%)#2242,059(0.04%)#538
23.Three Lakes14899(1.56%)#2342,059(0.03%)#589
24.Redmond13899(1.45%)#2442,059(0.03%)#600
25.Bothell13899(1.45%)#2542,059(0.03%)#605
26.Maple Valley13899(1.45%)#2642,059(0.03%)#609
27.Woods Creek13899(1.45%)#2742,059(0.03%)#626
28.Woodinville11899(1.22%)#2842,059(0.03%)#700
29.Shoreline10899(1.11%)#2942,059(0.02%)#725
30.Camano9899(1.00%)#3042,059(0.02%)#793
31.Chain Lake9899(1.00%)#3142,059(0.02%)#805
32.Fobes Hill9899(1.00%)#3242,059(0.02%)#808
33.Kent8899(0.89%)#3342,059(0.02%)#823
34.Lakewood8899(0.89%)#3442,059(0.02%)#832
35.Seatac8899(0.89%)#3542,059(0.02%)#844
36.Camas8899(0.89%)#3642,059(0.02%)#847
37.Lake Morton Berrydale8899(0.89%)#3742,059(0.02%)#859
38.Colville6899(0.67%)#3842,059(0.01%)#964
39.Sunnyslope5899(0.56%)#3942,059(0.01%)#1,021
40.Longview3899(0.33%)#4042,059(0.01%)#1,128
41.High Bridge2899(0.22%)#4142,059(0.00%)#1,210
42.Entiat2899(0.22%)#4242,059(0.00%)#1,230

Common Questions

What are the Top 10 Cities with the Largest Luxembourger Community in Washington?
Top 10 Cities with the Largest Luxembourger Community in Washington are:
What city has the Largest Luxembourger Community in Washington?
Seattle has the Largest Luxembourger Community in Washington with 69.
What is the Total Luxembourger Population in the State of Washington?
Total Luxembourger Population in Washington is 899.
What is the Total Luxembourger Population in the United States?
Total Luxembourger Population in the United States is 42,059.