Cities with the Highest Percentage of Immigrants from Central America in Washington
RELATED REPORTS & OPTIONS
Central America
Washington
Compare Cities
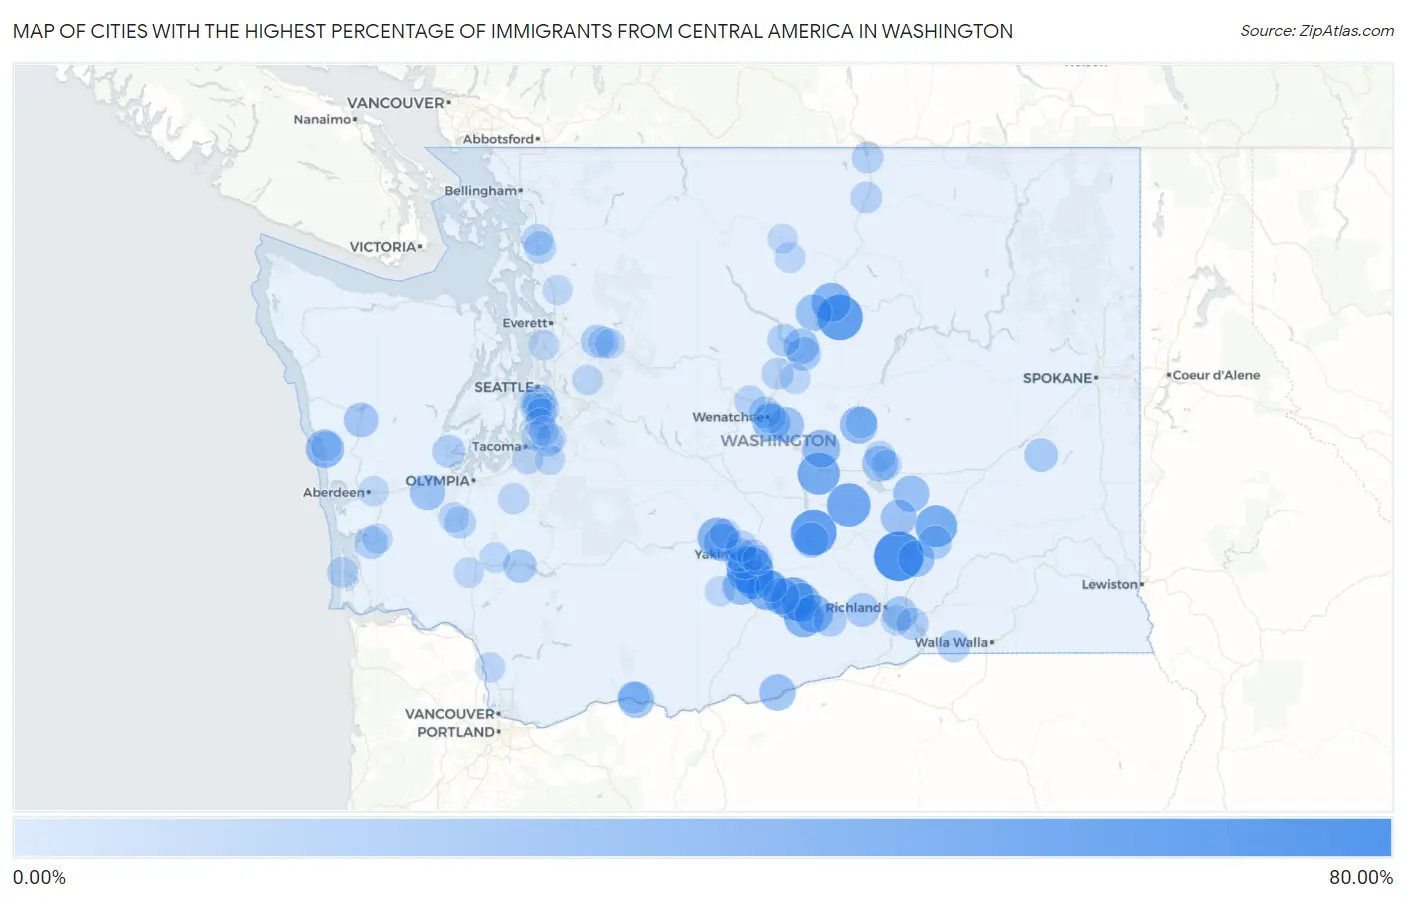
Map of Cities with the Highest Percentage of Immigrants from Central America in Washington
0.00%
80.00%
Cities with the Highest Percentage of Immigrants from Central America in Washington
| City | Central America | vs State | vs National | |
| 1. | Basin City | 62.93% | 3.65%(+59.3)#-1 | 4.37%(+58.6)#0 |
| 2. | Parker | 54.44% | 3.65%(+50.8)#0 | 4.37%(+50.1)#1 |
| 3. | Mattawa | 51.45% | 3.65%(+47.8)#1 | 4.37%(+47.1)#2 |
| 4. | Bridgeport | 51.16% | 3.65%(+47.5)#2 | 4.37%(+46.8)#3 |
| 5. | Royal City | 45.10% | 3.65%(+41.4)#3 | 4.37%(+40.7)#4 |
| 6. | Outlook | 43.53% | 3.65%(+39.9)#4 | 4.37%(+39.2)#5 |
| 7. | George | 40.70% | 3.65%(+37.0)#5 | 4.37%(+36.3)#6 |
| 8. | Hatton | 40.04% | 3.65%(+36.4)#6 | 4.37%(+35.7)#7 |
| 9. | Toppenish | 35.62% | 3.65%(+32.0)#7 | 4.37%(+31.3)#8 |
| 10. | Beverly | 34.42% | 3.65%(+30.8)#8 | 4.37%(+30.0)#9 |
| 11. | Tieton | 33.64% | 3.65%(+30.0)#9 | 4.37%(+29.3)#10 |
| 12. | Mabton | 33.28% | 3.65%(+29.6)#10 | 4.37%(+28.9)#11 |
| 13. | Brewster | 32.40% | 3.65%(+28.7)#11 | 4.37%(+28.0)#12 |
| 14. | Sunnyside | 32.20% | 3.65%(+28.6)#12 | 4.37%(+27.8)#13 |
| 15. | Wapato | 31.52% | 3.65%(+27.9)#13 | 4.37%(+27.2)#14 |
| 16. | Moclips | 29.49% | 3.65%(+25.8)#14 | 4.37%(+25.1)#15 |
| 17. | Grandview | 29.14% | 3.65%(+25.5)#15 | 4.37%(+24.8)#16 |
| 18. | Quincy | 27.78% | 3.65%(+24.1)#16 | 4.37%(+23.4)#17 |
| 19. | Lakeview | 27.14% | 3.65%(+23.5)#17 | 4.37%(+22.8)#18 |
| 20. | South Wenatchee | 27.07% | 3.65%(+23.4)#18 | 4.37%(+22.7)#19 |
| 21. | Cowiche | 26.97% | 3.65%(+23.3)#19 | 4.37%(+22.6)#20 |
| 22. | Harrah | 26.72% | 3.65%(+23.1)#20 | 4.37%(+22.3)#21 |
| 23. | Granger | 24.70% | 3.65%(+21.0)#21 | 4.37%(+20.3)#22 |
| 24. | Roosevelt | 23.96% | 3.65%(+20.3)#22 | 4.37%(+19.6)#23 |
| 25. | Warden | 23.72% | 3.65%(+20.1)#23 | 4.37%(+19.4)#24 |
| 26. | Mesa | 23.71% | 3.65%(+20.1)#24 | 4.37%(+19.3)#25 |
| 27. | Pateros | 23.50% | 3.65%(+19.9)#25 | 4.37%(+19.1)#26 |
| 28. | Bingen | 22.72% | 3.65%(+19.1)#26 | 4.37%(+18.4)#27 |
| 29. | Othello | 22.36% | 3.65%(+18.7)#27 | 4.37%(+18.0)#28 |
| 30. | Cascade Valley | 22.13% | 3.65%(+18.5)#28 | 4.37%(+17.8)#29 |
| 31. | Rock Island | 21.84% | 3.65%(+18.2)#29 | 4.37%(+17.5)#30 |
| 32. | Malone | 20.53% | 3.65%(+16.9)#30 | 4.37%(+16.2)#31 |
| 33. | Chelan | 20.38% | 3.65%(+16.7)#31 | 4.37%(+16.0)#32 |
| 34. | Desert Aire | 20.12% | 3.65%(+16.5)#32 | 4.37%(+15.7)#33 |
| 35. | Neilton | 18.71% | 3.65%(+15.1)#33 | 4.37%(+14.3)#34 |
| 36. | Pasco | 18.30% | 3.65%(+14.6)#34 | 4.37%(+13.9)#35 |
| 37. | Chelan Falls | 16.98% | 3.65%(+13.3)#35 | 4.37%(+12.6)#36 |
| 38. | Benton City | 16.78% | 3.65%(+13.1)#36 | 4.37%(+12.4)#37 |
| 39. | Connell | 16.04% | 3.65%(+12.4)#37 | 4.37%(+11.7)#38 |
| 40. | Union Gap | 15.77% | 3.65%(+12.1)#38 | 4.37%(+11.4)#39 |
| 41. | Lamont | 15.72% | 3.65%(+12.1)#39 | 4.37%(+11.4)#40 |
| 42. | Mossyrock | 15.37% | 3.65%(+11.7)#40 | 4.37%(+11.0)#41 |
| 43. | Yakima | 15.28% | 3.65%(+11.6)#41 | 4.37%(+10.9)#42 |
| 44. | Boulevard Park | 14.69% | 3.65%(+11.0)#42 | 4.37%(+10.3)#43 |
| 45. | Prosser | 14.52% | 3.65%(+10.9)#43 | 4.37%(+10.1)#44 |
| 46. | Sultan | 14.13% | 3.65%(+10.5)#44 | 4.37%(+9.76)#45 |
| 47. | Shelton | 13.65% | 3.65%(+10.0)#45 | 4.37%(+9.28)#46 |
| 48. | South Bend | 13.56% | 3.65%(+9.91)#46 | 4.37%(+9.19)#47 |
| 49. | Manson | 13.14% | 3.65%(+9.49)#47 | 4.37%(+8.77)#48 |
| 50. | White Salmon | 12.30% | 3.65%(+8.65)#48 | 4.37%(+7.93)#49 |
| 51. | Finley | 12.09% | 3.65%(+8.44)#49 | 4.37%(+7.72)#50 |
| 52. | Touchet | 11.75% | 3.65%(+8.10)#50 | 4.37%(+7.38)#51 |
| 53. | Wenatchee | 11.53% | 3.65%(+7.89)#51 | 4.37%(+7.16)#52 |
| 54. | Mount Vernon | 11.31% | 3.65%(+7.66)#52 | 4.37%(+6.94)#53 |
| 55. | East Wenatchee | 11.08% | 3.65%(+7.43)#53 | 4.37%(+6.71)#54 |
| 56. | Grand Mound | 11.07% | 3.65%(+7.42)#54 | 4.37%(+6.70)#55 |
| 57. | Entiat | 10.98% | 3.65%(+7.33)#55 | 4.37%(+6.61)#56 |
| 58. | Schwana | 10.83% | 3.65%(+7.18)#56 | 4.37%(+6.46)#57 |
| 59. | Zillah | 10.56% | 3.65%(+6.91)#57 | 4.37%(+6.19)#58 |
| 60. | Burlington | 10.54% | 3.65%(+6.90)#58 | 4.37%(+6.17)#59 |
| 61. | Soap Lake | 10.30% | 3.65%(+6.66)#59 | 4.37%(+5.93)#60 |
| 62. | Tonasket | 10.20% | 3.65%(+6.55)#60 | 4.37%(+5.83)#61 |
| 63. | Oroville | 10.15% | 3.65%(+6.51)#61 | 4.37%(+5.78)#62 |
| 64. | White Center | 10.05% | 3.65%(+6.40)#62 | 4.37%(+5.68)#63 |
| 65. | Selah | 10.01% | 3.65%(+6.36)#63 | 4.37%(+5.64)#64 |
| 66. | Cashmere | 9.86% | 3.65%(+6.22)#64 | 4.37%(+5.49)#65 |
| 67. | Terrace Heights | 9.85% | 3.65%(+6.20)#65 | 4.37%(+5.48)#66 |
| 68. | Tukwila | 9.45% | 3.65%(+5.80)#66 | 4.37%(+5.08)#67 |
| 69. | Burien | 9.35% | 3.65%(+5.70)#67 | 4.37%(+4.98)#68 |
| 70. | Startup | 9.06% | 3.65%(+5.41)#68 | 4.37%(+4.69)#69 |
| 71. | Mckenna | 8.84% | 3.65%(+5.20)#69 | 4.37%(+4.47)#70 |
| 72. | Midland | 8.64% | 3.65%(+5.00)#70 | 4.37%(+4.27)#71 |
| 73. | Seatac | 8.55% | 3.65%(+4.90)#71 | 4.37%(+4.18)#72 |
| 74. | Ocean Park | 8.39% | 3.65%(+4.75)#72 | 4.37%(+4.02)#73 |
| 75. | Moses Lake North | 8.31% | 3.65%(+4.66)#73 | 4.37%(+3.94)#74 |
| 76. | Algona | 8.24% | 3.65%(+4.59)#74 | 4.37%(+3.87)#75 |
| 77. | Des Moines | 7.84% | 3.65%(+4.19)#75 | 4.37%(+3.47)#76 |
| 78. | Kennewick | 7.77% | 3.65%(+4.13)#76 | 4.37%(+3.40)#77 |
| 79. | North Lynnwood | 7.77% | 3.65%(+4.12)#77 | 4.37%(+3.40)#78 |
| 80. | Twisp | 7.76% | 3.65%(+4.11)#78 | 4.37%(+3.39)#79 |
| 81. | Waterville | 7.66% | 3.65%(+4.01)#79 | 4.37%(+3.29)#80 |
| 82. | Onalaska | 7.51% | 3.65%(+3.86)#80 | 4.37%(+3.14)#81 |
| 83. | Rochester | 7.45% | 3.65%(+3.80)#81 | 4.37%(+3.08)#82 |
| 84. | Moses Lake | 7.12% | 3.65%(+3.47)#82 | 4.37%(+2.75)#83 |
| 85. | Carnation | 7.08% | 3.65%(+3.43)#83 | 4.37%(+2.71)#84 |
| 86. | Naches | 7.00% | 3.65%(+3.35)#84 | 4.37%(+2.63)#85 |
| 87. | Auburn | 6.66% | 3.65%(+3.01)#85 | 4.37%(+2.29)#86 |
| 88. | Woodland | 6.51% | 3.65%(+2.87)#86 | 4.37%(+2.14)#87 |
| 89. | Aberdeen | 6.51% | 3.65%(+2.86)#87 | 4.37%(+2.14)#88 |
| 90. | Moxee | 6.46% | 3.65%(+2.81)#88 | 4.37%(+2.09)#89 |
| 91. | Winlock | 6.44% | 3.65%(+2.79)#89 | 4.37%(+2.07)#90 |
| 92. | Federal Way | 6.40% | 3.65%(+2.76)#90 | 4.37%(+2.03)#91 |
| 93. | Gold Bar | 6.37% | 3.65%(+2.72)#91 | 4.37%(+2.00)#92 |
| 94. | Raymond | 6.37% | 3.65%(+2.72)#92 | 4.37%(+2.00)#93 |
| 95. | White Swan | 6.24% | 3.65%(+2.59)#93 | 4.37%(+1.87)#94 |
| 96. | Qui Nai Elt Village | 6.12% | 3.65%(+2.47)#94 | 4.37%(+1.75)#95 |
| 97. | Alderton | 5.99% | 3.65%(+2.35)#95 | 4.37%(+1.62)#96 |
| 98. | Lakeland North | 5.96% | 3.65%(+2.31)#96 | 4.37%(+1.59)#97 |
| 99. | Winthrop | 5.88% | 3.65%(+2.23)#97 | 4.37%(+1.51)#98 |
| 100. | Arlington | 5.85% | 3.65%(+2.21)#98 | 4.37%(+1.48)#105 |
Common Questions
What are the Top 10 Cities with the Highest Percentage of Immigrants from Central America in Washington?
Top 10 Cities with the Highest Percentage of Immigrants from Central America in Washington are:
#1
62.93%
#2
54.44%
#3
51.45%
#4
51.16%
#5
45.10%
#6
43.53%
#7
40.70%
#8
40.04%
#9
35.62%
#10
33.64%
What city has the Highest Percentage of Immigrants from Central America in Washington?
Basin City has the Highest Percentage of Immigrants from Central America in Washington with 62.93%.
What is the Percentage of Immigrants from Central America in the State of Washington?
Percentage of Immigrants from Central America in Washington is 3.65%.
What is the Percentage of Immigrants from Central America in the United States?
Percentage of Immigrants from Central America in the United States is 4.37%.