Amboy, WA Map & Demographics
Amboy Map
Amboy Overview
$40,801
PER CAPITA INCOME
$169,375
AVG FAMILY INCOME
$138,021
AVG HOUSEHOLD INCOME
55.9%
WAGE / INCOME GAP [ % ]
44.1¢/ $1
WAGE / INCOME GAP [ $ ]
0.39
INEQUALITY / GINI INDEX
1,680
TOTAL POPULATION
699
MALE POPULATION
981
FEMALE POPULATION
71.25
MALES / 100 FEMALES
140.34
FEMALES / 100 MALES
30.6
MEDIAN AGE
4.2
AVG FAMILY SIZE
3.2
AVG HOUSEHOLD SIZE
794
LABOR FORCE [ PEOPLE ]
61.8%
PERCENT IN LABOR FORCE
4.2%
UNEMPLOYMENT RATE
Amboy Zip Codes
Amboy Area Codes
Income in Amboy
Income Overview in Amboy
Per Capita Income in Amboy is $40,801, while median incomes of families and households are $169,375 and $138,021 respectively.
| Characteristic | Number | Measure |
| Per Capita Income | 1,680 | $40,801 |
| Median Family Income | 355 | $169,375 |
| Mean Family Income | 355 | $164,690 |
| Median Household Income | 524 | $138,021 |
| Mean Household Income | 524 | $125,375 |
| Income Deficit | 355 | $0 |
| Wage / Income Gap (%) | 1,680 | 55.93% |
| Wage / Income Gap ($) | 1,680 | 44.07¢ per $1 |
| Gini / Inequality Index | 1,680 | 0.39 |
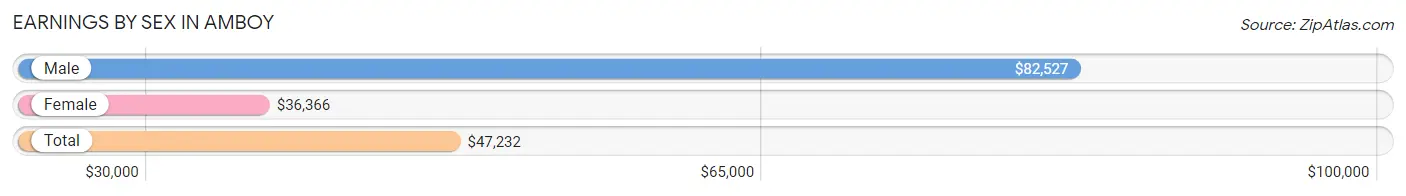
Earnings by Sex in Amboy
Average Earnings in Amboy are $47,232, $82,527 for men and $36,366 for women, a difference of 55.9%.
| Sex | Number | Average Earnings |
| Male | 463 (56.6%) | $82,527 |
| Female | 355 (43.4%) | $36,366 |
| Total | 818 (100.0%) | $47,232 |
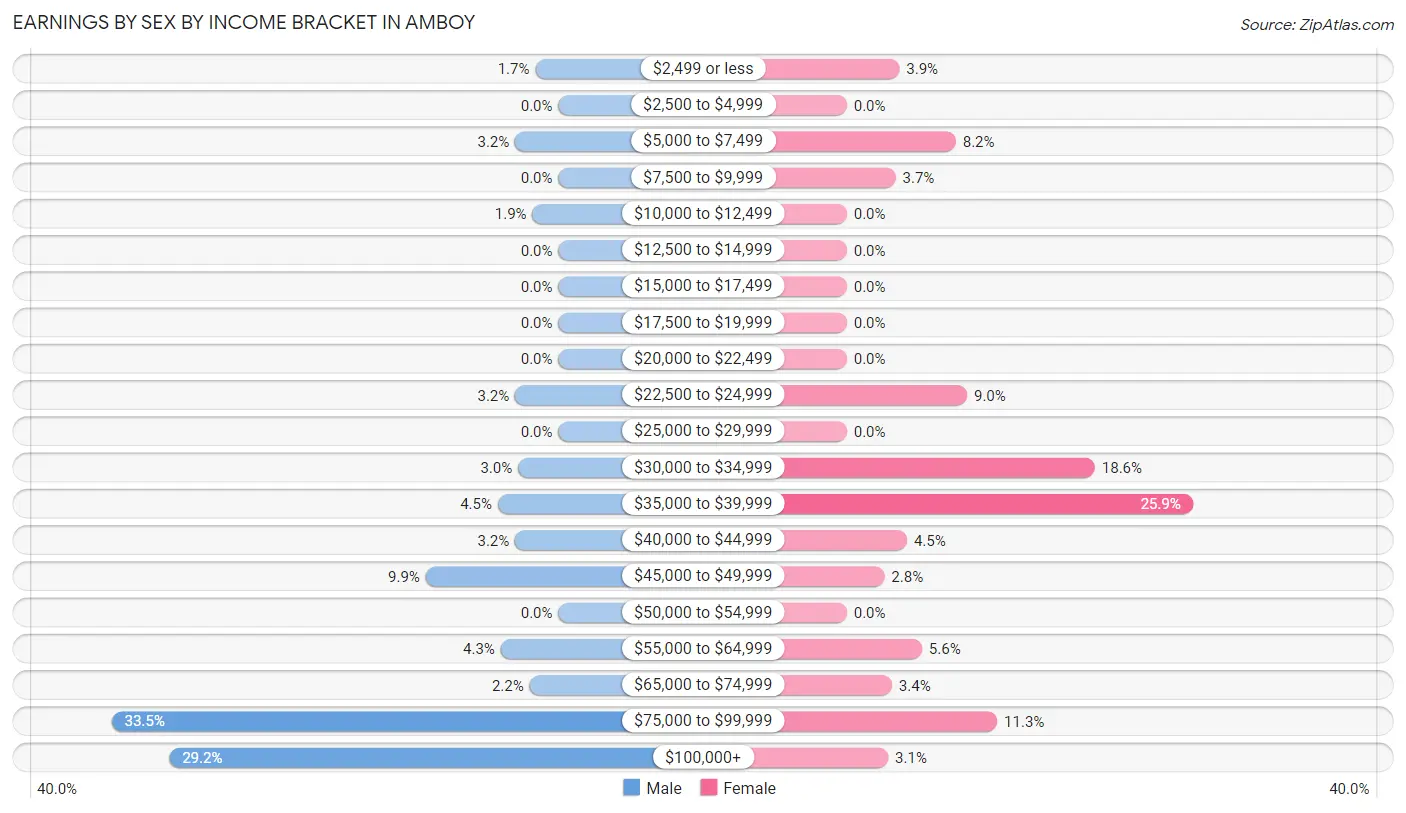
Earnings by Sex by Income Bracket in Amboy
The most common earnings brackets in Amboy are $75,000 to $99,999 for men (155 | 33.5%) and $35,000 to $39,999 for women (92 | 25.9%).
| Income | Male | Female |
| $2,499 or less | 8 (1.7%) | 14 (3.9%) |
| $2,500 to $4,999 | 0 (0.0%) | 0 (0.0%) |
| $5,000 to $7,499 | 15 (3.2%) | 29 (8.2%) |
| $7,500 to $9,999 | 0 (0.0%) | 13 (3.7%) |
| $10,000 to $12,499 | 9 (1.9%) | 0 (0.0%) |
| $12,500 to $14,999 | 0 (0.0%) | 0 (0.0%) |
| $15,000 to $17,499 | 0 (0.0%) | 0 (0.0%) |
| $17,500 to $19,999 | 0 (0.0%) | 0 (0.0%) |
| $20,000 to $22,499 | 0 (0.0%) | 0 (0.0%) |
| $22,500 to $24,999 | 15 (3.2%) | 32 (9.0%) |
| $25,000 to $29,999 | 0 (0.0%) | 0 (0.0%) |
| $30,000 to $34,999 | 14 (3.0%) | 66 (18.6%) |
| $35,000 to $39,999 | 21 (4.5%) | 92 (25.9%) |
| $40,000 to $44,999 | 15 (3.2%) | 16 (4.5%) |
| $45,000 to $49,999 | 46 (9.9%) | 10 (2.8%) |
| $50,000 to $54,999 | 0 (0.0%) | 0 (0.0%) |
| $55,000 to $64,999 | 20 (4.3%) | 20 (5.6%) |
| $65,000 to $74,999 | 10 (2.2%) | 12 (3.4%) |
| $75,000 to $99,999 | 155 (33.5%) | 40 (11.3%) |
| $100,000+ | 135 (29.2%) | 11 (3.1%) |
| Total | 463 (100.0%) | 355 (100.0%) |
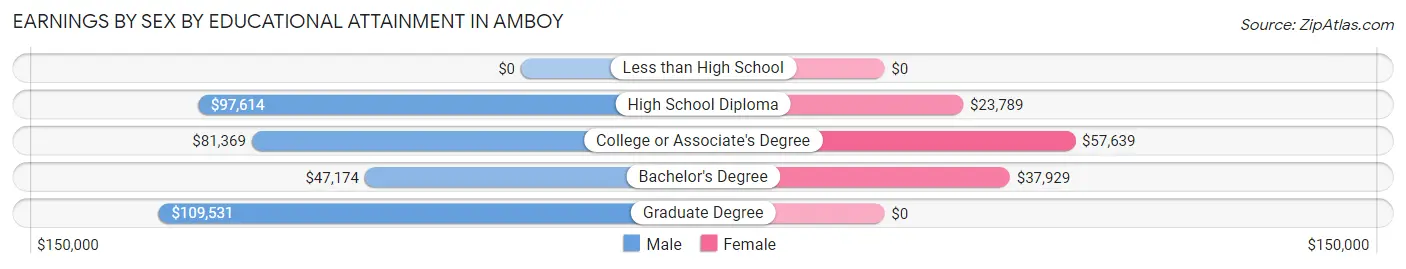
Earnings by Sex by Educational Attainment in Amboy
Average earnings in Amboy are $84,309 for men and $38,673 for women, a difference of 54.1%. Men with an educational attainment of graduate degree enjoy the highest average annual earnings of $109,531, while those with bachelor's degree education earn the least with $47,174. Women with an educational attainment of college or associate's degree earn the most with the average annual earnings of $57,639, while those with high school diploma education have the smallest earnings of $23,789.
| Educational Attainment | Male Income | Female Income |
| Less than High School | - | - |
| High School Diploma | $97,614 | $23,789 |
| College or Associate's Degree | $81,369 | $57,639 |
| Bachelor's Degree | $47,174 | $37,929 |
| Graduate Degree | $109,531 | $0 |
| Total | $84,309 | $38,673 |
Family Income in Amboy
Family Income Brackets in Amboy
According to the Amboy family income data, there are 118 families falling into the $100,000 to $149,999 income range, which is the most common income bracket and makes up 33.2% of all families.
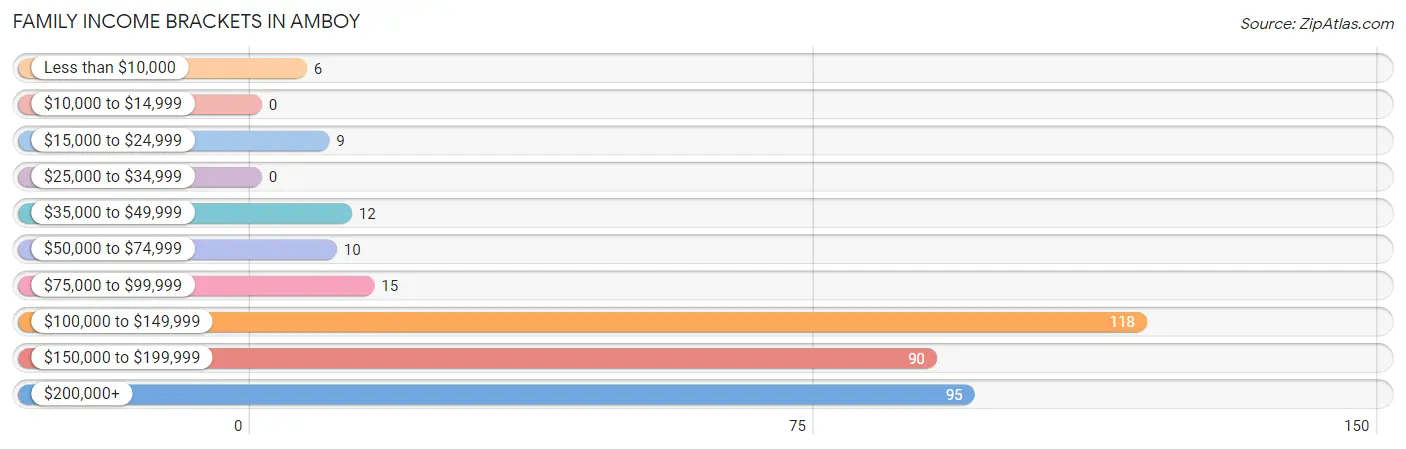
| Income Bracket | # Families | % Families |
| Less than $10,000 | 6 | 1.7% |
| $10,000 to $14,999 | 0 | 0.0% |
| $15,000 to $24,999 | 9 | 2.5% |
| $25,000 to $34,999 | 0 | 0.0% |
| $35,000 to $49,999 | 12 | 3.4% |
| $50,000 to $74,999 | 10 | 2.8% |
| $75,000 to $99,999 | 15 | 4.2% |
| $100,000 to $149,999 | 118 | 33.2% |
| $150,000 to $199,999 | 90 | 25.4% |
| $200,000+ | 95 | 26.8% |
Family Income by Famaliy Size in Amboy
5-person families (95 | 26.8%) account for the highest median family income in Amboy with $192,396 per family, while 2-person families (143 | 40.3%) have the highest median income of $84,062 per family member.
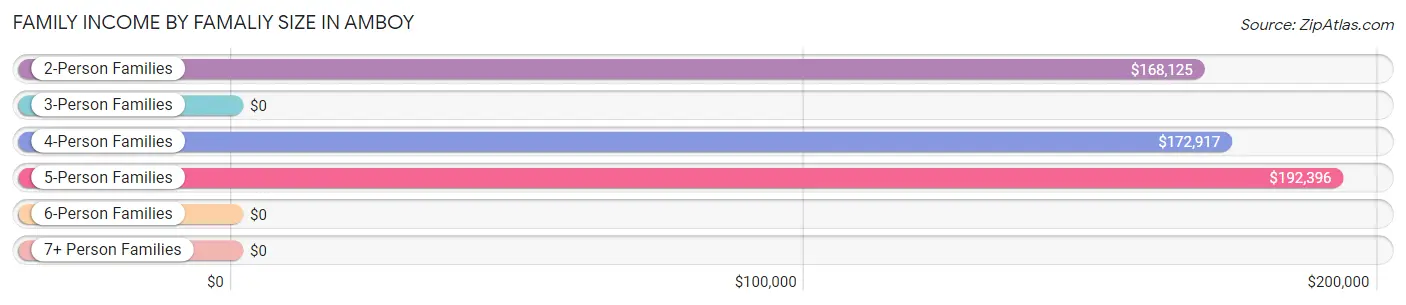
| Income Bracket | # Families | Median Income |
| 2-Person Families | 143 (40.3%) | $168,125 |
| 3-Person Families | 12 (3.4%) | $0 |
| 4-Person Families | 58 (16.3%) | $172,917 |
| 5-Person Families | 95 (26.8%) | $192,396 |
| 6-Person Families | 23 (6.5%) | $0 |
| 7+ Person Families | 24 (6.8%) | $0 |
| Total | 355 (100.0%) | $169,375 |
Family Income by Number of Earners in Amboy
The median family income in Amboy is $169,375, with families comprising 3+ earners (88) having the highest median family income of $214,202, while families with 1 earner (68) have the lowest median family income of $123,611, accounting for 24.8% and 19.2% of families, respectively.
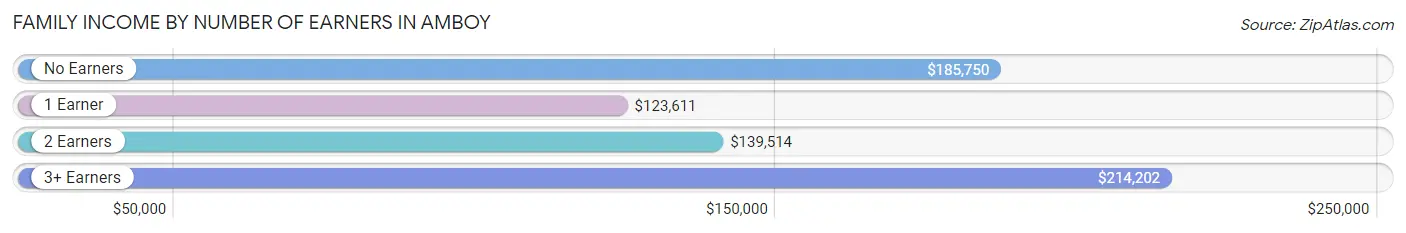
| Number of Earners | # Families | Median Income |
| No Earners | 65 (18.3%) | $185,750 |
| 1 Earner | 68 (19.2%) | $123,611 |
| 2 Earners | 134 (37.8%) | $139,514 |
| 3+ Earners | 88 (24.8%) | $214,202 |
| Total | 355 (100.0%) | $169,375 |
Household Income in Amboy
Household Income Brackets in Amboy
With 133 households falling in the category, the $100,000 to $149,999 income range is the most frequent in Amboy, accounting for 25.4% of all households.
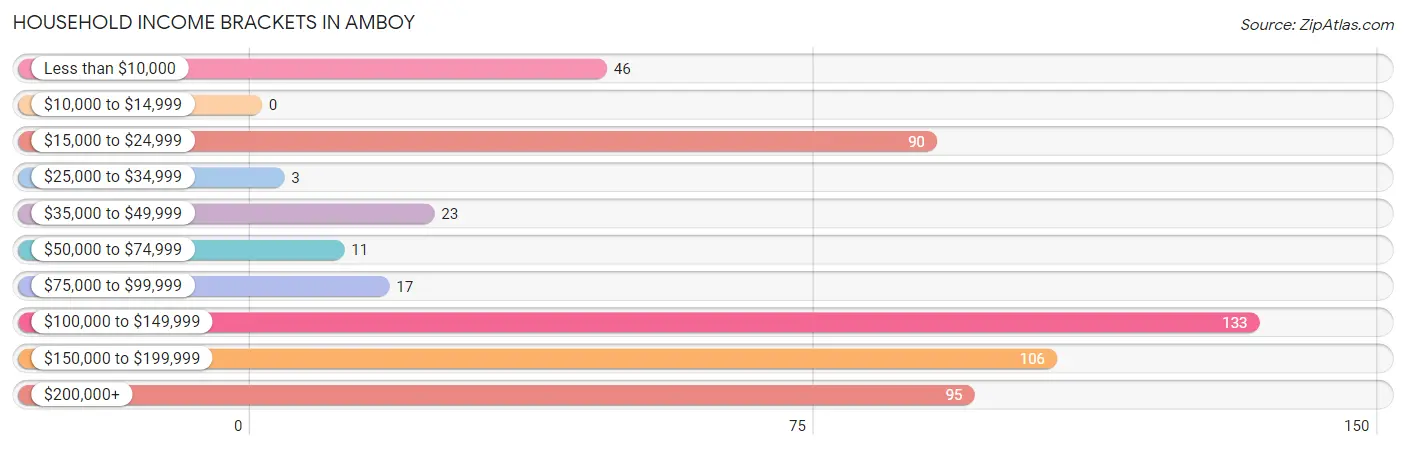
| Income Bracket | # Households | % Households |
| Less than $10,000 | 46 | 8.8% |
| $10,000 to $14,999 | 0 | 0.0% |
| $15,000 to $24,999 | 90 | 17.2% |
| $25,000 to $34,999 | 3 | 0.6% |
| $35,000 to $49,999 | 23 | 4.4% |
| $50,000 to $74,999 | 11 | 2.1% |
| $75,000 to $99,999 | 17 | 3.2% |
| $100,000 to $149,999 | 133 | 25.4% |
| $150,000 to $199,999 | 106 | 20.2% |
| $200,000+ | 95 | 18.1% |
Household Income by Householder Age in Amboy
The median household income in Amboy is $138,021, with the highest median household income of $190,217 found in the 45 to 64 years age bracket for the primary householder. A total of 214 households (40.8%) fall into this category.
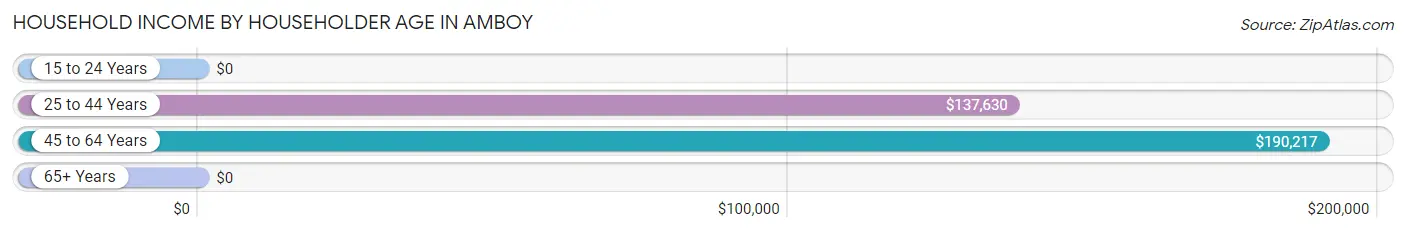
| Income Bracket | # Households | Median Income |
| 15 to 24 Years | 0 (0.0%) | $0 |
| 25 to 44 Years | 91 (17.4%) | $137,630 |
| 45 to 64 Years | 214 (40.8%) | $190,217 |
| 65+ Years | 219 (41.8%) | $0 |
| Total | 524 (100.0%) | $138,021 |
Poverty in Amboy
Income Below Poverty by Sex and Age in Amboy
With 3.9% poverty level for males and 6.2% for females among the residents of Amboy, 6 to 11 year old males and 75 year old and over females are the most vulnerable to poverty, with 12 males (12.5%) and 30 females (45.5%) in their respective age groups living below the poverty level.
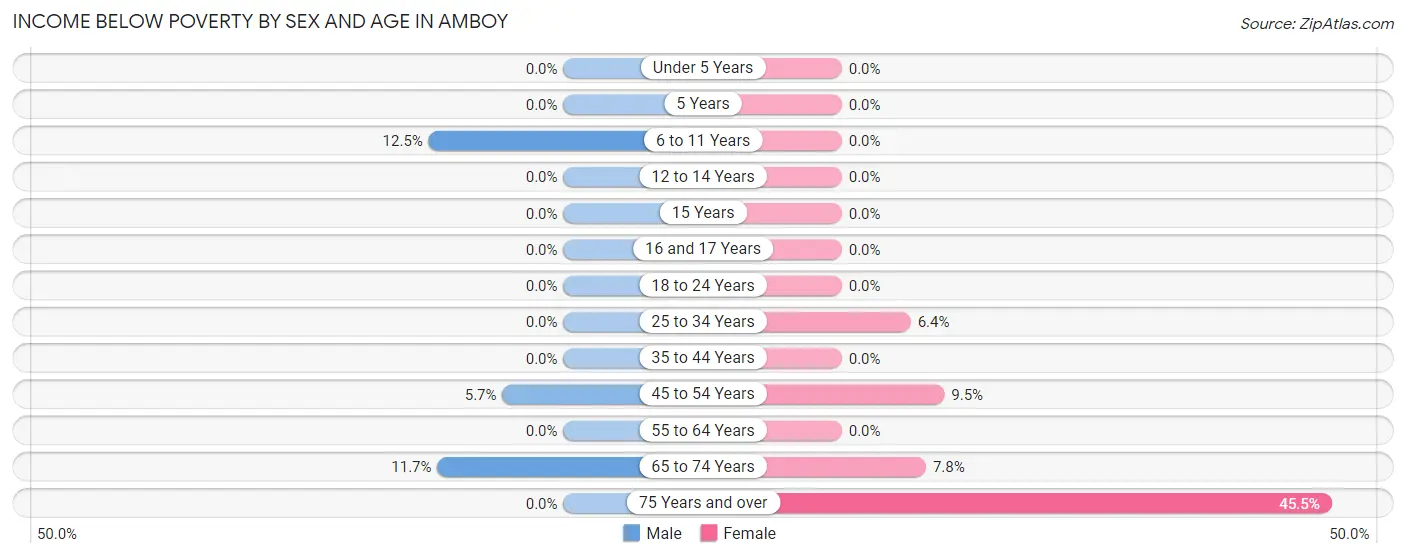
| Age Bracket | Male | Female |
| Under 5 Years | 0 (0.0%) | 0 (0.0%) |
| 5 Years | 0 (0.0%) | 0 (0.0%) |
| 6 to 11 Years | 12 (12.5%) | 0 (0.0%) |
| 12 to 14 Years | 0 (0.0%) | 0 (0.0%) |
| 15 Years | 0 (0.0%) | 0 (0.0%) |
| 16 and 17 Years | 0 (0.0%) | 0 (0.0%) |
| 18 to 24 Years | 0 (0.0%) | 0 (0.0%) |
| 25 to 34 Years | 0 (0.0%) | 11 (6.4%) |
| 35 to 44 Years | 0 (0.0%) | 0 (0.0%) |
| 45 to 54 Years | 6 (5.7%) | 10 (9.5%) |
| 55 to 64 Years | 0 (0.0%) | 0 (0.0%) |
| 65 to 74 Years | 9 (11.7%) | 10 (7.8%) |
| 75 Years and over | 0 (0.0%) | 30 (45.5%) |
| Total | 27 (3.9%) | 61 (6.2%) |
Income Above Poverty by Sex and Age in Amboy
According to the poverty statistics in Amboy, males aged under 5 years and females aged under 5 years are the age groups that are most secure financially, with 100.0% of males and 100.0% of females in these age groups living above the poverty line.
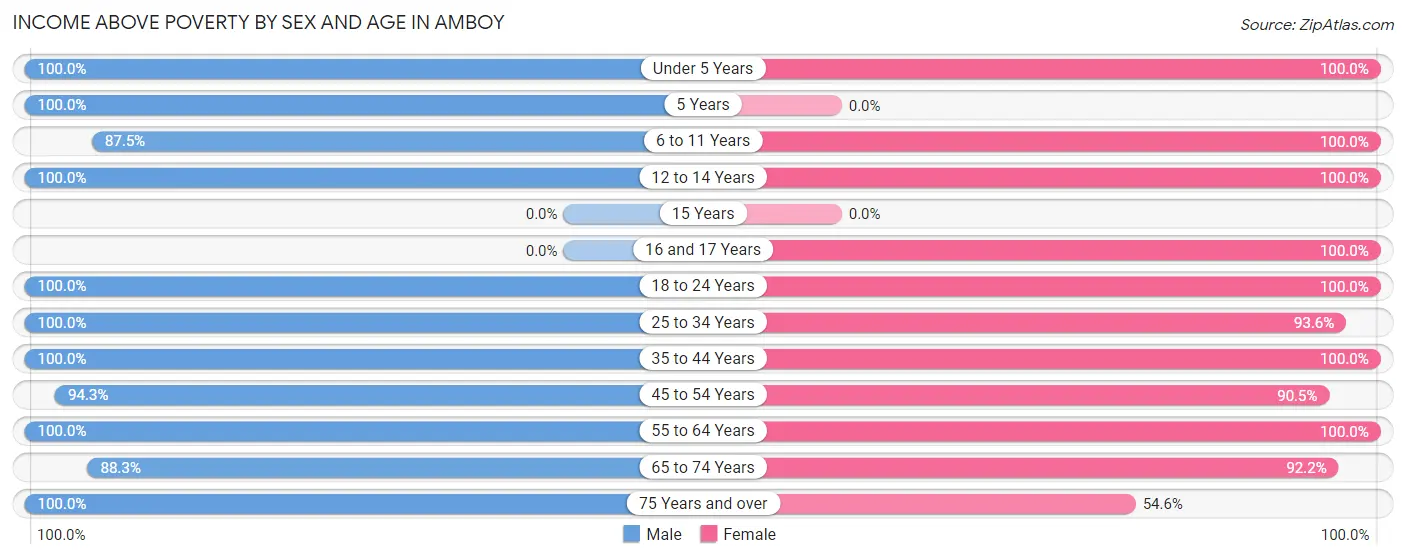
| Age Bracket | Male | Female |
| Under 5 Years | 15 (100.0%) | 141 (100.0%) |
| 5 Years | 10 (100.0%) | 0 (0.0%) |
| 6 to 11 Years | 84 (87.5%) | 95 (100.0%) |
| 12 to 14 Years | 26 (100.0%) | 12 (100.0%) |
| 15 Years | 0 (0.0%) | 0 (0.0%) |
| 16 and 17 Years | 0 (0.0%) | 30 (100.0%) |
| 18 to 24 Years | 77 (100.0%) | 132 (100.0%) |
| 25 to 34 Years | 125 (100.0%) | 161 (93.6%) |
| 35 to 44 Years | 56 (100.0%) | 27 (100.0%) |
| 45 to 54 Years | 100 (94.3%) | 95 (90.5%) |
| 55 to 64 Years | 107 (100.0%) | 73 (100.0%) |
| 65 to 74 Years | 68 (88.3%) | 118 (92.2%) |
| 75 Years and over | 4 (100.0%) | 36 (54.5%) |
| Total | 672 (96.1%) | 920 (93.8%) |
Income Below Poverty Among Married-Couple Families in Amboy
The poverty statistics for married-couple families in Amboy show that 3.1% or 9 of the total 294 families live below the poverty line. Families with no children have the highest poverty rate of 5.1%, comprising of 9 families. On the other hand, families with 1 or 2 children have the lowest poverty rate of 0.0%, which includes 0 families.
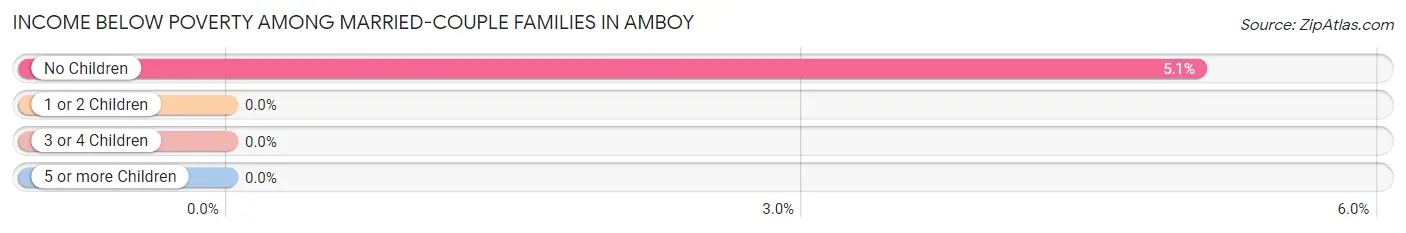
| Children | Above Poverty | Below Poverty |
| No Children | 169 (94.9%) | 9 (5.1%) |
| 1 or 2 Children | 40 (100.0%) | 0 (0.0%) |
| 3 or 4 Children | 62 (100.0%) | 0 (0.0%) |
| 5 or more Children | 14 (100.0%) | 0 (0.0%) |
| Total | 285 (96.9%) | 9 (3.1%) |
Income Below Poverty Among Single-Parent Households in Amboy
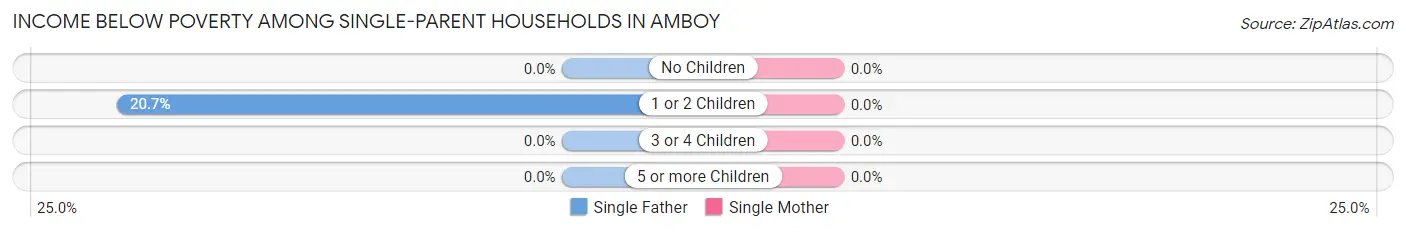
| Children | Single Father | Single Mother |
| No Children | 0 (0.0%) | 0 (0.0%) |
| 1 or 2 Children | 6 (20.7%) | 0 (0.0%) |
| 3 or 4 Children | 0 (0.0%) | 0 (0.0%) |
| 5 or more Children | 0 (0.0%) | 0 (0.0%) |
| Total | 6 (20.7%) | 0 (0.0%) |
Income Below Poverty Among Married-Couple vs Single-Parent Households in Amboy
The poverty data for Amboy shows that 9 of the married-couple family households (3.1%) and 6 of the single-parent households (9.8%) are living below the poverty level. Within the married-couple family households, those with no children have the highest poverty rate, with 9 households (5.1%) falling below the poverty line. Among the single-parent households, those with 1 or 2 children have the highest poverty rate, with 6 household (14.6%) living below poverty.
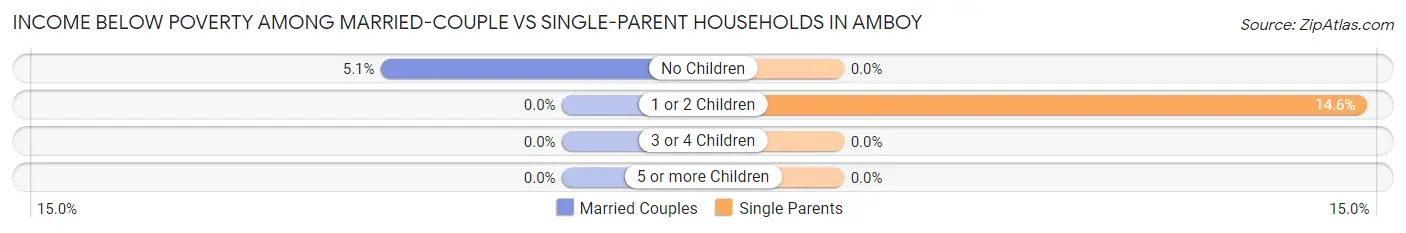
| Children | Married-Couple Families | Single-Parent Households |
| No Children | 9 (5.1%) | 0 (0.0%) |
| 1 or 2 Children | 0 (0.0%) | 6 (14.6%) |
| 3 or 4 Children | 0 (0.0%) | 0 (0.0%) |
| 5 or more Children | 0 (0.0%) | 0 (0.0%) |
| Total | 9 (3.1%) | 6 (9.8%) |
Race in Amboy
The most populous races in Amboy are White / Caucasian (1,451 | 86.4%), Hispanic or Latino (249 | 14.8%), and Some other Race (219 | 13.0%).
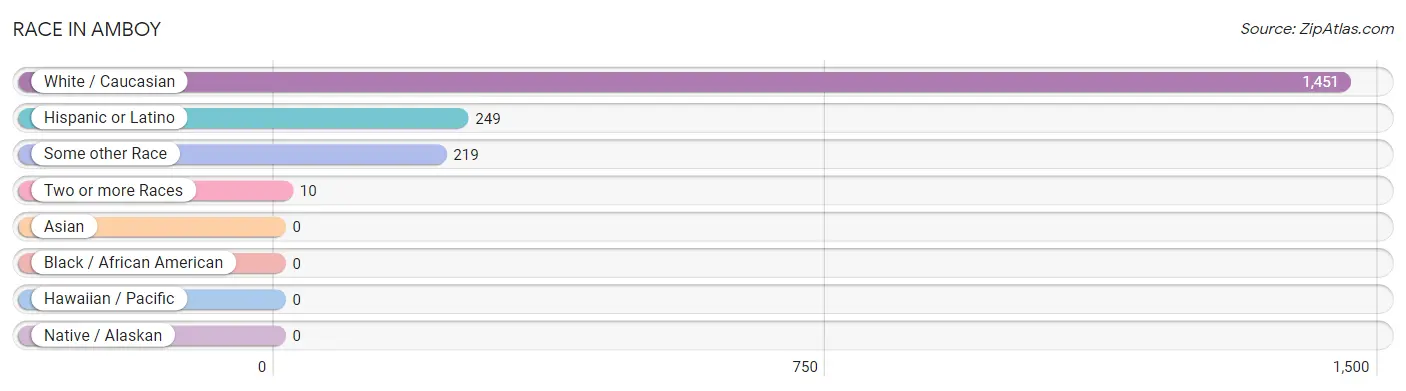
| Race | # Population | % Population |
| Asian | 0 | 0.0% |
| Black / African American | 0 | 0.0% |
| Hawaiian / Pacific | 0 | 0.0% |
| Hispanic or Latino | 249 | 14.8% |
| Native / Alaskan | 0 | 0.0% |
| White / Caucasian | 1,451 | 86.4% |
| Two or more Races | 10 | 0.6% |
| Some other Race | 219 | 13.0% |
| Total | 1,680 | 100.0% |
Ancestry in Amboy
The most populous ancestries reported in Amboy are English (302 | 18.0%), Scandinavian (290 | 17.3%), German (281 | 16.7%), Irish (251 | 14.9%), and Mexican (219 | 13.0%), together accounting for 79.9% of all Amboy residents.
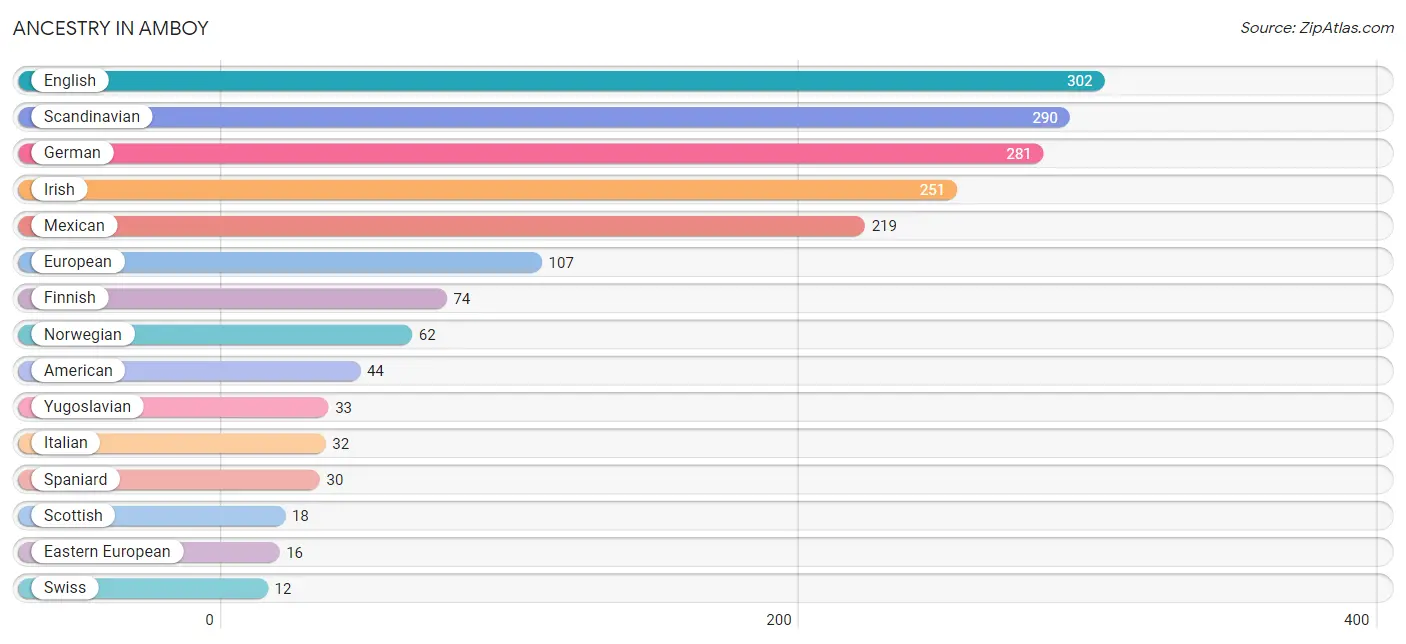
| Ancestry | # Population | % Population |
| American | 44 | 2.6% |
| Armenian | 8 | 0.5% |
| British | 9 | 0.5% |
| Canadian | 3 | 0.2% |
| Dutch | 11 | 0.6% |
| Eastern European | 16 | 0.9% |
| English | 302 | 18.0% |
| European | 107 | 6.4% |
| Finnish | 74 | 4.4% |
| French | 9 | 0.5% |
| German | 281 | 16.7% |
| Indian (Asian) | 10 | 0.6% |
| Irish | 251 | 14.9% |
| Italian | 32 | 1.9% |
| Mexican | 219 | 13.0% |
| Northern European | 2 | 0.1% |
| Norwegian | 62 | 3.7% |
| Polish | 9 | 0.5% |
| Scandinavian | 290 | 17.3% |
| Scottish | 18 | 1.1% |
| Spaniard | 30 | 1.8% |
| Swedish | 8 | 0.5% |
| Swiss | 12 | 0.7% |
| Yugoslavian | 33 | 2.0% | View All 24 Rows |
Immigrants in Amboy
The most numerous immigrant groups reported in Amboy came from Central America (80 | 4.8%), Latin America (80 | 4.8%), Mexico (80 | 4.8%), Europe (54 | 3.2%), and Bosnia and Herzegovina (33 | 2.0%), together accounting for 19.5% of all Amboy residents.
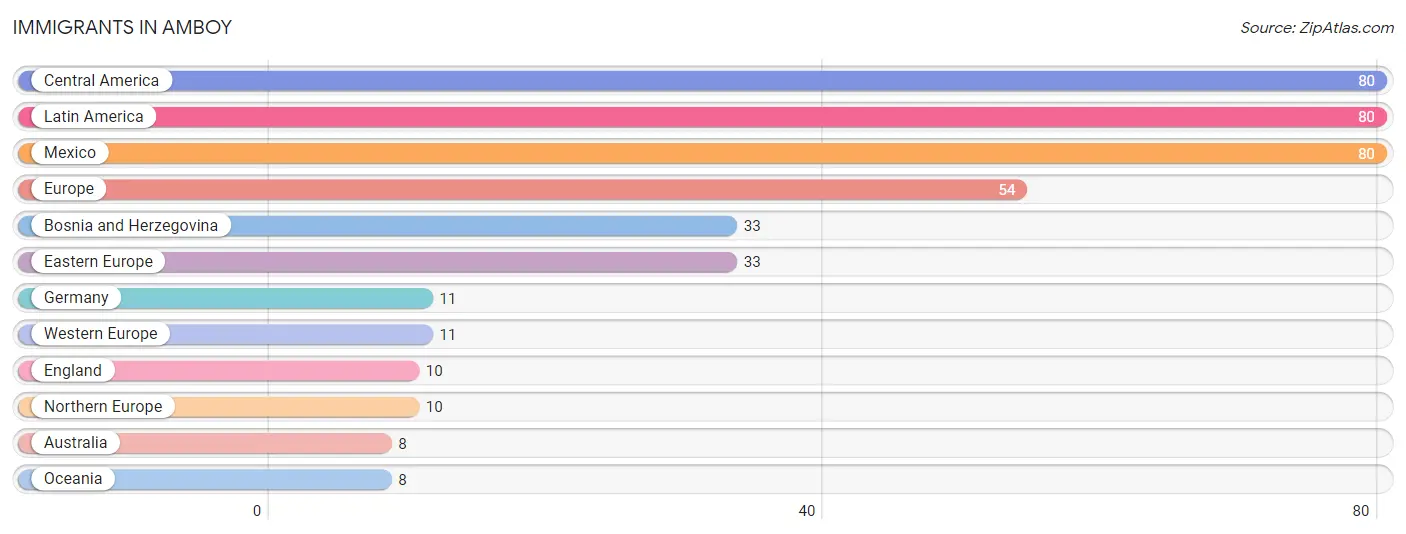
| Immigration Origin | # Population | % Population |
| Australia | 8 | 0.5% |
| Bosnia and Herzegovina | 33 | 2.0% |
| Central America | 80 | 4.8% |
| Eastern Europe | 33 | 2.0% |
| England | 10 | 0.6% |
| Europe | 54 | 3.2% |
| Germany | 11 | 0.6% |
| Latin America | 80 | 4.8% |
| Mexico | 80 | 4.8% |
| Northern Europe | 10 | 0.6% |
| Oceania | 8 | 0.5% |
| Western Europe | 11 | 0.6% | View All 12 Rows |
Sex and Age in Amboy
Sex and Age in Amboy
The most populous age groups in Amboy are 25 to 29 Years (89 | 12.7%) for men and Under 5 Years (141 | 14.4%) for women.
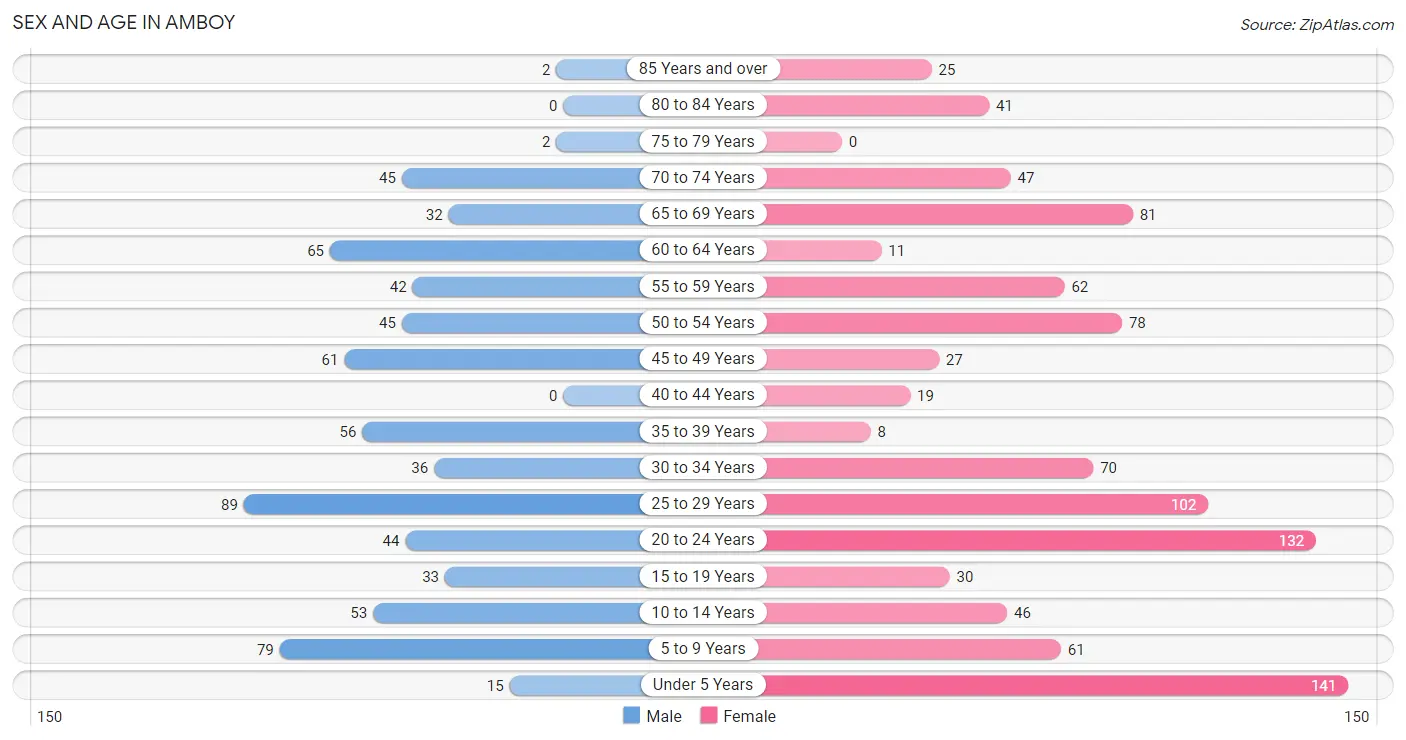
| Age Bracket | Male | Female |
| Under 5 Years | 15 (2.1%) | 141 (14.4%) |
| 5 to 9 Years | 79 (11.3%) | 61 (6.2%) |
| 10 to 14 Years | 53 (7.6%) | 46 (4.7%) |
| 15 to 19 Years | 33 (4.7%) | 30 (3.1%) |
| 20 to 24 Years | 44 (6.3%) | 132 (13.5%) |
| 25 to 29 Years | 89 (12.7%) | 102 (10.4%) |
| 30 to 34 Years | 36 (5.1%) | 70 (7.1%) |
| 35 to 39 Years | 56 (8.0%) | 8 (0.8%) |
| 40 to 44 Years | 0 (0.0%) | 19 (1.9%) |
| 45 to 49 Years | 61 (8.7%) | 27 (2.8%) |
| 50 to 54 Years | 45 (6.4%) | 78 (8.0%) |
| 55 to 59 Years | 42 (6.0%) | 62 (6.3%) |
| 60 to 64 Years | 65 (9.3%) | 11 (1.1%) |
| 65 to 69 Years | 32 (4.6%) | 81 (8.3%) |
| 70 to 74 Years | 45 (6.4%) | 47 (4.8%) |
| 75 to 79 Years | 2 (0.3%) | 0 (0.0%) |
| 80 to 84 Years | 0 (0.0%) | 41 (4.2%) |
| 85 Years and over | 2 (0.3%) | 25 (2.5%) |
| Total | 699 (100.0%) | 981 (100.0%) |
Families and Households in Amboy
Median Family Size in Amboy
The median family size in Amboy is 4.16 persons per family, with married-couple families (294 | 82.8%) accounting for the largest median family size of 4.33 persons per family. On the other hand, single male/father families (29 | 8.2%) represent the smallest median family size with 2.86 persons per family.
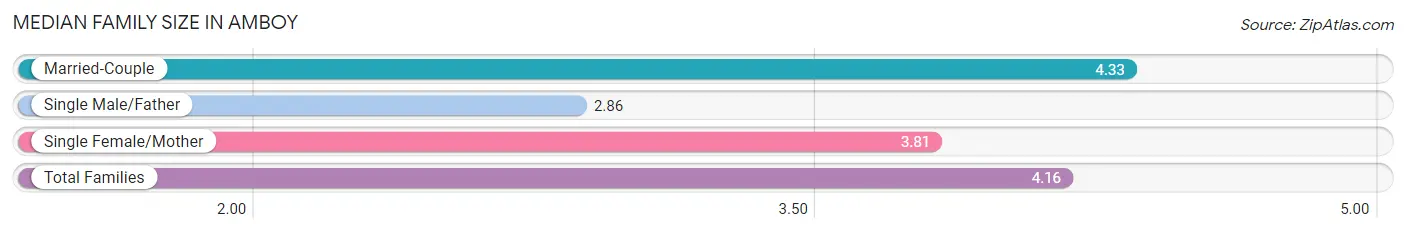
| Family Type | # Families | Family Size |
| Married-Couple | 294 (82.8%) | 4.33 |
| Single Male/Father | 29 (8.2%) | 2.86 |
| Single Female/Mother | 32 (9.0%) | 3.81 |
| Total Families | 355 (100.0%) | 4.16 |
Median Household Size in Amboy
The median household size in Amboy is 3.21 persons per household, with married-couple households (294 | 56.1%) accounting for the largest median household size of 4.33 persons per household. non-family households (169 | 32.3%) represent the smallest median household size with 1.07 persons per household.
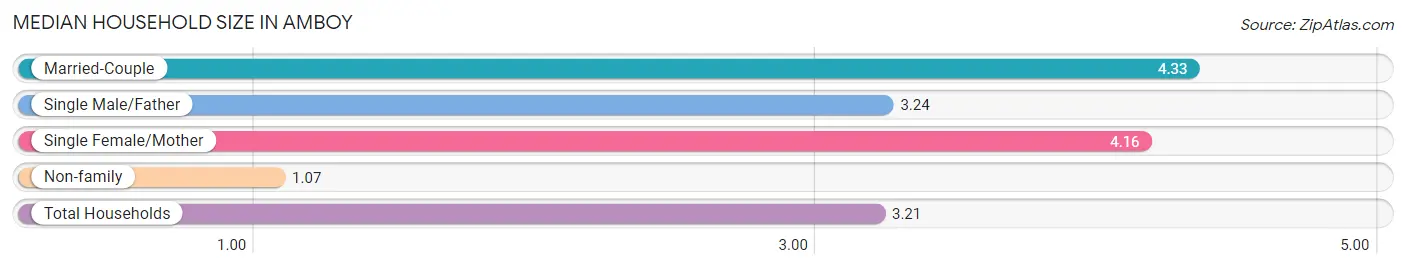
| Household Type | # Households | Household Size |
| Married-Couple | 294 (56.1%) | 4.33 |
| Single Male/Father | 29 (5.5%) | 3.24 |
| Single Female/Mother | 32 (6.1%) | 4.16 |
| Non-family | 169 (32.3%) | 1.07 |
| Total Households | 524 (100.0%) | 3.21 |
Household Size by Marriage Status in Amboy
Out of a total of 524 households in Amboy, 355 (67.7%) are family households, while 169 (32.3%) are nonfamily households. The most numerous type of family households are 2-person households, comprising 121, and the most common type of nonfamily households are 1-person households, comprising 158.
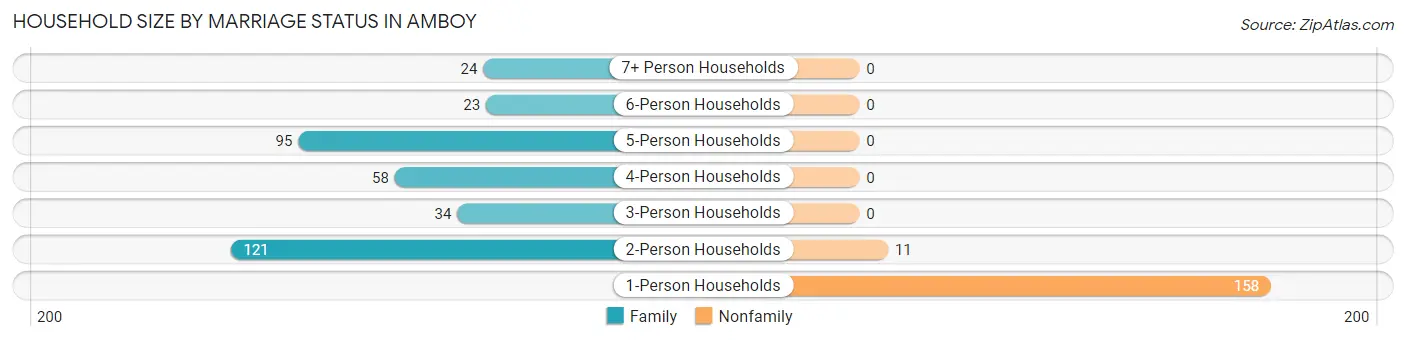
| Household Size | Family Households | Nonfamily Households |
| 1-Person Households | - | 158 (30.1%) |
| 2-Person Households | 121 (23.1%) | 11 (2.1%) |
| 3-Person Households | 34 (6.5%) | 0 (0.0%) |
| 4-Person Households | 58 (11.1%) | 0 (0.0%) |
| 5-Person Households | 95 (18.1%) | 0 (0.0%) |
| 6-Person Households | 23 (4.4%) | 0 (0.0%) |
| 7+ Person Households | 24 (4.6%) | 0 (0.0%) |
| Total | 355 (67.7%) | 169 (32.3%) |
Female Fertility in Amboy
Fertility by Age in Amboy
Average fertility rate in Amboy is 60.0 births per 1,000 women. Women in the age bracket of 20 to 34 years have the highest fertility rate with 79.0 births per 1,000 women. Women in the age bracket of 20 to 34 years acount for 100.0% of all women with births.
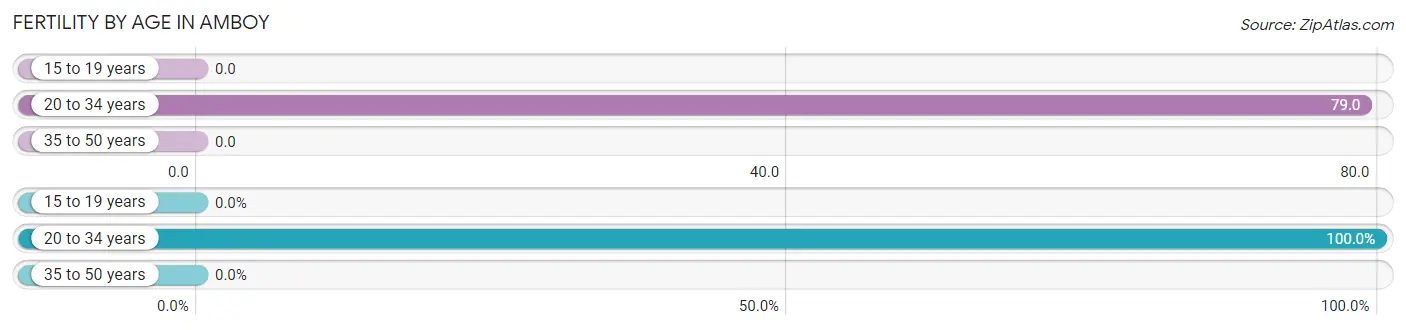
| Age Bracket | Women with Births | Births / 1,000 Women |
| 15 to 19 years | 0 (0.0%) | 0.0 |
| 20 to 34 years | 24 (100.0%) | 79.0 |
| 35 to 50 years | 0 (0.0%) | 0.0 |
| Total | 24 (100.0%) | 60.0 |
Fertility by Age by Marriage Status in Amboy
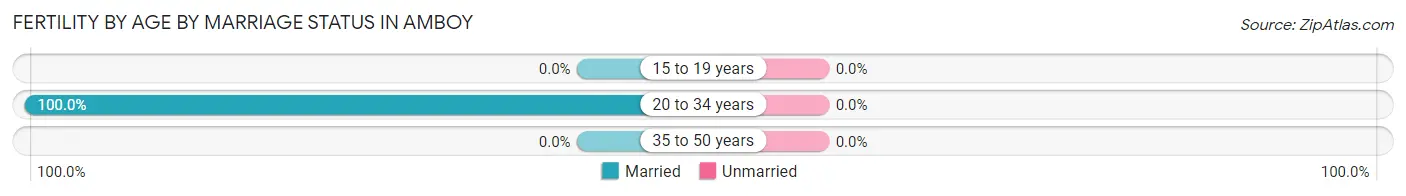
| Age Bracket | Married | Unmarried |
| 15 to 19 years | 0 (0.0%) | 0 (0.0%) |
| 20 to 34 years | 24 (100.0%) | 0 (0.0%) |
| 35 to 50 years | 0 (0.0%) | 0 (0.0%) |
| Total | 24 (100.0%) | 0 (0.0%) |
Fertility by Education in Amboy
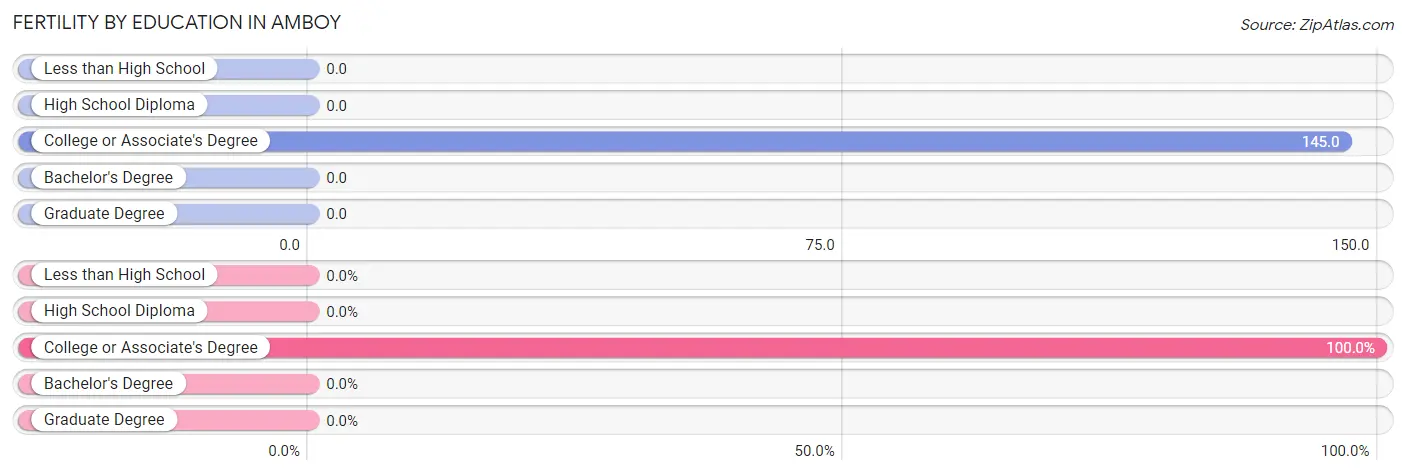
| Educational Attainment | Women with Births | Births / 1,000 Women |
| Less than High School | 0 (0.0%) | 0.0 |
| High School Diploma | 0 (0.0%) | 0.0 |
| College or Associate's Degree | 24 (100.0%) | 145.0 |
| Bachelor's Degree | 0 (0.0%) | 0.0 |
| Graduate Degree | 0 (0.0%) | 0.0 |
| Total | 24 (100.0%) | 60.0 |
Fertility by Education by Marriage Status in Amboy
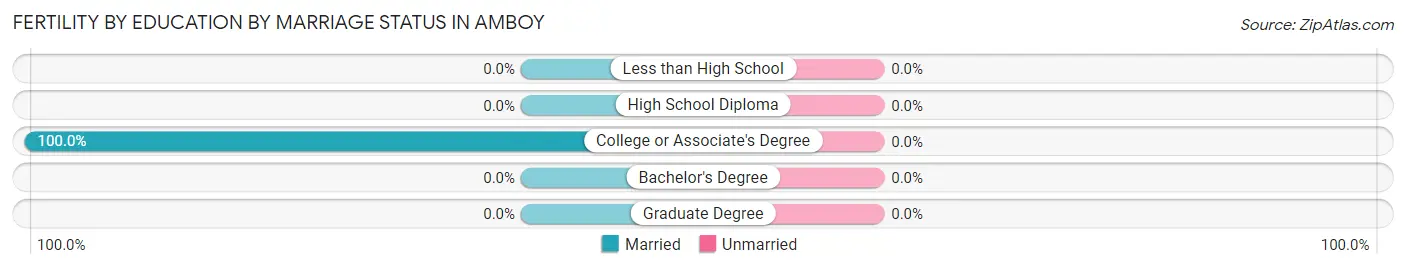
| Educational Attainment | Married | Unmarried |
| Less than High School | 0 (0.0%) | 0 (0.0%) |
| High School Diploma | 0 (0.0%) | 0 (0.0%) |
| College or Associate's Degree | 24 (100.0%) | 0 (0.0%) |
| Bachelor's Degree | 0 (0.0%) | 0 (0.0%) |
| Graduate Degree | 0 (0.0%) | 0 (0.0%) |
| Total | 24 (100.0%) | 0 (0.0%) |
Employment Characteristics in Amboy
Employment by Class of Employer in Amboy
Among the 748 employed individuals in Amboy, private company employees (544 | 72.7%), self-employed (not incorporated) (49 | 6.6%), and federal government employees (48 | 6.4%) make up the most common classes of employment.
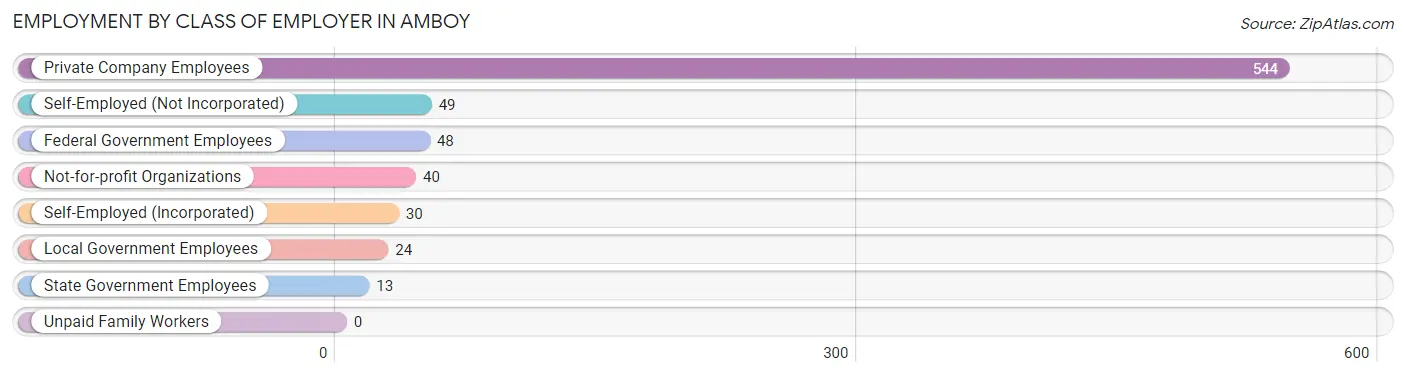
| Employer Class | # Employees | % Employees |
| Private Company Employees | 544 | 72.7% |
| Self-Employed (Incorporated) | 30 | 4.0% |
| Self-Employed (Not Incorporated) | 49 | 6.6% |
| Not-for-profit Organizations | 40 | 5.3% |
| Local Government Employees | 24 | 3.2% |
| State Government Employees | 13 | 1.7% |
| Federal Government Employees | 48 | 6.4% |
| Unpaid Family Workers | 0 | 0.0% |
| Total | 748 | 100.0% |
Employment Status by Age in Amboy
According to the labor force statistics for Amboy, out of the total population over 16 years of age (1,285), 61.8% or 794 individuals are in the labor force, with 4.2% or 33 of them unemployed. The age group with the highest labor force participation rate is 25 to 29 years, with 100.0% or 191 individuals in the labor force. Within the labor force, the 16 to 19 years age range has the highest percentage of unemployed individuals, with 51.1% or 24 of them being unemployed.
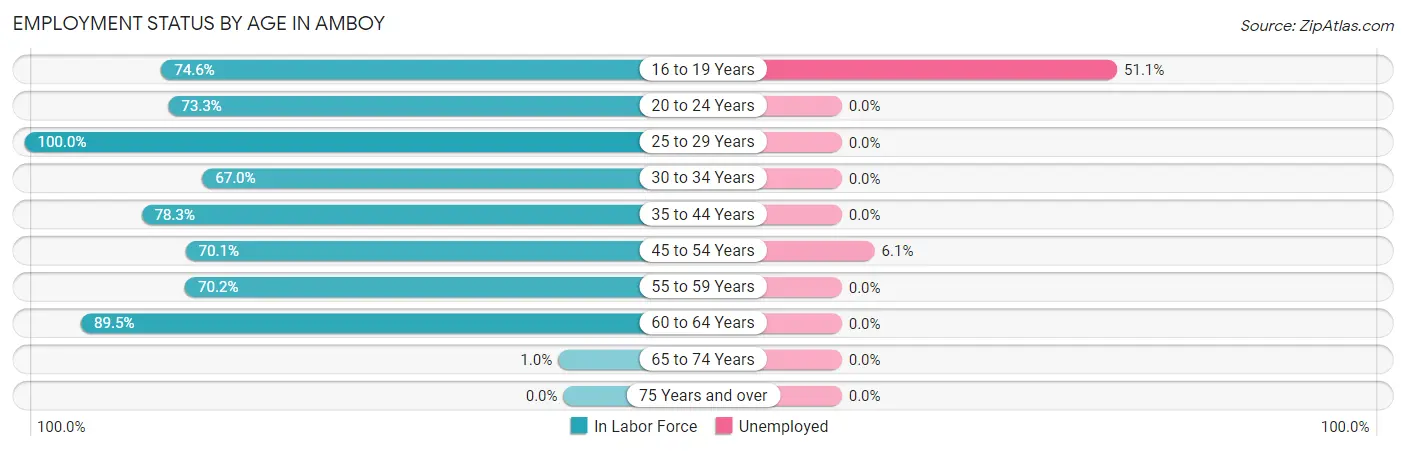
| Age Bracket | In Labor Force | Unemployed |
| 16 to 19 Years | 47 (74.6%) | 24 (51.1%) |
| 20 to 24 Years | 129 (73.3%) | 0 (0.0%) |
| 25 to 29 Years | 191 (100.0%) | 0 (0.0%) |
| 30 to 34 Years | 71 (67.0%) | 0 (0.0%) |
| 35 to 44 Years | 65 (78.3%) | 0 (0.0%) |
| 45 to 54 Years | 148 (70.1%) | 9 (6.1%) |
| 55 to 59 Years | 73 (70.2%) | 0 (0.0%) |
| 60 to 64 Years | 68 (89.5%) | 0 (0.0%) |
| 65 to 74 Years | 2 (1.0%) | 0 (0.0%) |
| 75 Years and over | 0 (0.0%) | 0 (0.0%) |
| Total | 794 (61.8%) | 33 (4.2%) |
Employment Status by Educational Attainment in Amboy
According to labor force statistics for Amboy, 79.9% of individuals (616) out of the total population between 25 and 64 years of age (771) are in the labor force, with 1.5% or 9 of them being unemployed. The group with the highest labor force participation rate are those with the educational attainment of bachelor's degree or higher, with 94.9% or 258 individuals in the labor force. Within the labor force, individuals with college / associate degree education have the highest percentage of unemployment, with 5.6% or 9 of them being unemployed.
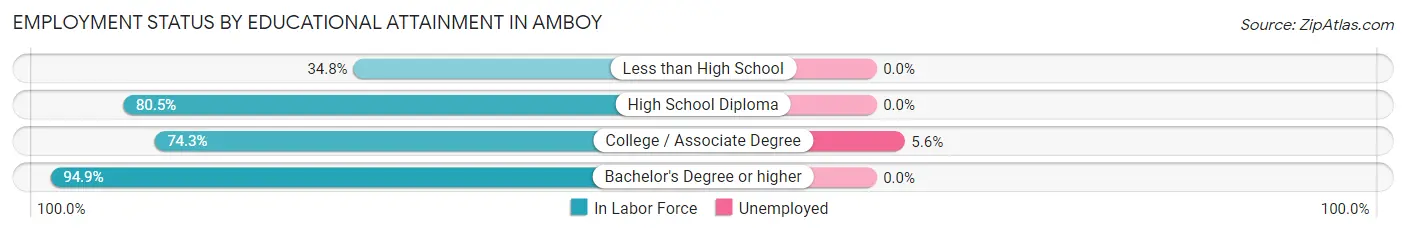
| Educational Attainment | In Labor Force | Unemployed |
| Less than High School | 23 (34.8%) | 0 (0.0%) |
| High School Diploma | 173 (80.5%) | 0 (0.0%) |
| College / Associate Degree | 162 (74.3%) | 12 (5.6%) |
| Bachelor's Degree or higher | 258 (94.9%) | 0 (0.0%) |
| Total | 616 (79.9%) | 12 (1.5%) |
Employment Occupations by Sex in Amboy
Management, Business, Science and Arts Occupations
The most common Management, Business, Science and Arts occupations in Amboy are Management (150 | 19.7%), Computers, Engineering & Science (90 | 11.8%), Computers & Mathematics (90 | 11.8%), Community & Social Service (80 | 10.5%), and Business & Financial (65 | 8.5%).
Management, Business, Science and Arts Occupations by Sex
Within the Management, Business, Science and Arts occupations in Amboy, the most male-oriented occupations are Management (94.7%), Business & Financial (83.1%), and Computers, Engineering & Science (61.1%), while the most female-oriented occupations are Education, Arts & Media (100.0%), Legal Services & Support (100.0%), and Community & Social Service (90.0%).
| Occupation | Male | Female |
| Management | 142 (94.7%) | 8 (5.3%) |
| Business & Financial | 54 (83.1%) | 11 (16.9%) |
| Computers, Engineering & Science | 55 (61.1%) | 35 (38.9%) |
| Computers & Mathematics | 55 (61.1%) | 35 (38.9%) |
| Architecture & Engineering | 0 (0.0%) | 0 (0.0%) |
| Life, Physical & Social Science | 0 (0.0%) | 0 (0.0%) |
| Community & Social Service | 8 (10.0%) | 72 (90.0%) |
| Education, Arts & Media | 0 (0.0%) | 18 (100.0%) |
| Legal Services & Support | 0 (0.0%) | 43 (100.0%) |
| Education Instruction & Library | 8 (42.1%) | 11 (57.9%) |
| Arts, Media & Entertainment | 0 (0.0%) | 0 (0.0%) |
| Health Diagnosing & Treating | 2 (22.2%) | 7 (77.8%) |
| Health Technologists | 2 (22.2%) | 7 (77.8%) |
| Total (Category) | 261 (66.2%) | 133 (33.8%) |
| Total (Overall) | 430 (56.5%) | 331 (43.5%) |
Services Occupations
The most common Services occupations in Amboy are Food Preparation & Serving (91 | 12.0%), Security & Protection (19 | 2.5%), Firefighting & Prevention (19 | 2.5%), and Cleaning & Maintenance (10 | 1.3%).
Services Occupations by Sex
| Occupation | Male | Female |
| Healthcare Support | 0 (0.0%) | 0 (0.0%) |
| Security & Protection | 0 (0.0%) | 19 (100.0%) |
| Firefighting & Prevention | 0 (0.0%) | 19 (100.0%) |
| Law Enforcement | 0 (0.0%) | 0 (0.0%) |
| Food Preparation & Serving | 8 (8.8%) | 83 (91.2%) |
| Cleaning & Maintenance | 0 (0.0%) | 10 (100.0%) |
| Personal Care & Service | 0 (0.0%) | 0 (0.0%) |
| Total (Category) | 8 (6.7%) | 112 (93.3%) |
| Total (Overall) | 430 (56.5%) | 331 (43.5%) |
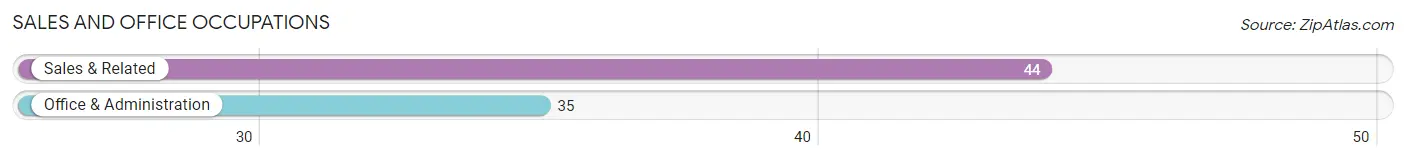
Sales and Office Occupations
The most common Sales and Office occupations in Amboy are Sales & Related (44 | 5.8%), and Office & Administration (35 | 4.6%).
Sales and Office Occupations by Sex
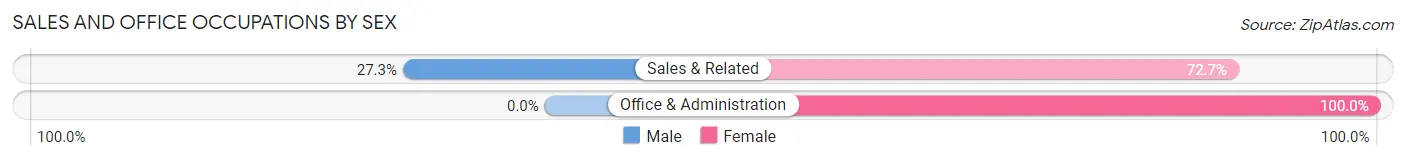
| Occupation | Male | Female |
| Sales & Related | 12 (27.3%) | 32 (72.7%) |
| Office & Administration | 0 (0.0%) | 35 (100.0%) |
| Total (Category) | 12 (15.2%) | 67 (84.8%) |
| Total (Overall) | 430 (56.5%) | 331 (43.5%) |
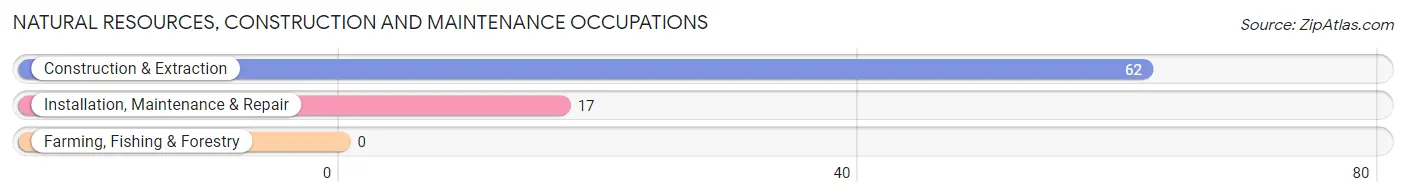
Natural Resources, Construction and Maintenance Occupations
The most common Natural Resources, Construction and Maintenance occupations in Amboy are Construction & Extraction (62 | 8.2%), and Installation, Maintenance & Repair (17 | 2.2%).
Natural Resources, Construction and Maintenance Occupations by Sex
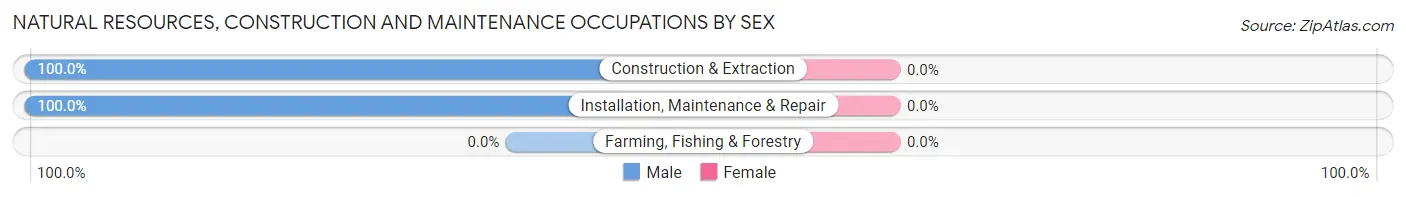
| Occupation | Male | Female |
| Farming, Fishing & Forestry | 0 (0.0%) | 0 (0.0%) |
| Construction & Extraction | 62 (100.0%) | 0 (0.0%) |
| Installation, Maintenance & Repair | 17 (100.0%) | 0 (0.0%) |
| Total (Category) | 79 (100.0%) | 0 (0.0%) |
| Total (Overall) | 430 (56.5%) | 331 (43.5%) |
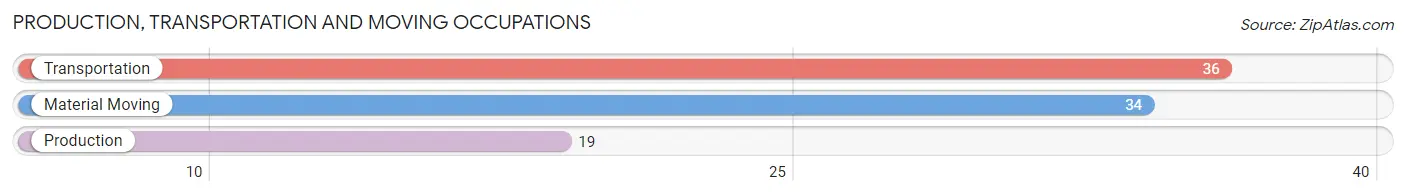
Production, Transportation and Moving Occupations
The most common Production, Transportation and Moving occupations in Amboy are Transportation (36 | 4.7%), Material Moving (34 | 4.5%), and Production (19 | 2.5%).
Production, Transportation and Moving Occupations by Sex
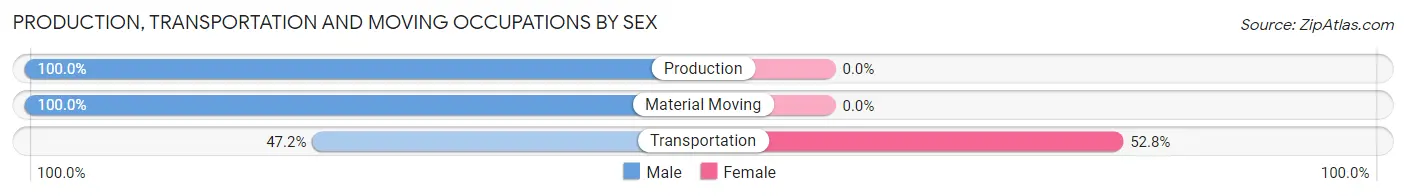
| Occupation | Male | Female |
| Production | 19 (100.0%) | 0 (0.0%) |
| Transportation | 17 (47.2%) | 19 (52.8%) |
| Material Moving | 34 (100.0%) | 0 (0.0%) |
| Total (Category) | 70 (78.6%) | 19 (21.3%) |
| Total (Overall) | 430 (56.5%) | 331 (43.5%) |
Employment Industries by Sex in Amboy
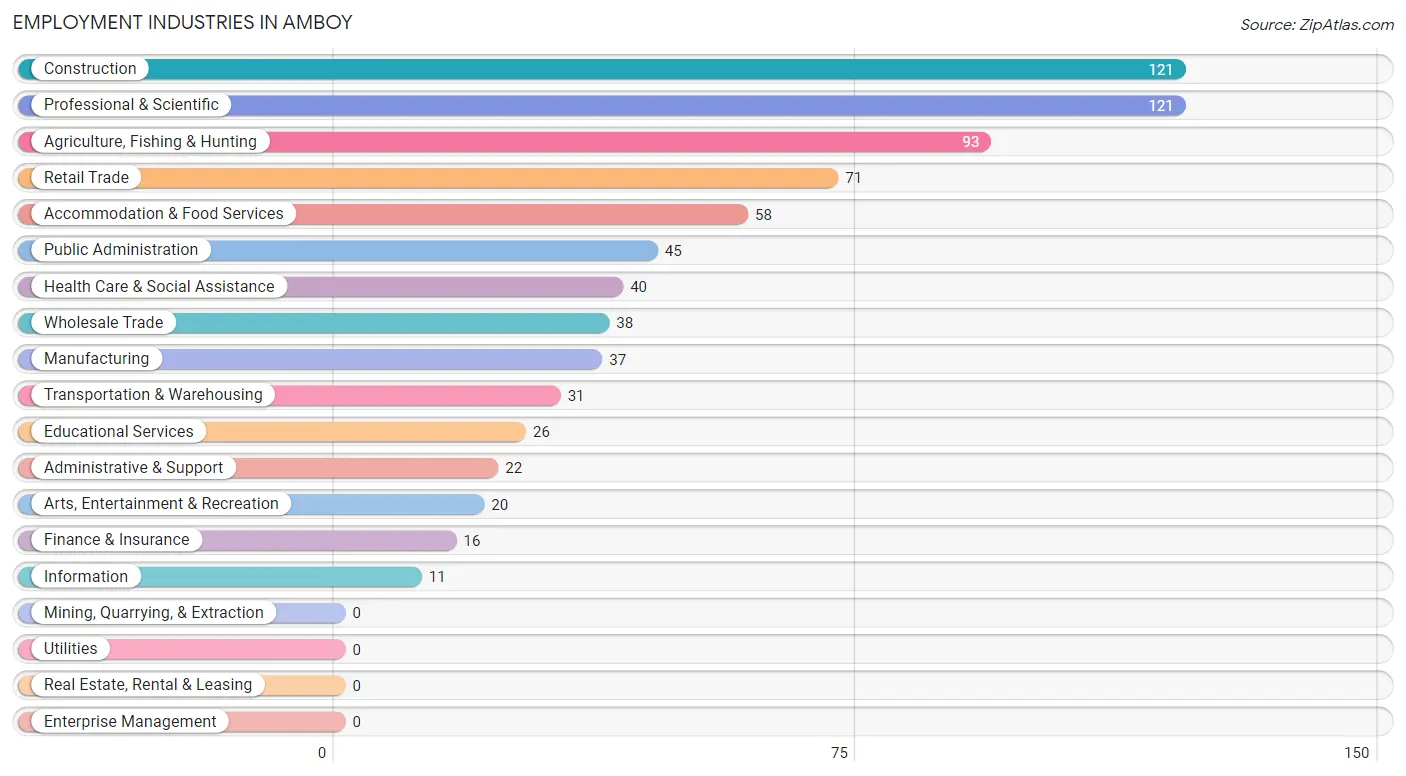
Employment Industries in Amboy
The major employment industries in Amboy include Construction (121 | 15.9%), Professional & Scientific (121 | 15.9%), Agriculture, Fishing & Hunting (93 | 12.2%), Retail Trade (71 | 9.3%), and Accommodation & Food Services (58 | 7.6%).
Employment Industries by Sex in Amboy
The Amboy industries that see more men than women are Agriculture, Fishing & Hunting (100.0%), Information (100.0%), and Construction (84.3%), whereas the industries that tend to have a higher number of women are Transportation & Warehousing (100.0%), Finance & Insurance (100.0%), and Arts, Entertainment & Recreation (100.0%).
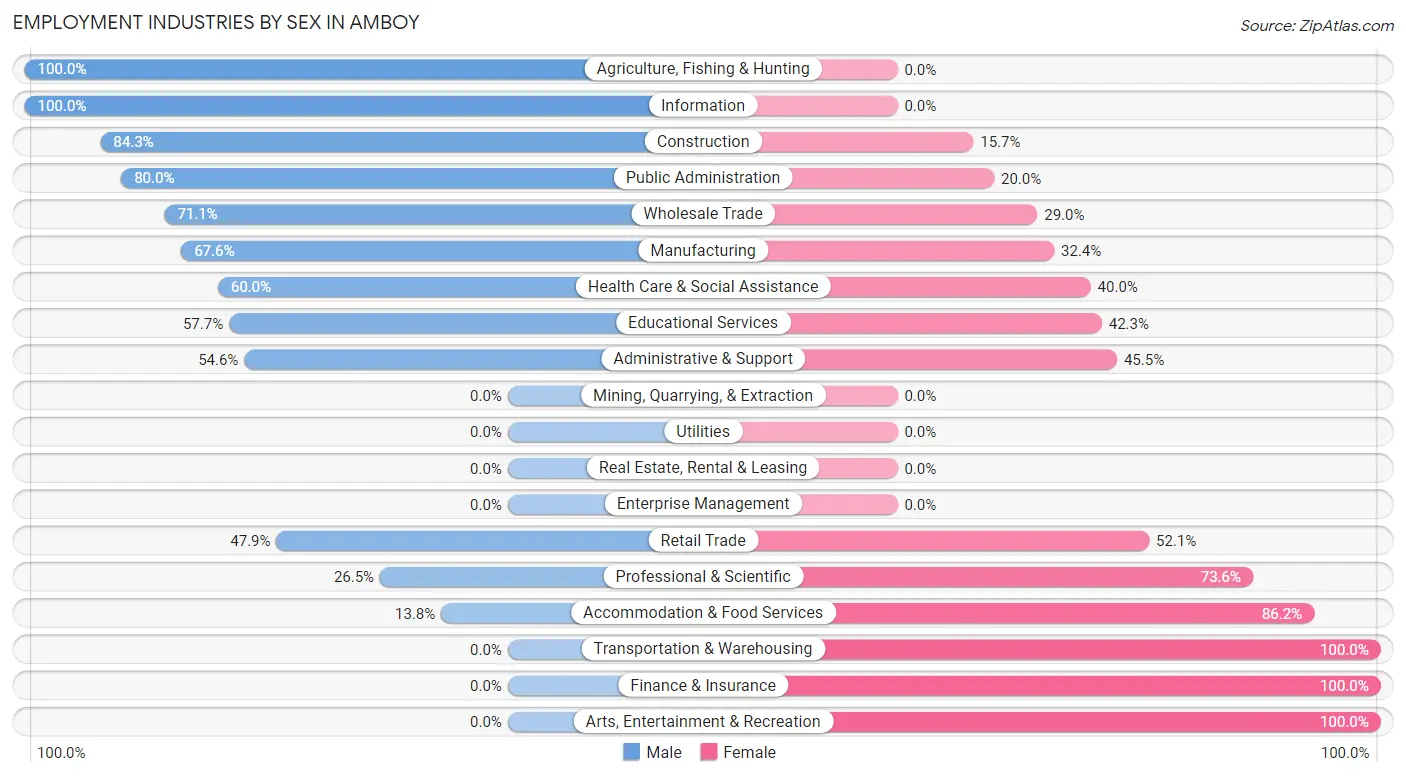
| Industry | Male | Female |
| Agriculture, Fishing & Hunting | 93 (100.0%) | 0 (0.0%) |
| Mining, Quarrying, & Extraction | 0 (0.0%) | 0 (0.0%) |
| Construction | 102 (84.3%) | 19 (15.7%) |
| Manufacturing | 25 (67.6%) | 12 (32.4%) |
| Wholesale Trade | 27 (71.1%) | 11 (28.9%) |
| Retail Trade | 34 (47.9%) | 37 (52.1%) |
| Transportation & Warehousing | 0 (0.0%) | 31 (100.0%) |
| Utilities | 0 (0.0%) | 0 (0.0%) |
| Information | 11 (100.0%) | 0 (0.0%) |
| Finance & Insurance | 0 (0.0%) | 16 (100.0%) |
| Real Estate, Rental & Leasing | 0 (0.0%) | 0 (0.0%) |
| Professional & Scientific | 32 (26.5%) | 89 (73.6%) |
| Enterprise Management | 0 (0.0%) | 0 (0.0%) |
| Administrative & Support | 12 (54.5%) | 10 (45.5%) |
| Educational Services | 15 (57.7%) | 11 (42.3%) |
| Health Care & Social Assistance | 24 (60.0%) | 16 (40.0%) |
| Arts, Entertainment & Recreation | 0 (0.0%) | 20 (100.0%) |
| Accommodation & Food Services | 8 (13.8%) | 50 (86.2%) |
| Public Administration | 36 (80.0%) | 9 (20.0%) |
| Total | 430 (56.5%) | 331 (43.5%) |
Education in Amboy
School Enrollment in Amboy
The most common levels of schooling among the 360 students in Amboy are elementary school (129 | 35.8%), middle school (83 | 23.1%), and college / undergraduate (83 | 23.1%).
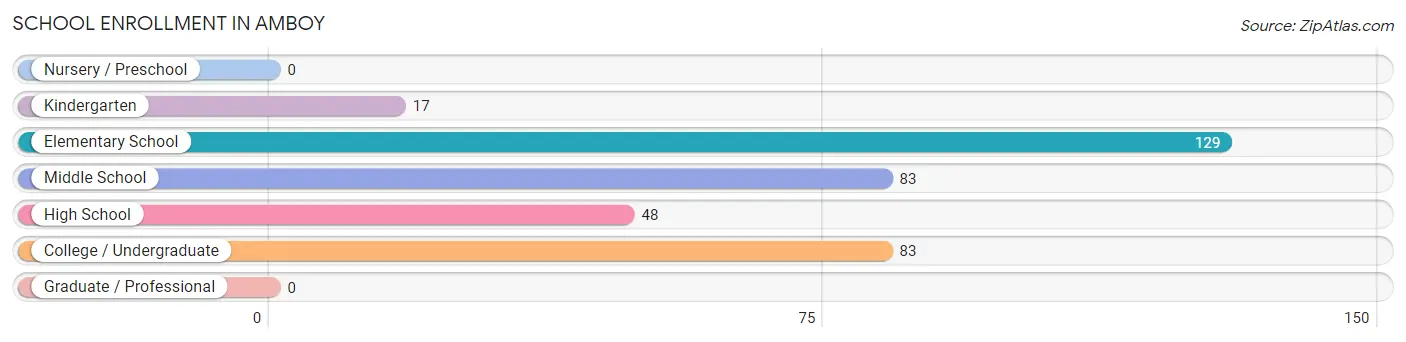
| School Level | # Students | % Students |
| Nursery / Preschool | 0 | 0.0% |
| Kindergarten | 17 | 4.7% |
| Elementary School | 129 | 35.8% |
| Middle School | 83 | 23.1% |
| High School | 48 | 13.3% |
| College / Undergraduate | 83 | 23.1% |
| Graduate / Professional | 0 | 0.0% |
| Total | 360 | 100.0% |
School Enrollment by Age by Funding Source in Amboy
Out of a total of 360 students who are enrolled in schools in Amboy, 104 (28.9%) attend a private institution, while the remaining 256 (71.1%) are enrolled in public schools. The age group of 20 to 24 year olds has the highest likelihood of being enrolled in private schools, with 59 (80.8% in the age bracket) enrolled. Conversely, the age group of 10 to 14 year olds has the lowest likelihood of being enrolled in a private school, with 99 (100.0% in the age bracket) attending a public institution.
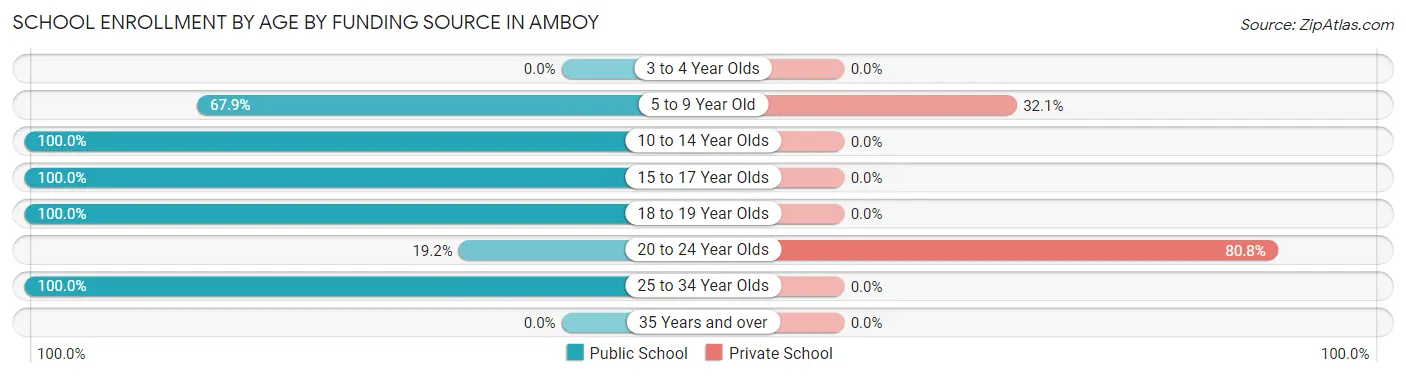
| Age Bracket | Public School | Private School |
| 3 to 4 Year Olds | 0 (0.0%) | 0 (0.0%) |
| 5 to 9 Year Old | 95 (67.9%) | 45 (32.1%) |
| 10 to 14 Year Olds | 99 (100.0%) | 0 (0.0%) |
| 15 to 17 Year Olds | 30 (100.0%) | 0 (0.0%) |
| 18 to 19 Year Olds | 8 (100.0%) | 0 (0.0%) |
| 20 to 24 Year Olds | 14 (19.2%) | 59 (80.8%) |
| 25 to 34 Year Olds | 10 (100.0%) | 0 (0.0%) |
| 35 Years and over | 0 (0.0%) | 0 (0.0%) |
| Total | 256 (71.1%) | 104 (28.9%) |
Educational Attainment by Field of Study in Amboy
Business (136 | 37.8%), arts & humanities (59 | 16.4%), bio, nature & agricultural (45 | 12.5%), education (37 | 10.3%), and science & technology (20 | 5.6%) are the most common fields of study among 360 individuals in Amboy who have obtained a bachelor's degree or higher.
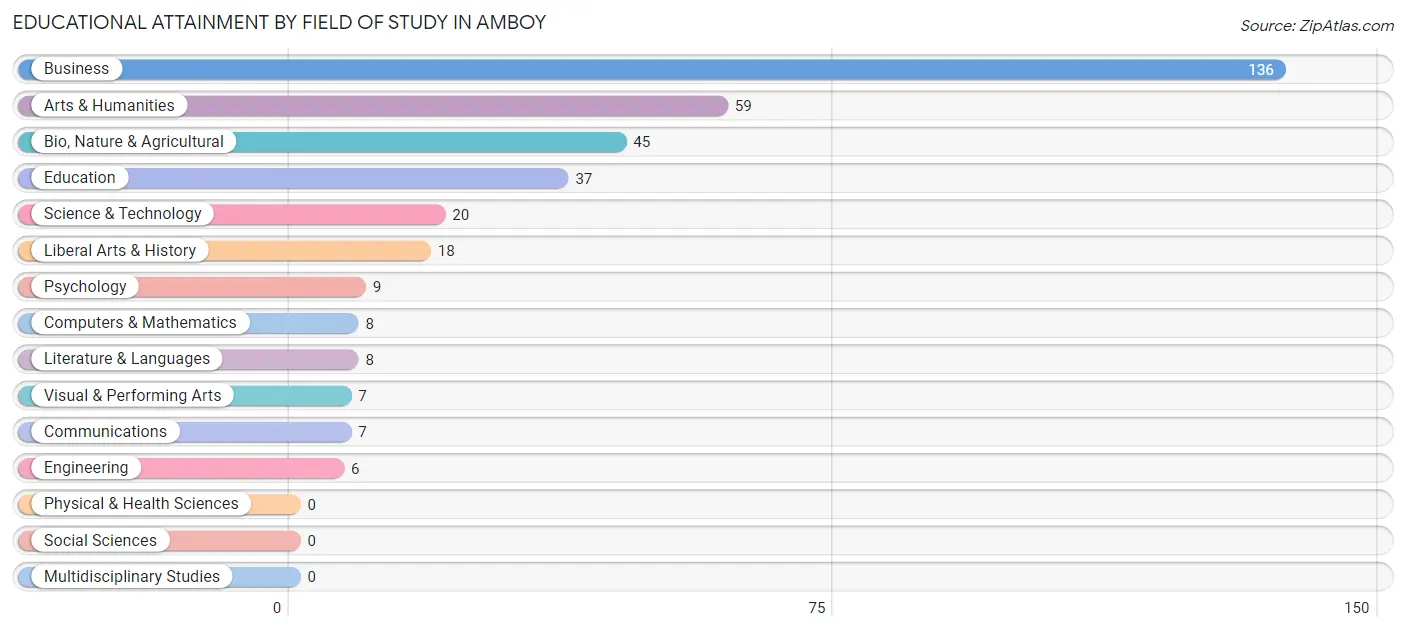
| Field of Study | # Graduates | % Graduates |
| Computers & Mathematics | 8 | 2.2% |
| Bio, Nature & Agricultural | 45 | 12.5% |
| Physical & Health Sciences | 0 | 0.0% |
| Psychology | 9 | 2.5% |
| Social Sciences | 0 | 0.0% |
| Engineering | 6 | 1.7% |
| Multidisciplinary Studies | 0 | 0.0% |
| Science & Technology | 20 | 5.6% |
| Business | 136 | 37.8% |
| Education | 37 | 10.3% |
| Literature & Languages | 8 | 2.2% |
| Liberal Arts & History | 18 | 5.0% |
| Visual & Performing Arts | 7 | 1.9% |
| Communications | 7 | 1.9% |
| Arts & Humanities | 59 | 16.4% |
| Total | 360 | 100.0% |
Transportation & Commute in Amboy
Vehicle Availability by Sex in Amboy
The most prevalent vehicle ownership categories in Amboy are males with 5 or more vehicles (194, accounting for 45.1%) and females with 5 or more vehicles (138, making up 61.0%).
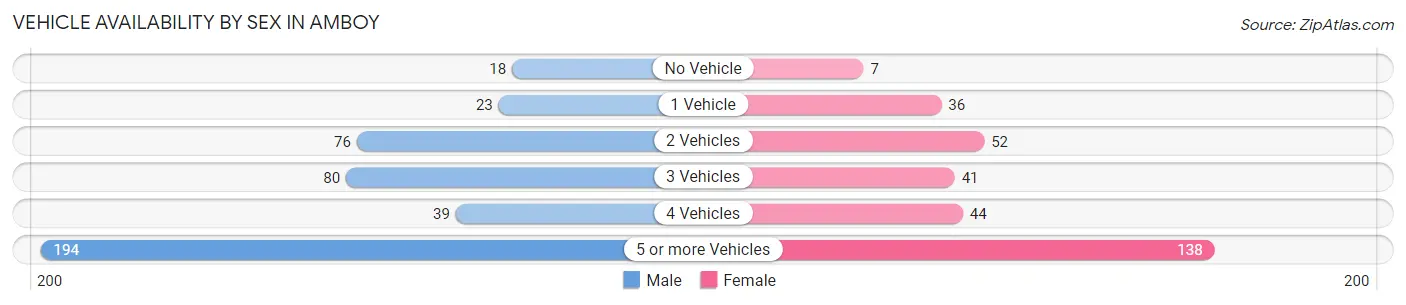
| Vehicles Available | Male | Female |
| No Vehicle | 18 (4.2%) | 7 (2.2%) |
| 1 Vehicle | 23 (5.3%) | 36 (11.3%) |
| 2 Vehicles | 76 (17.7%) | 52 (16.4%) |
| 3 Vehicles | 80 (18.6%) | 41 (12.9%) |
| 4 Vehicles | 39 (9.1%) | 44 (13.8%) |
| 5 or more Vehicles | 194 (45.1%) | 138 (43.4%) |
| Total | 430 (100.0%) | 318 (100.0%) |
Commute Time in Amboy
The most frequently occuring commute durations in Amboy are 45 to 59 minutes (237 commuters, 34.5%), 35 to 39 minutes (82 commuters, 11.9%), and 60 to 89 minutes (78 commuters, 11.4%).
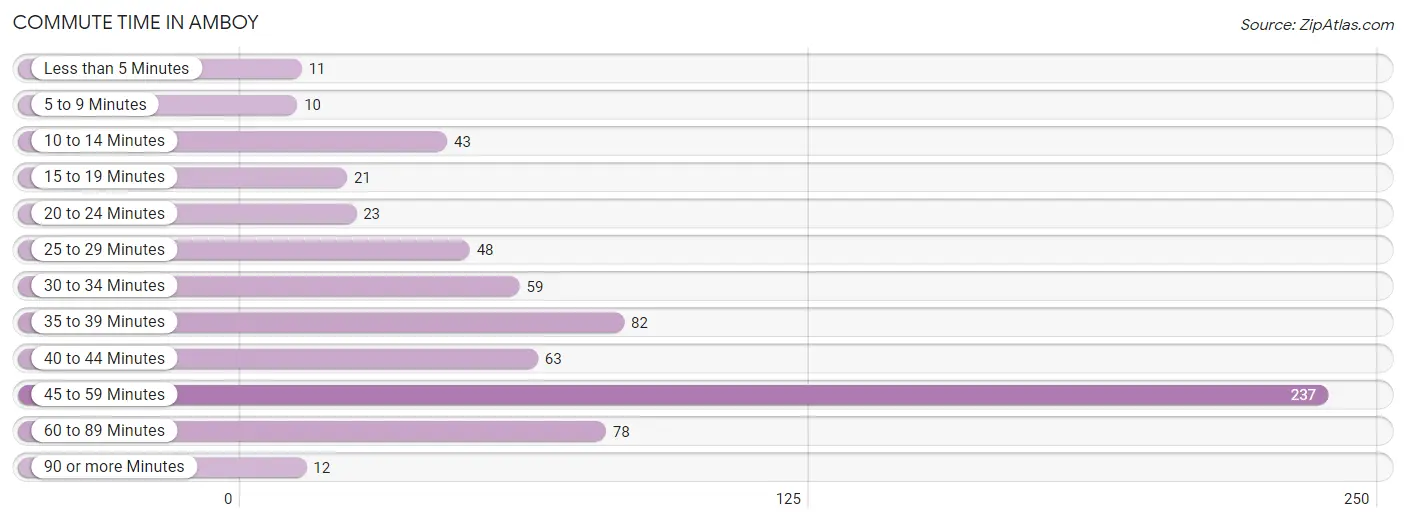
| Commute Time | # Commuters | % Commuters |
| Less than 5 Minutes | 11 | 1.6% |
| 5 to 9 Minutes | 10 | 1.5% |
| 10 to 14 Minutes | 43 | 6.3% |
| 15 to 19 Minutes | 21 | 3.1% |
| 20 to 24 Minutes | 23 | 3.4% |
| 25 to 29 Minutes | 48 | 7.0% |
| 30 to 34 Minutes | 59 | 8.6% |
| 35 to 39 Minutes | 82 | 11.9% |
| 40 to 44 Minutes | 63 | 9.2% |
| 45 to 59 Minutes | 237 | 34.5% |
| 60 to 89 Minutes | 78 | 11.4% |
| 90 or more Minutes | 12 | 1.8% |
Commute Time by Sex in Amboy
The most common commute times in Amboy are 45 to 59 minutes (100 commuters, 24.7%) for males and 45 to 59 minutes (137 commuters, 48.4%) for females.
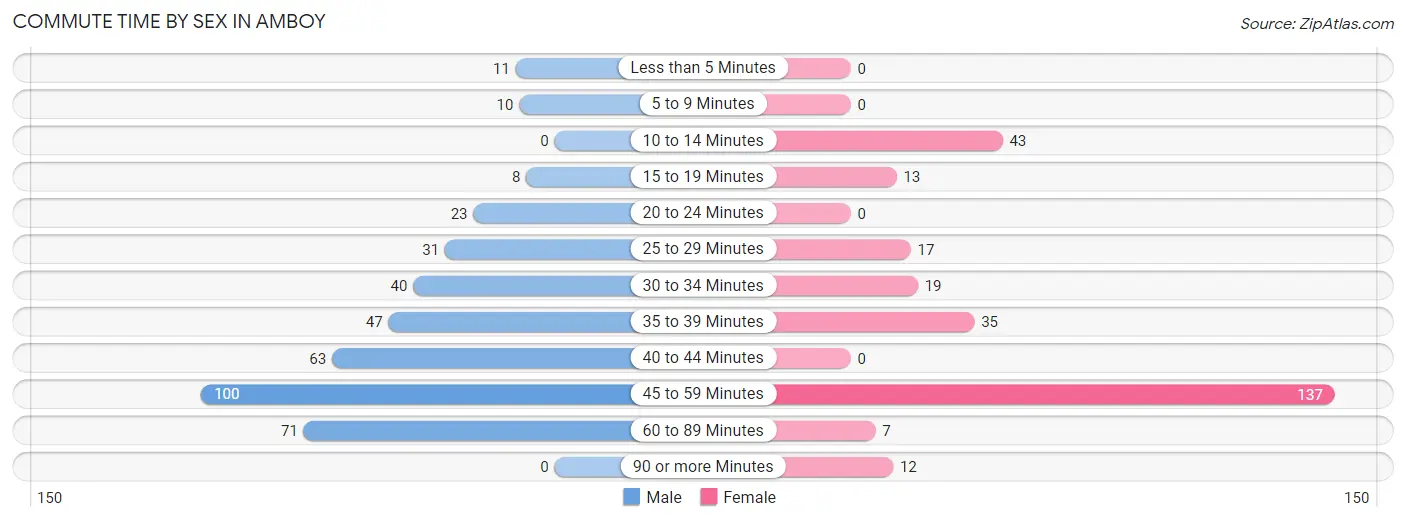
| Commute Time | Male | Female |
| Less than 5 Minutes | 11 (2.7%) | 0 (0.0%) |
| 5 to 9 Minutes | 10 (2.5%) | 0 (0.0%) |
| 10 to 14 Minutes | 0 (0.0%) | 43 (15.2%) |
| 15 to 19 Minutes | 8 (2.0%) | 13 (4.6%) |
| 20 to 24 Minutes | 23 (5.7%) | 0 (0.0%) |
| 25 to 29 Minutes | 31 (7.7%) | 17 (6.0%) |
| 30 to 34 Minutes | 40 (9.9%) | 19 (6.7%) |
| 35 to 39 Minutes | 47 (11.6%) | 35 (12.4%) |
| 40 to 44 Minutes | 63 (15.6%) | 0 (0.0%) |
| 45 to 59 Minutes | 100 (24.7%) | 137 (48.4%) |
| 60 to 89 Minutes | 71 (17.6%) | 7 (2.5%) |
| 90 or more Minutes | 0 (0.0%) | 12 (4.2%) |
Time of Departure to Work by Sex in Amboy
The most frequent times of departure to work in Amboy are 7:00 AM to 7:29 AM (83, 20.5%) for males and 7:00 AM to 7:29 AM (59, 20.8%) for females.
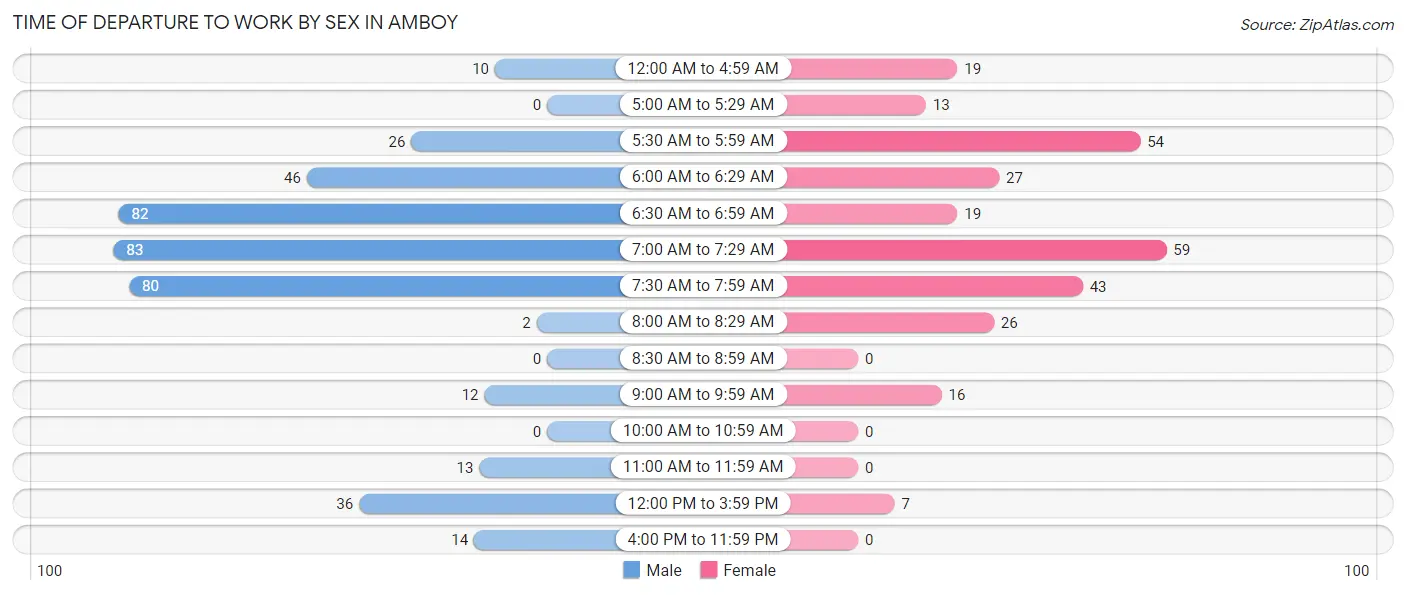
| Time of Departure | Male | Female |
| 12:00 AM to 4:59 AM | 10 (2.5%) | 19 (6.7%) |
| 5:00 AM to 5:29 AM | 0 (0.0%) | 13 (4.6%) |
| 5:30 AM to 5:59 AM | 26 (6.4%) | 54 (19.1%) |
| 6:00 AM to 6:29 AM | 46 (11.4%) | 27 (9.5%) |
| 6:30 AM to 6:59 AM | 82 (20.3%) | 19 (6.7%) |
| 7:00 AM to 7:29 AM | 83 (20.5%) | 59 (20.8%) |
| 7:30 AM to 7:59 AM | 80 (19.8%) | 43 (15.2%) |
| 8:00 AM to 8:29 AM | 2 (0.5%) | 26 (9.2%) |
| 8:30 AM to 8:59 AM | 0 (0.0%) | 0 (0.0%) |
| 9:00 AM to 9:59 AM | 12 (3.0%) | 16 (5.7%) |
| 10:00 AM to 10:59 AM | 0 (0.0%) | 0 (0.0%) |
| 11:00 AM to 11:59 AM | 13 (3.2%) | 0 (0.0%) |
| 12:00 PM to 3:59 PM | 36 (8.9%) | 7 (2.5%) |
| 4:00 PM to 11:59 PM | 14 (3.5%) | 0 (0.0%) |
| Total | 404 (100.0%) | 283 (100.0%) |
Housing Occupancy in Amboy
Occupancy by Ownership in Amboy
Of the total 524 dwellings in Amboy, owner-occupied units account for 422 (80.5%), while renter-occupied units make up 102 (19.5%).
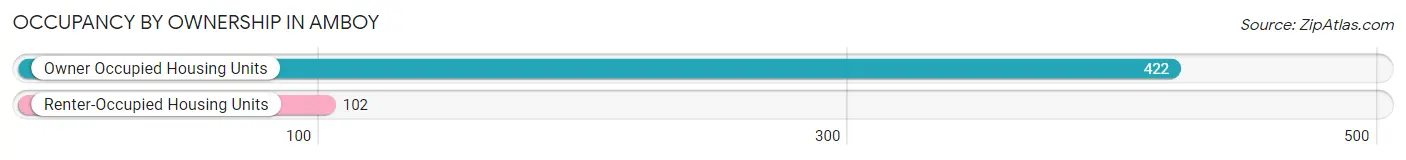
| Occupancy | # Housing Units | % Housing Units |
| Owner Occupied Housing Units | 422 | 80.5% |
| Renter-Occupied Housing Units | 102 | 19.5% |
| Total Occupied Housing Units | 524 | 100.0% |
Occupancy by Household Size in Amboy
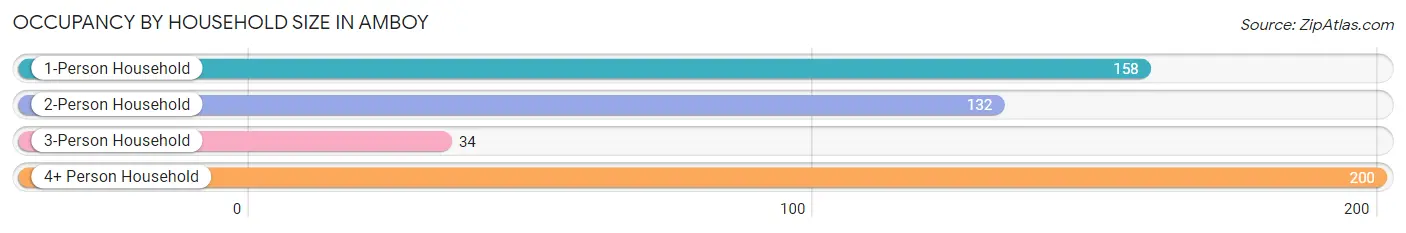
| Household Size | # Housing Units | % Housing Units |
| 1-Person Household | 158 | 30.1% |
| 2-Person Household | 132 | 25.2% |
| 3-Person Household | 34 | 6.5% |
| 4+ Person Household | 200 | 38.2% |
| Total Housing Units | 524 | 100.0% |
Occupancy by Ownership by Household Size in Amboy
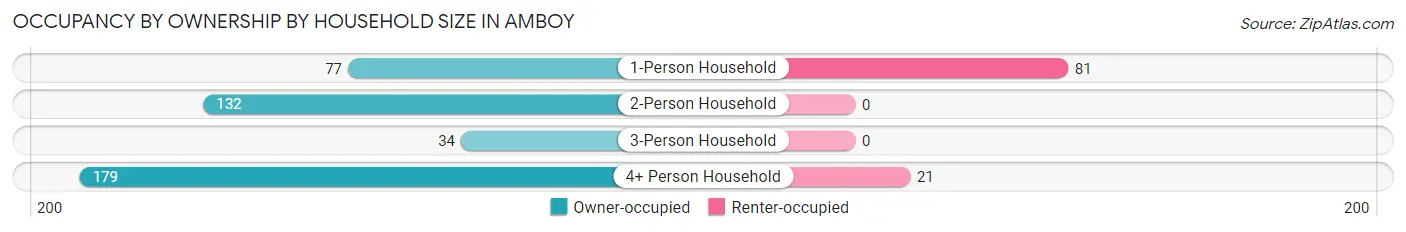
| Household Size | Owner-occupied | Renter-occupied |
| 1-Person Household | 77 (48.7%) | 81 (51.3%) |
| 2-Person Household | 132 (100.0%) | 0 (0.0%) |
| 3-Person Household | 34 (100.0%) | 0 (0.0%) |
| 4+ Person Household | 179 (89.5%) | 21 (10.5%) |
| Total Housing Units | 422 (80.5%) | 102 (19.5%) |
Occupancy by Educational Attainment in Amboy
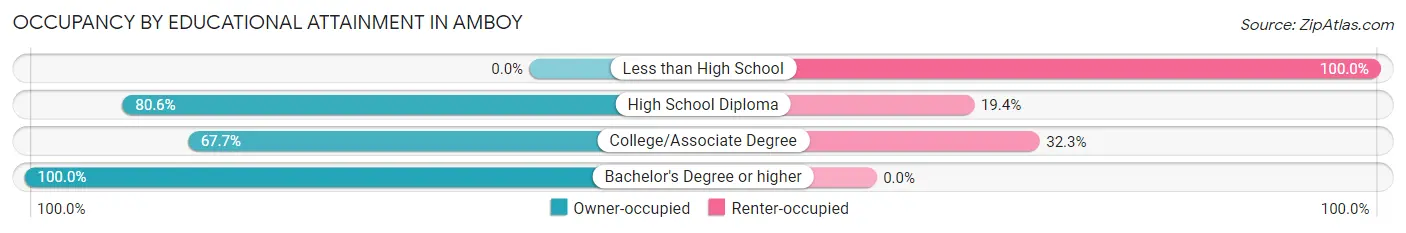
| Household Size | Owner-occupied | Renter-occupied |
| Less than High School | 0 (0.0%) | 10 (100.0%) |
| High School Diploma | 158 (80.6%) | 38 (19.4%) |
| College/Associate Degree | 113 (67.7%) | 54 (32.3%) |
| Bachelor's Degree or higher | 151 (100.0%) | 0 (0.0%) |
Occupancy by Age of Householder in Amboy
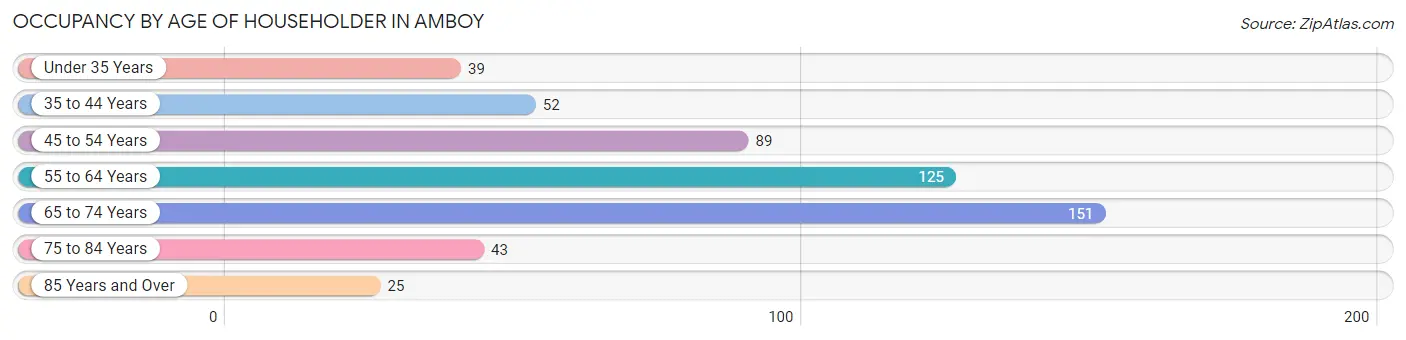
| Age Bracket | # Households | % Households |
| Under 35 Years | 39 | 7.4% |
| 35 to 44 Years | 52 | 9.9% |
| 45 to 54 Years | 89 | 17.0% |
| 55 to 64 Years | 125 | 23.8% |
| 65 to 74 Years | 151 | 28.8% |
| 75 to 84 Years | 43 | 8.2% |
| 85 Years and Over | 25 | 4.8% |
| Total | 524 | 100.0% |
Housing Finances in Amboy
Median Income by Occupancy in Amboy
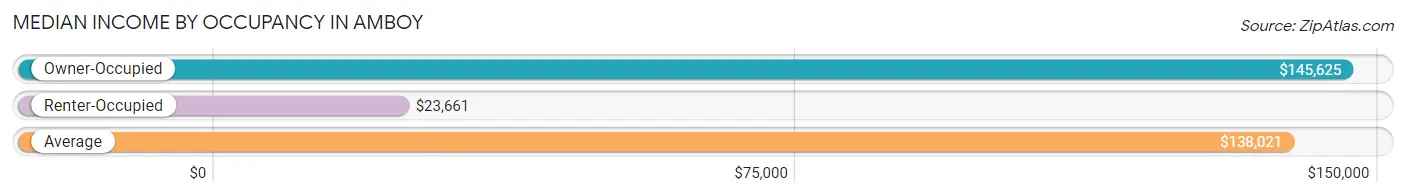
| Occupancy Type | # Households | Median Income |
| Owner-Occupied | 422 (80.5%) | $145,625 |
| Renter-Occupied | 102 (19.5%) | $23,661 |
| Average | 524 (100.0%) | $138,021 |
Occupancy by Householder Income Bracket in Amboy
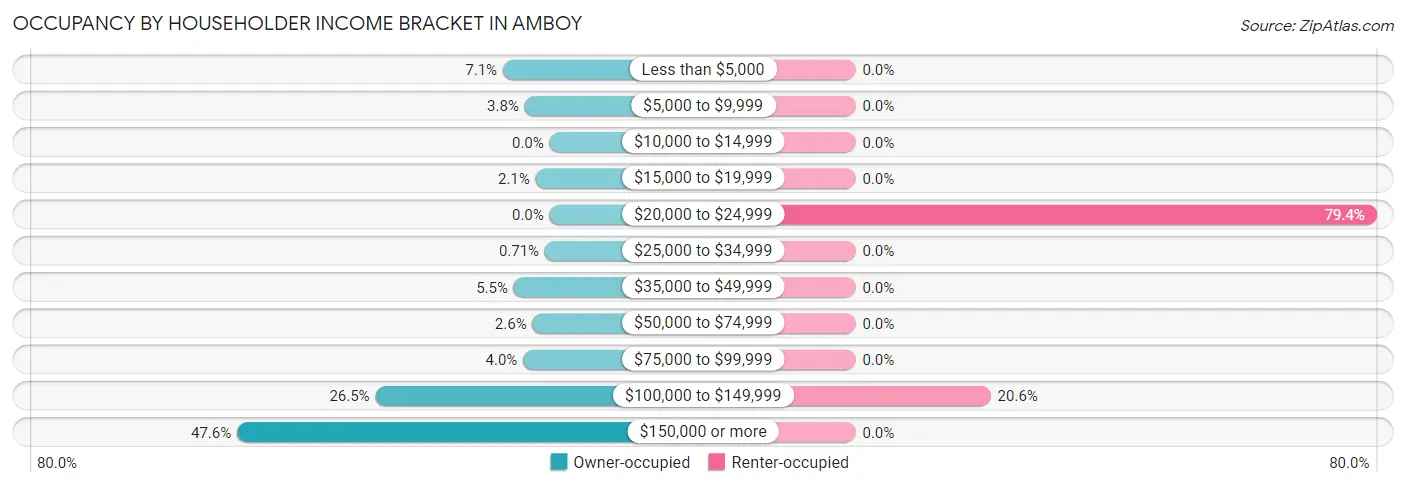
| Income Bracket | Owner-occupied | Renter-occupied |
| Less than $5,000 | 30 (7.1%) | 0 (0.0%) |
| $5,000 to $9,999 | 16 (3.8%) | 0 (0.0%) |
| $10,000 to $14,999 | 0 (0.0%) | 0 (0.0%) |
| $15,000 to $19,999 | 9 (2.1%) | 0 (0.0%) |
| $20,000 to $24,999 | 0 (0.0%) | 81 (79.4%) |
| $25,000 to $34,999 | 3 (0.7%) | 0 (0.0%) |
| $35,000 to $49,999 | 23 (5.4%) | 0 (0.0%) |
| $50,000 to $74,999 | 11 (2.6%) | 0 (0.0%) |
| $75,000 to $99,999 | 17 (4.0%) | 0 (0.0%) |
| $100,000 to $149,999 | 112 (26.5%) | 21 (20.6%) |
| $150,000 or more | 201 (47.6%) | 0 (0.0%) |
| Total | 422 (100.0%) | 102 (100.0%) |
Monthly Housing Cost Tiers in Amboy
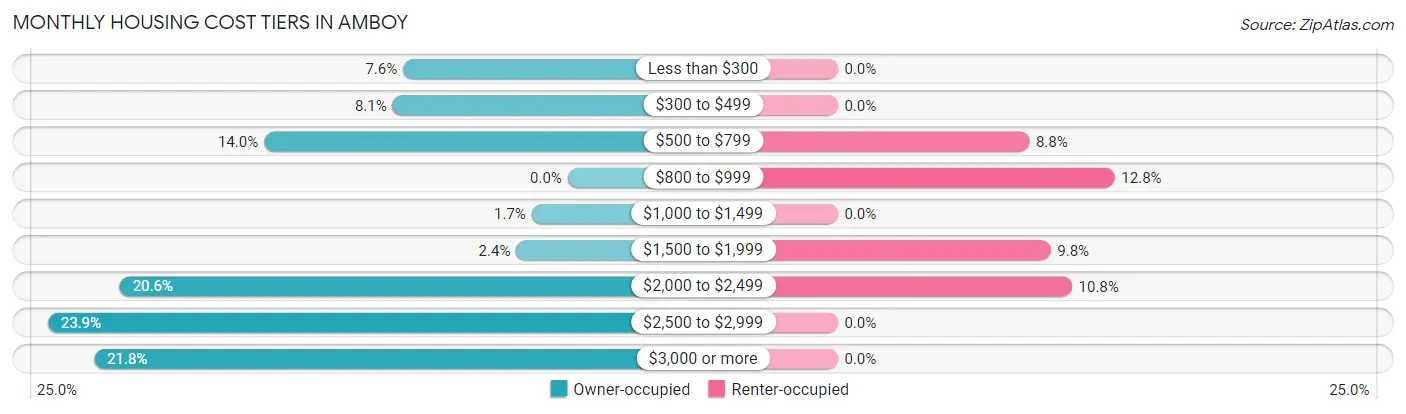
| Monthly Cost | Owner-occupied | Renter-occupied |
| Less than $300 | 32 (7.6%) | 0 (0.0%) |
| $300 to $499 | 34 (8.1%) | 0 (0.0%) |
| $500 to $799 | 59 (14.0%) | 9 (8.8%) |
| $800 to $999 | 0 (0.0%) | 13 (12.8%) |
| $1,000 to $1,499 | 7 (1.7%) | 0 (0.0%) |
| $1,500 to $1,999 | 10 (2.4%) | 10 (9.8%) |
| $2,000 to $2,499 | 87 (20.6%) | 11 (10.8%) |
| $2,500 to $2,999 | 101 (23.9%) | 0 (0.0%) |
| $3,000 or more | 92 (21.8%) | 0 (0.0%) |
| Total | 422 (100.0%) | 102 (100.0%) |
Physical Housing Characteristics in Amboy
Housing Structures in Amboy
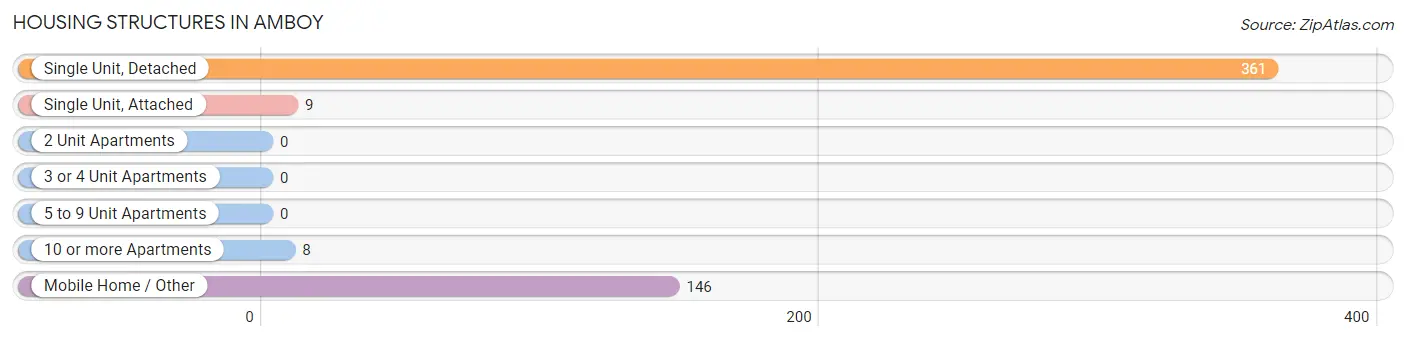
| Structure Type | # Housing Units | % Housing Units |
| Single Unit, Detached | 361 | 68.9% |
| Single Unit, Attached | 9 | 1.7% |
| 2 Unit Apartments | 0 | 0.0% |
| 3 or 4 Unit Apartments | 0 | 0.0% |
| 5 to 9 Unit Apartments | 0 | 0.0% |
| 10 or more Apartments | 8 | 1.5% |
| Mobile Home / Other | 146 | 27.9% |
| Total | 524 | 100.0% |
Housing Structures by Occupancy in Amboy
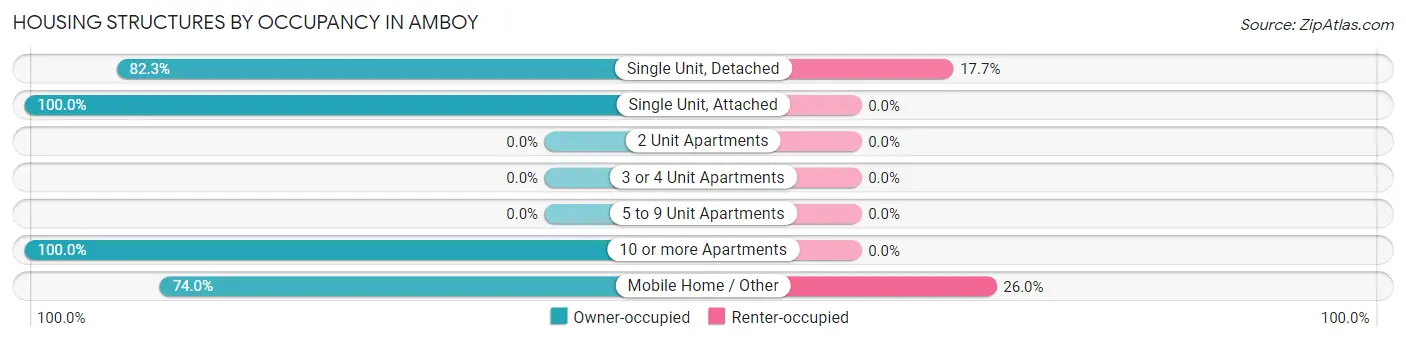
| Structure Type | Owner-occupied | Renter-occupied |
| Single Unit, Detached | 297 (82.3%) | 64 (17.7%) |
| Single Unit, Attached | 9 (100.0%) | 0 (0.0%) |
| 2 Unit Apartments | 0 (0.0%) | 0 (0.0%) |
| 3 or 4 Unit Apartments | 0 (0.0%) | 0 (0.0%) |
| 5 to 9 Unit Apartments | 0 (0.0%) | 0 (0.0%) |
| 10 or more Apartments | 8 (100.0%) | 0 (0.0%) |
| Mobile Home / Other | 108 (74.0%) | 38 (26.0%) |
| Total | 422 (80.5%) | 102 (19.5%) |
Housing Structures by Number of Rooms in Amboy
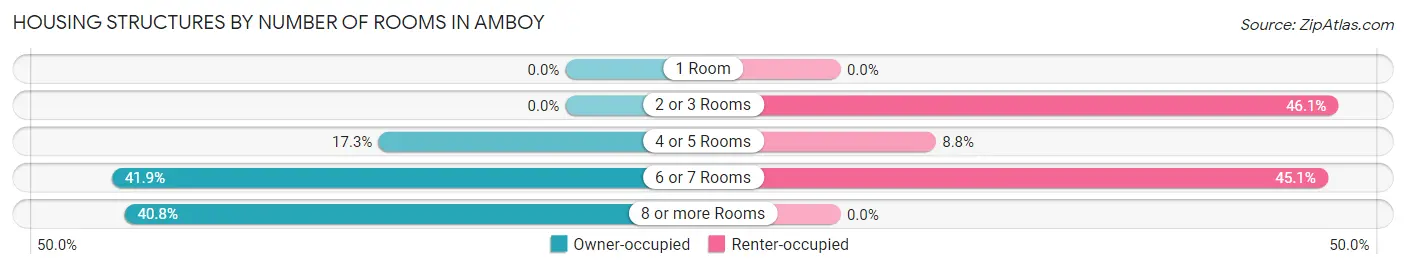
| Number of Rooms | Owner-occupied | Renter-occupied |
| 1 Room | 0 (0.0%) | 0 (0.0%) |
| 2 or 3 Rooms | 0 (0.0%) | 47 (46.1%) |
| 4 or 5 Rooms | 73 (17.3%) | 9 (8.8%) |
| 6 or 7 Rooms | 177 (41.9%) | 46 (45.1%) |
| 8 or more Rooms | 172 (40.8%) | 0 (0.0%) |
| Total | 422 (100.0%) | 102 (100.0%) |
Housing Structure by Heating Type in Amboy
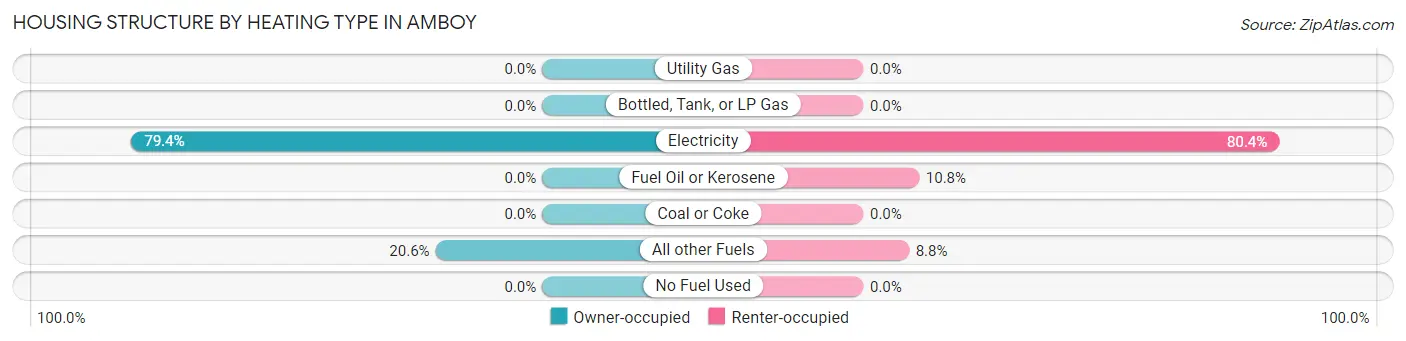
| Heating Type | Owner-occupied | Renter-occupied |
| Utility Gas | 0 (0.0%) | 0 (0.0%) |
| Bottled, Tank, or LP Gas | 0 (0.0%) | 0 (0.0%) |
| Electricity | 335 (79.4%) | 82 (80.4%) |
| Fuel Oil or Kerosene | 0 (0.0%) | 11 (10.8%) |
| Coal or Coke | 0 (0.0%) | 0 (0.0%) |
| All other Fuels | 87 (20.6%) | 9 (8.8%) |
| No Fuel Used | 0 (0.0%) | 0 (0.0%) |
| Total | 422 (100.0%) | 102 (100.0%) |
Household Vehicle Usage in Amboy
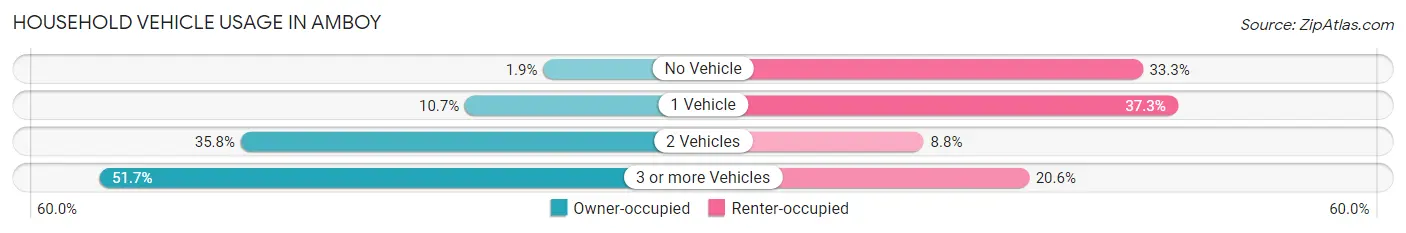
| Vehicles per Household | Owner-occupied | Renter-occupied |
| No Vehicle | 8 (1.9%) | 34 (33.3%) |
| 1 Vehicle | 45 (10.7%) | 38 (37.2%) |
| 2 Vehicles | 151 (35.8%) | 9 (8.8%) |
| 3 or more Vehicles | 218 (51.7%) | 21 (20.6%) |
| Total | 422 (100.0%) | 102 (100.0%) |
Real Estate & Mortgages in Amboy
Real Estate and Mortgage Overview in Amboy
| Characteristic | Without Mortgage | With Mortgage |
| Housing Units | 125 | 297 |
| Median Property Value | $529,900 | $600,200 |
| Median Household Income | - | - |
| Monthly Housing Costs | $396 | $92 |
| Real Estate Taxes | - | - |
Property Value by Mortgage Status in Amboy
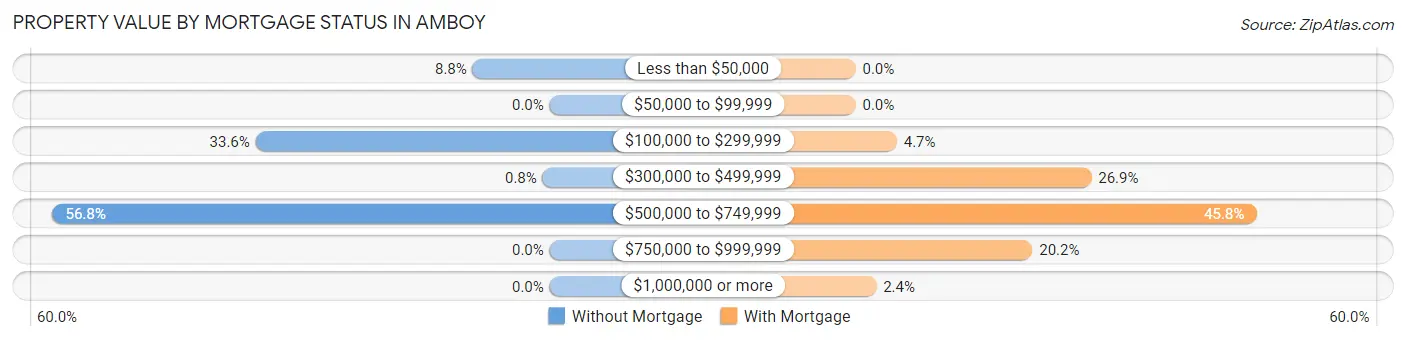
| Property Value | Without Mortgage | With Mortgage |
| Less than $50,000 | 11 (8.8%) | 0 (0.0%) |
| $50,000 to $99,999 | 0 (0.0%) | 0 (0.0%) |
| $100,000 to $299,999 | 42 (33.6%) | 14 (4.7%) |
| $300,000 to $499,999 | 1 (0.8%) | 80 (26.9%) |
| $500,000 to $749,999 | 71 (56.8%) | 136 (45.8%) |
| $750,000 to $999,999 | 0 (0.0%) | 60 (20.2%) |
| $1,000,000 or more | 0 (0.0%) | 7 (2.4%) |
| Total | 125 (100.0%) | 297 (100.0%) |
Household Income by Mortgage Status in Amboy
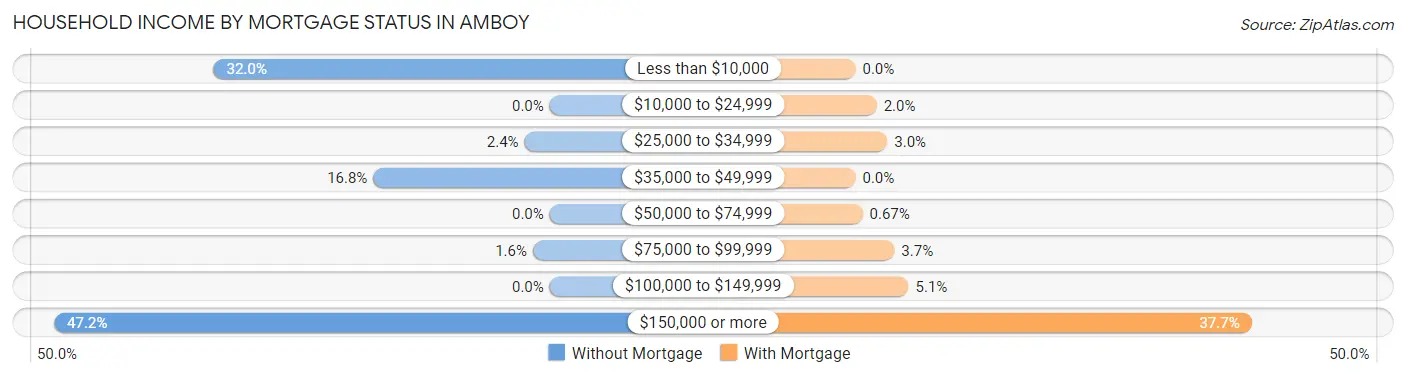
| Household Income | Without Mortgage | With Mortgage |
| Less than $10,000 | 40 (32.0%) | 0 (0.0%) |
| $10,000 to $24,999 | 0 (0.0%) | 6 (2.0%) |
| $25,000 to $34,999 | 3 (2.4%) | 9 (3.0%) |
| $35,000 to $49,999 | 21 (16.8%) | 0 (0.0%) |
| $50,000 to $74,999 | 0 (0.0%) | 2 (0.7%) |
| $75,000 to $99,999 | 2 (1.6%) | 11 (3.7%) |
| $100,000 to $149,999 | 0 (0.0%) | 15 (5.1%) |
| $150,000 or more | 59 (47.2%) | 112 (37.7%) |
| Total | 125 (100.0%) | 297 (100.0%) |
Property Value to Household Income Ratio in Amboy
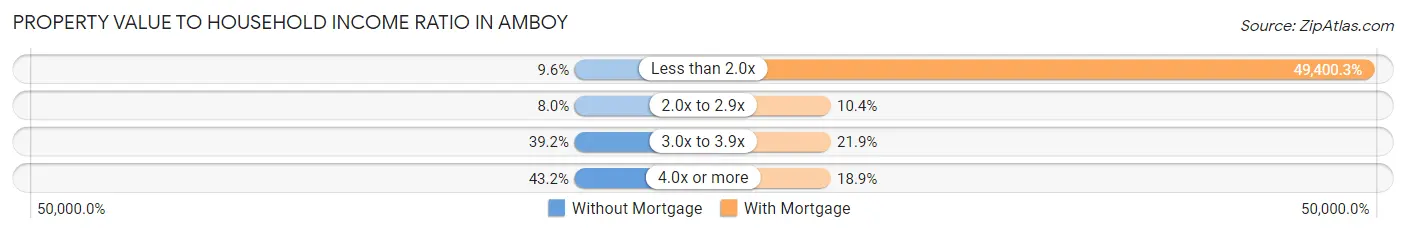
| Value-to-Income Ratio | Without Mortgage | With Mortgage |
| Less than 2.0x | 12 (9.6%) | 146,719 (49,400.3%) |
| 2.0x to 2.9x | 10 (8.0%) | 31 (10.4%) |
| 3.0x to 3.9x | 49 (39.2%) | 65 (21.9%) |
| 4.0x or more | 54 (43.2%) | 56 (18.9%) |
| Total | 125 (100.0%) | 297 (100.0%) |
Real Estate Taxes by Mortgage Status in Amboy
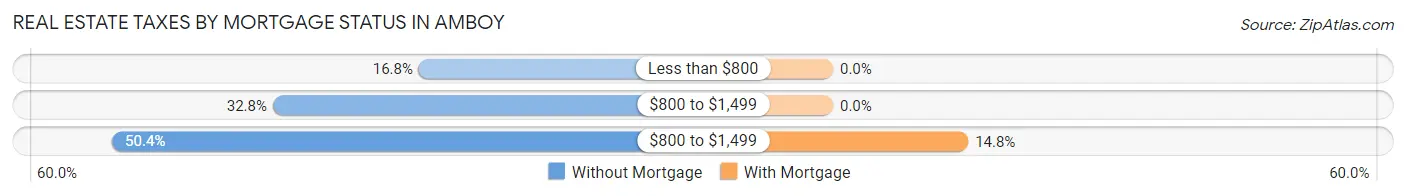
| Property Taxes | Without Mortgage | With Mortgage |
| Less than $800 | 21 (16.8%) | 0 (0.0%) |
| $800 to $1,499 | 41 (32.8%) | 0 (0.0%) |
| $800 to $1,499 | 63 (50.4%) | 44 (14.8%) |
| Total | 125 (100.0%) | 297 (100.0%) |
Health & Disability in Amboy
Health Insurance Coverage by Age in Amboy
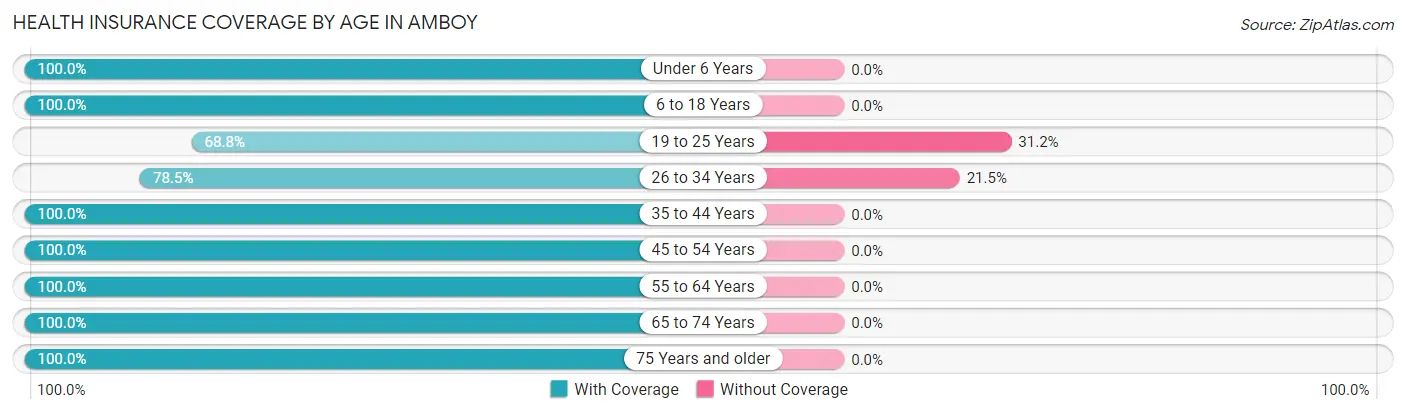
| Age Bracket | With Coverage | Without Coverage |
| Under 6 Years | 166 (100.0%) | 0 (0.0%) |
| 6 to 18 Years | 292 (100.0%) | 0 (0.0%) |
| 19 to 25 Years | 137 (68.8%) | 62 (31.2%) |
| 26 to 34 Years | 215 (78.5%) | 59 (21.5%) |
| 35 to 44 Years | 83 (100.0%) | 0 (0.0%) |
| 45 to 54 Years | 211 (100.0%) | 0 (0.0%) |
| 55 to 64 Years | 180 (100.0%) | 0 (0.0%) |
| 65 to 74 Years | 205 (100.0%) | 0 (0.0%) |
| 75 Years and older | 70 (100.0%) | 0 (0.0%) |
| Total | 1,559 (92.8%) | 121 (7.2%) |
Health Insurance Coverage by Citizenship Status in Amboy
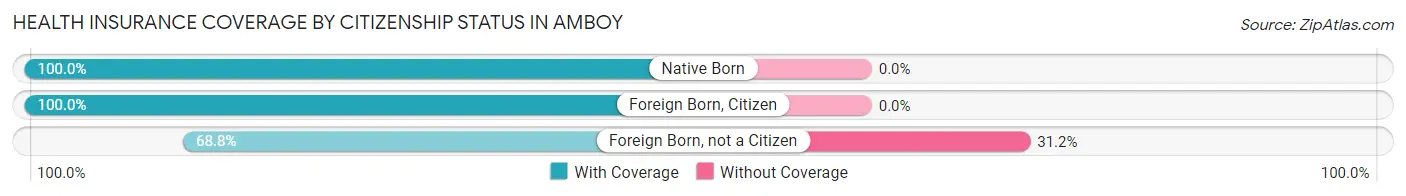
| Citizenship Status | With Coverage | Without Coverage |
| Native Born | 166 (100.0%) | 0 (0.0%) |
| Foreign Born, Citizen | 292 (100.0%) | 0 (0.0%) |
| Foreign Born, not a Citizen | 137 (68.8%) | 62 (31.2%) |
Health Insurance Coverage by Household Income in Amboy
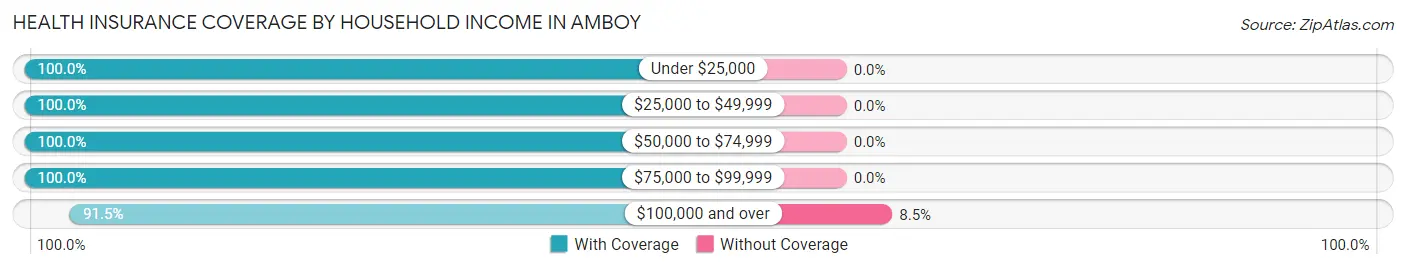
| Household Income | With Coverage | Without Coverage |
| Under $25,000 | 158 (100.0%) | 0 (0.0%) |
| $25,000 to $49,999 | 38 (100.0%) | 0 (0.0%) |
| $50,000 to $74,999 | 11 (100.0%) | 0 (0.0%) |
| $75,000 to $99,999 | 56 (100.0%) | 0 (0.0%) |
| $100,000 and over | 1,296 (91.5%) | 121 (8.5%) |
Public vs Private Health Insurance Coverage by Age in Amboy
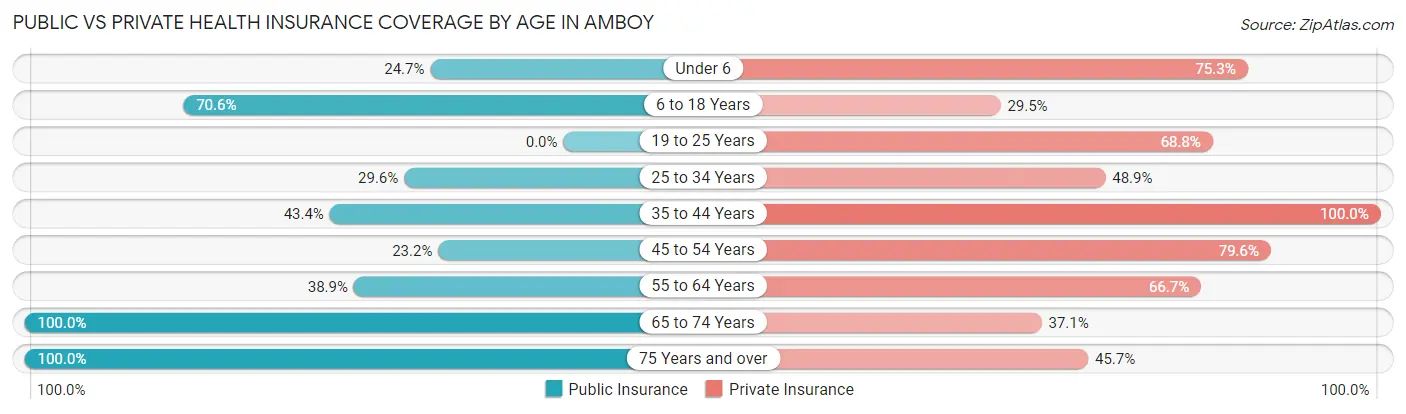
| Age Bracket | Public Insurance | Private Insurance |
| Under 6 | 41 (24.7%) | 125 (75.3%) |
| 6 to 18 Years | 206 (70.6%) | 86 (29.4%) |
| 19 to 25 Years | 0 (0.0%) | 137 (68.8%) |
| 25 to 34 Years | 81 (29.6%) | 134 (48.9%) |
| 35 to 44 Years | 36 (43.4%) | 83 (100.0%) |
| 45 to 54 Years | 49 (23.2%) | 168 (79.6%) |
| 55 to 64 Years | 70 (38.9%) | 120 (66.7%) |
| 65 to 74 Years | 205 (100.0%) | 76 (37.1%) |
| 75 Years and over | 70 (100.0%) | 32 (45.7%) |
| Total | 758 (45.1%) | 961 (57.2%) |
Disability Status by Sex by Age in Amboy
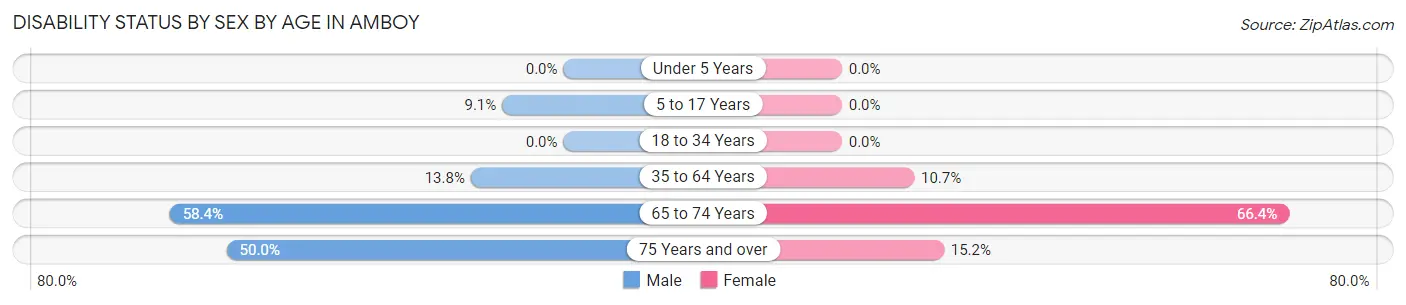
| Age Bracket | Male | Female |
| Under 5 Years | 0 (0.0%) | 0 (0.0%) |
| 5 to 17 Years | 12 (9.1%) | 0 (0.0%) |
| 18 to 34 Years | 0 (0.0%) | 0 (0.0%) |
| 35 to 64 Years | 37 (13.8%) | 22 (10.7%) |
| 65 to 74 Years | 45 (58.4%) | 85 (66.4%) |
| 75 Years and over | 2 (50.0%) | 10 (15.1%) |
Disability Class by Sex by Age in Amboy
Disability Class: Hearing Difficulty
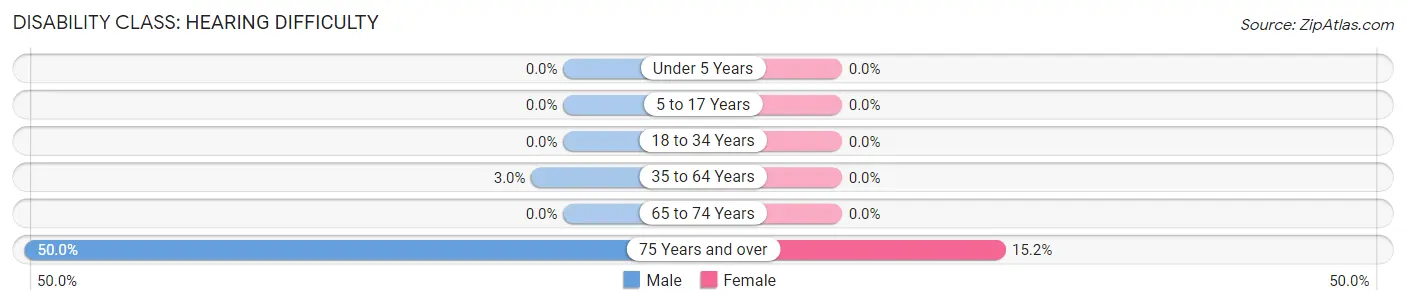
| Age Bracket | Male | Female |
| Under 5 Years | 0 (0.0%) | 0 (0.0%) |
| 5 to 17 Years | 0 (0.0%) | 0 (0.0%) |
| 18 to 34 Years | 0 (0.0%) | 0 (0.0%) |
| 35 to 64 Years | 8 (3.0%) | 0 (0.0%) |
| 65 to 74 Years | 0 (0.0%) | 0 (0.0%) |
| 75 Years and over | 2 (50.0%) | 10 (15.1%) |
Disability Class: Vision Difficulty
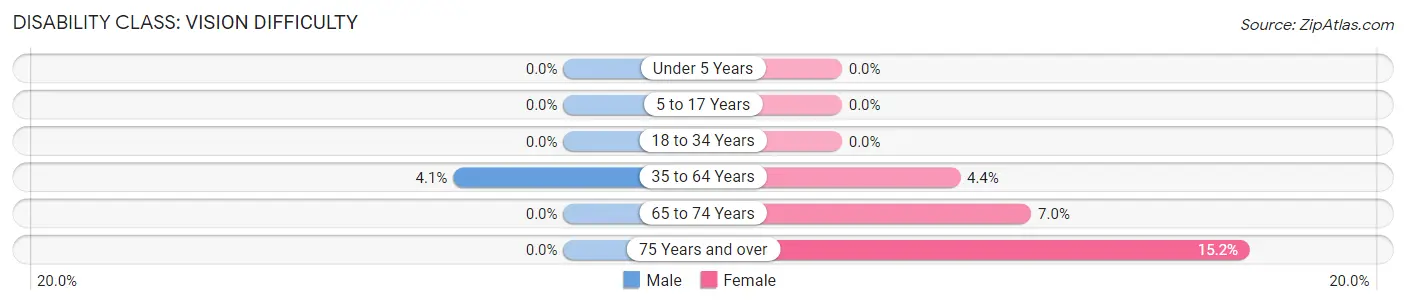
| Age Bracket | Male | Female |
| Under 5 Years | 0 (0.0%) | 0 (0.0%) |
| 5 to 17 Years | 0 (0.0%) | 0 (0.0%) |
| 18 to 34 Years | 0 (0.0%) | 0 (0.0%) |
| 35 to 64 Years | 11 (4.1%) | 9 (4.4%) |
| 65 to 74 Years | 0 (0.0%) | 9 (7.0%) |
| 75 Years and over | 0 (0.0%) | 10 (15.1%) |
Disability Class: Cognitive Difficulty
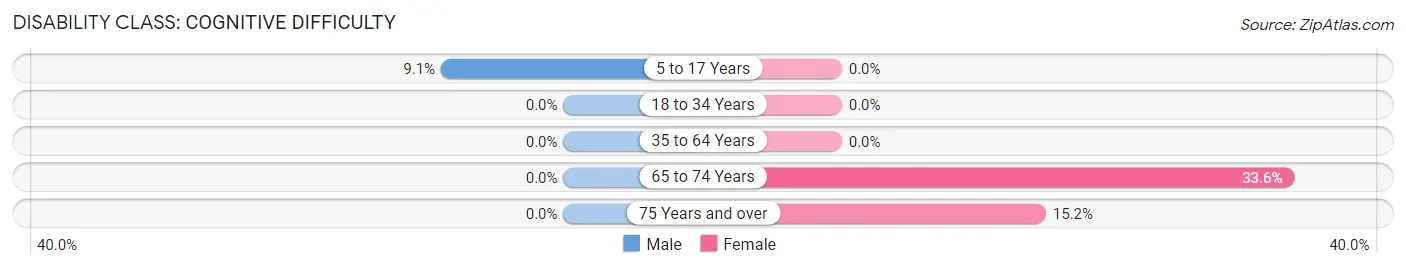
| Age Bracket | Male | Female |
| 5 to 17 Years | 12 (9.1%) | 0 (0.0%) |
| 18 to 34 Years | 0 (0.0%) | 0 (0.0%) |
| 35 to 64 Years | 0 (0.0%) | 0 (0.0%) |
| 65 to 74 Years | 0 (0.0%) | 43 (33.6%) |
| 75 Years and over | 0 (0.0%) | 10 (15.1%) |
Disability Class: Ambulatory Difficulty
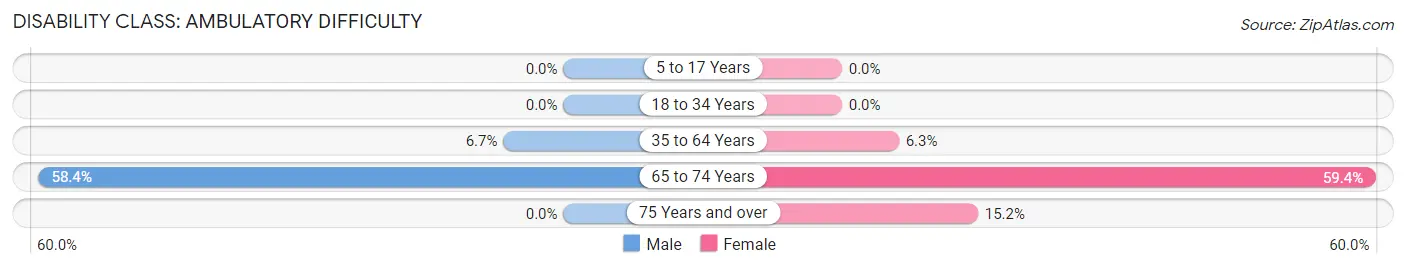
| Age Bracket | Male | Female |
| 5 to 17 Years | 0 (0.0%) | 0 (0.0%) |
| 18 to 34 Years | 0 (0.0%) | 0 (0.0%) |
| 35 to 64 Years | 18 (6.7%) | 13 (6.3%) |
| 65 to 74 Years | 45 (58.4%) | 76 (59.4%) |
| 75 Years and over | 0 (0.0%) | 10 (15.1%) |
Disability Class: Self-Care Difficulty
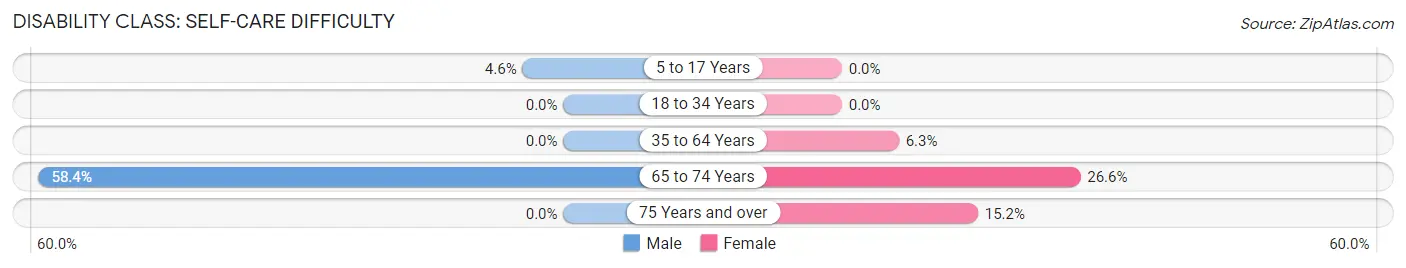
| Age Bracket | Male | Female |
| 5 to 17 Years | 6 (4.5%) | 0 (0.0%) |
| 18 to 34 Years | 0 (0.0%) | 0 (0.0%) |
| 35 to 64 Years | 0 (0.0%) | 13 (6.3%) |
| 65 to 74 Years | 45 (58.4%) | 34 (26.6%) |
| 75 Years and over | 0 (0.0%) | 10 (15.1%) |
Technology Access in Amboy
Computing Device Access in Amboy
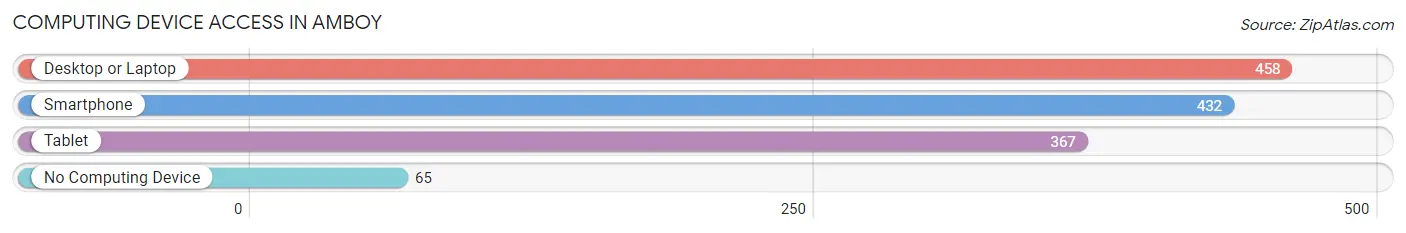
| Device Type | # Households | % Households |
| Desktop or Laptop | 458 | 87.4% |
| Smartphone | 432 | 82.4% |
| Tablet | 367 | 70.0% |
| No Computing Device | 65 | 12.4% |
| Total | 524 | 100.0% |
Internet Access in Amboy
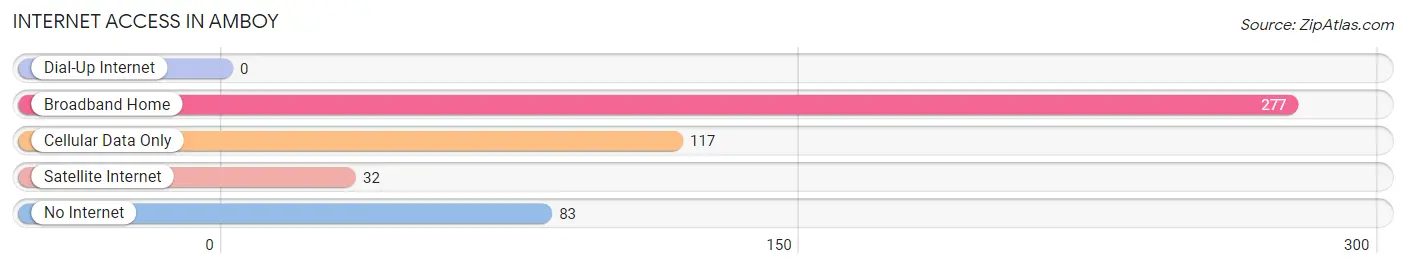
| Internet Type | # Households | % Households |
| Dial-Up Internet | 0 | 0.0% |
| Broadband Home | 277 | 52.9% |
| Cellular Data Only | 117 | 22.3% |
| Satellite Internet | 32 | 6.1% |
| No Internet | 83 | 15.8% |
| Total | 524 | 100.0% |
Amboy Summary
Amboy is a small unincorporated community located in Clark County, Washington, United States. It is situated along the Lewis River, approximately 8 miles (13 km) east of the city of Vancouver. The population of Amboy was estimated to be 1,845 in 2019.
History
Amboy was first settled in 1845 by a group of settlers from the Oregon Trail. The settlement was originally known as "Amboy Station" and was a stop on the Oregon Trail. The name was changed to Amboy in 1853.
The town was officially incorporated in 1891 and was home to a variety of businesses, including a sawmill, a flour mill, a blacksmith shop, a general store, and a post office. The town also had a school, a church, and a hotel.
In the early 1900s, Amboy was a thriving community with a population of over 1,000 people. The town was home to a variety of businesses, including a bank, a newspaper, a movie theater, and a variety of stores.
Geography
Amboy is located in Clark County, Washington, approximately 8 miles (13 km) east of the city of Vancouver. The town is situated along the Lewis River, which flows through the area. The town is surrounded by rolling hills and is located in a rural area.
The climate in Amboy is mild and temperate, with warm summers and cool winters. The average annual temperature is around 50°F (10°C). The average annual precipitation is around 40 inches (102 cm).
Economy
The economy of Amboy is largely based on agriculture and tourism. The town is home to a variety of farms, including dairy farms, fruit farms, and vegetable farms. The town is also home to a variety of tourist attractions, including the Lewis River Trail, the Amboy Historical Museum, and the Amboy Depot Museum.
The town is also home to a variety of businesses, including restaurants, retail stores, and service providers. The town is also home to a variety of manufacturing businesses, including a woodworking shop and a metal fabrication shop.
Demographics
The population of Amboy was estimated to be 1,845 in 2019. The population is largely white (94.3%), with a small percentage of African Americans (2.2%), Asians (1.2%), and Native Americans (0.7%). The median household income is $50,945, and the median age is 40.
Conclusion
Amboy is a small unincorporated community located in Clark County, Washington, United States. It is situated along the Lewis River, approximately 8 miles (13 km) east of the city of Vancouver. The population of Amboy was estimated to be 1,845 in 2019. The town is surrounded by rolling hills and is located in a rural area. The economy of Amboy is largely based on agriculture and tourism. The population is largely white (94.3%), with a small percentage of African Americans (2.2%), Asians (1.2%), and Native Americans (0.7%). The median household income is $50,945, and the median age is 40.
Common Questions
What is Per Capita Income in Amboy?
Per Capita income in Amboy is $40,801.
What is the Median Family Income in Amboy?
Median Family Income in Amboy is $169,375.
What is the Median Household income in Amboy?
Median Household Income in Amboy is $138,021.
What is Income or Wage Gap in Amboy?
Income or Wage Gap in Amboy is 55.9%.
Women in Amboy earn 44.1 cents for every dollar earned by a man.
What is Inequality or Gini Index in Amboy?
Inequality or Gini Index in Amboy is 0.39.
What is the Total Population of Amboy?
Total Population of Amboy is 1,680.
What is the Total Male Population of Amboy?
Total Male Population of Amboy is 699.
What is the Total Female Population of Amboy?
Total Female Population of Amboy is 981.
What is the Ratio of Males per 100 Females in Amboy?
There are 71.25 Males per 100 Females in Amboy.
What is the Ratio of Females per 100 Males in Amboy?
There are 140.34 Females per 100 Males in Amboy.
What is the Median Population Age in Amboy?
Median Population Age in Amboy is 30.6 Years.
What is the Average Family Size in Amboy
Average Family Size in Amboy is 4.2 People.
What is the Average Household Size in Amboy
Average Household Size in Amboy is 3.2 People.
How Large is the Labor Force in Amboy?
There are 794 People in the Labor Forcein in Amboy.
What is the Percentage of People in the Labor Force in Amboy?
61.8% of People are in the Labor Force in Amboy.
What is the Unemployment Rate in Amboy?
Unemployment Rate in Amboy is 4.2%.