Bell Hill, WA Map & Demographics
Bell Hill Map
Bell Hill Overview
$56,163
PER CAPITA INCOME
$73,679
AVG HOUSEHOLD INCOME
0.36
INEQUALITY / GINI INDEX
900
TOTAL POPULATION
491
MALE POPULATION
409
FEMALE POPULATION
120.05
MALES / 100 FEMALES
83.30
FEMALES / 100 MALES
70.3
MEDIAN AGE
2.2
AVG FAMILY SIZE
1.8
AVG HOUSEHOLD SIZE
130
LABOR FORCE [ PEOPLE ]
14.4%
PERCENT IN LABOR FORCE
23.1%
UNEMPLOYMENT RATE
Income in Bell Hill
Income Overview in Bell Hill
| Characteristic | Number | Measure |
| Per Capita Income | 900 | $56,163 |
| Median Family Income | 338 | $0 |
| Mean Family Income | 338 | $103,412 |
| Median Household Income | 502 | $73,679 |
| Mean Household Income | 502 | $103,533 |
| Income Deficit | 338 | $0 |
| Wage / Income Gap (%) | 900 | 0.00% |
| Wage / Income Gap ($) | 900 | 100.00¢ per $1 |
| Gini / Inequality Index | 900 | 0.36 |
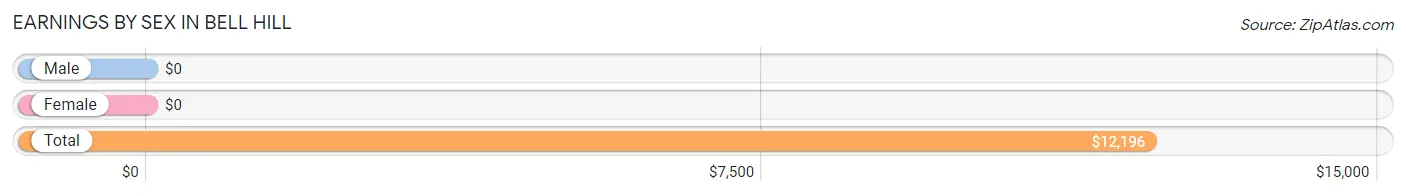
Earnings by Sex in Bell Hill
| Sex | Number | Average Earnings |
| Male | 90 (66.7%) | $0 |
| Female | 45 (33.3%) | $0 |
| Total | 135 (100.0%) | $12,196 |
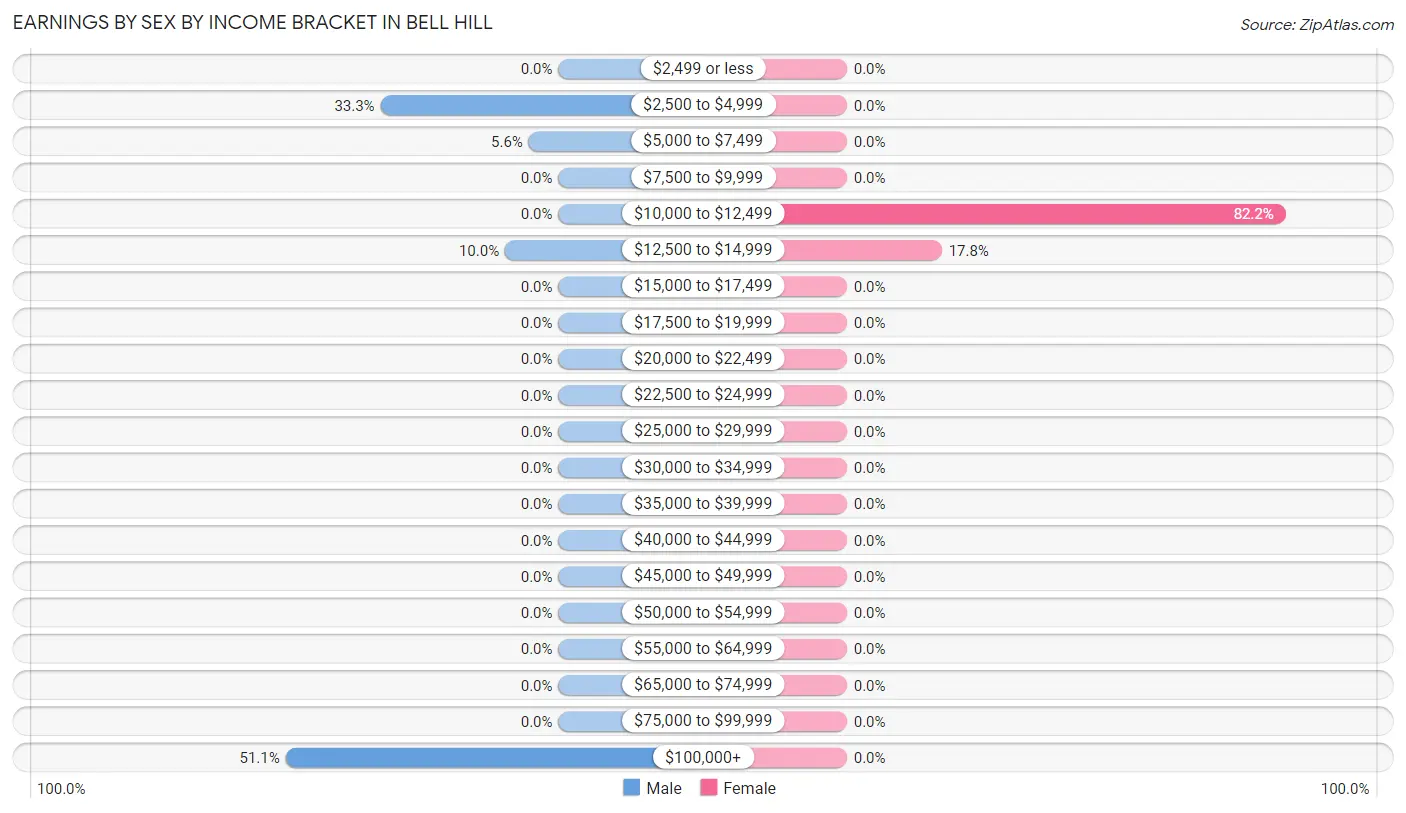
Earnings by Sex by Income Bracket in Bell Hill
The most common earnings brackets in Bell Hill are $100,000+ for men (46 | 51.1%) and $10,000 to $12,499 for women (37 | 82.2%).
| Income | Male | Female |
| $2,499 or less | 0 (0.0%) | 0 (0.0%) |
| $2,500 to $4,999 | 30 (33.3%) | 0 (0.0%) |
| $5,000 to $7,499 | 5 (5.6%) | 0 (0.0%) |
| $7,500 to $9,999 | 0 (0.0%) | 0 (0.0%) |
| $10,000 to $12,499 | 0 (0.0%) | 37 (82.2%) |
| $12,500 to $14,999 | 9 (10.0%) | 8 (17.8%) |
| $15,000 to $17,499 | 0 (0.0%) | 0 (0.0%) |
| $17,500 to $19,999 | 0 (0.0%) | 0 (0.0%) |
| $20,000 to $22,499 | 0 (0.0%) | 0 (0.0%) |
| $22,500 to $24,999 | 0 (0.0%) | 0 (0.0%) |
| $25,000 to $29,999 | 0 (0.0%) | 0 (0.0%) |
| $30,000 to $34,999 | 0 (0.0%) | 0 (0.0%) |
| $35,000 to $39,999 | 0 (0.0%) | 0 (0.0%) |
| $40,000 to $44,999 | 0 (0.0%) | 0 (0.0%) |
| $45,000 to $49,999 | 0 (0.0%) | 0 (0.0%) |
| $50,000 to $54,999 | 0 (0.0%) | 0 (0.0%) |
| $55,000 to $64,999 | 0 (0.0%) | 0 (0.0%) |
| $65,000 to $74,999 | 0 (0.0%) | 0 (0.0%) |
| $75,000 to $99,999 | 0 (0.0%) | 0 (0.0%) |
| $100,000+ | 46 (51.1%) | 0 (0.0%) |
| Total | 90 (100.0%) | 45 (100.0%) |
Earnings by Sex by Educational Attainment in Bell Hill
| Educational Attainment | Male Income | Female Income |
| Less than High School | - | - |
| High School Diploma | - | - |
| College or Associate's Degree | - | - |
| Bachelor's Degree | - | - |
| Graduate Degree | - | - |
| Total | $143,750 | $0 |
Family Income in Bell Hill
Family Income Brackets in Bell Hill
According to the Bell Hill family income data, there are 88 families falling into the $150,000 to $199,999 income range, which is the most common income bracket and makes up 26.0% of all families.
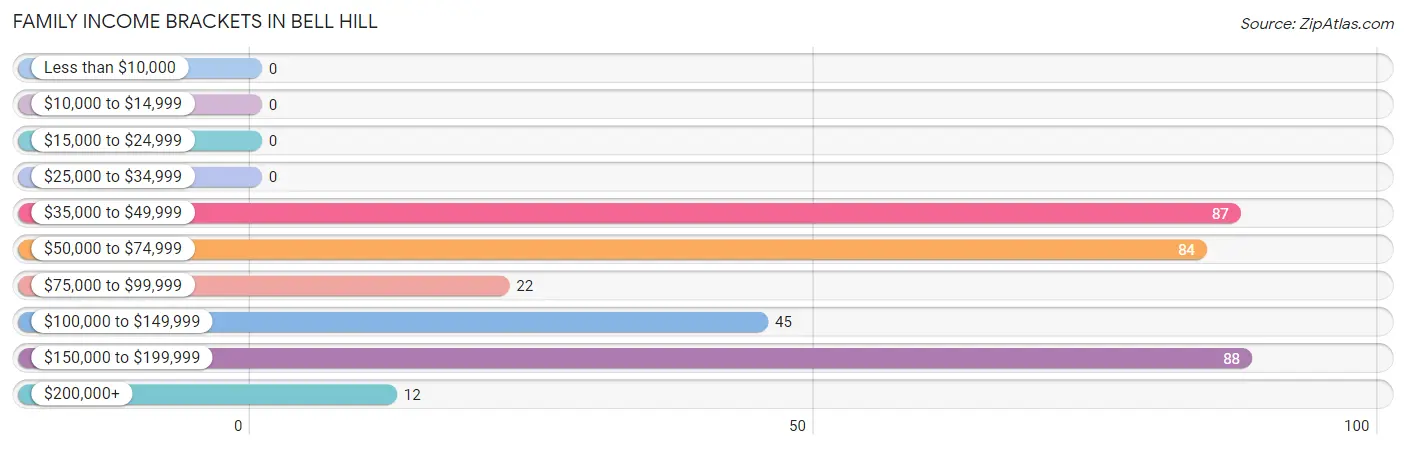
| Income Bracket | # Families | % Families |
| Less than $10,000 | 0 | 0.0% |
| $10,000 to $14,999 | 0 | 0.0% |
| $15,000 to $24,999 | 0 | 0.0% |
| $25,000 to $34,999 | 0 | 0.0% |
| $35,000 to $49,999 | 87 | 25.7% |
| $50,000 to $74,999 | 84 | 24.9% |
| $75,000 to $99,999 | 22 | 6.5% |
| $100,000 to $149,999 | 45 | 13.3% |
| $150,000 to $199,999 | 88 | 26.0% |
| $200,000+ | 12 | 3.6% |
Family Income by Famaliy Size in Bell Hill
2-person families (298 | 88.2%) account for the highest median family income in Bell Hill with $69,352 per family, while 2-person families (298 | 88.2%) have the highest median income of $34,676 per family member.
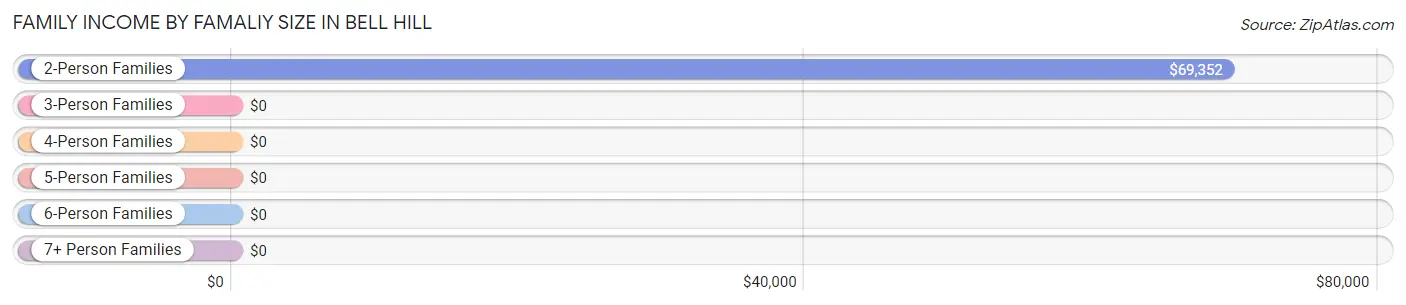
| Income Bracket | # Families | Median Income |
| 2-Person Families | 298 (88.2%) | $69,352 |
| 3-Person Families | 32 (9.5%) | $0 |
| 4-Person Families | 8 (2.4%) | $0 |
| 5-Person Families | 0 (0.0%) | $0 |
| 6-Person Families | 0 (0.0%) | $0 |
| 7+ Person Families | 0 (0.0%) | $0 |
| Total | 338 (100.0%) | $0 |
Family Income by Number of Earners in Bell Hill
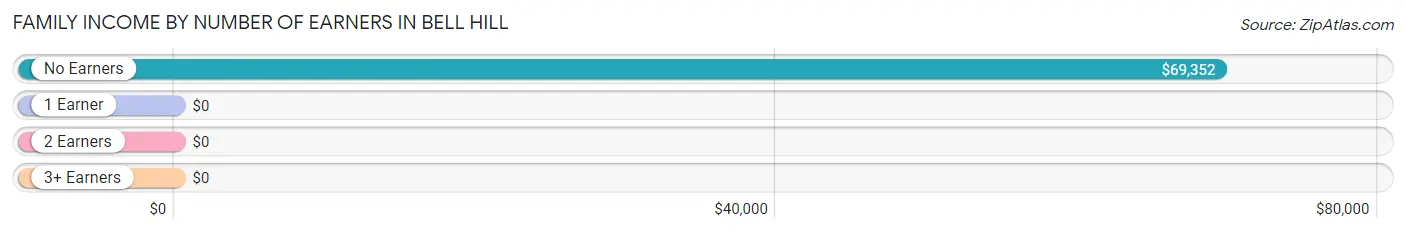
| Number of Earners | # Families | Median Income |
| No Earners | 298 (88.2%) | $69,352 |
| 1 Earner | 0 (0.0%) | $0 |
| 2 Earners | 8 (2.4%) | $0 |
| 3+ Earners | 32 (9.5%) | $0 |
| Total | 338 (100.0%) | $0 |
Household Income in Bell Hill
Household Income Brackets in Bell Hill
With 199 households falling in the category, the $50,000 to $74,999 income range is the most frequent in Bell Hill, accounting for 39.6% of all households.
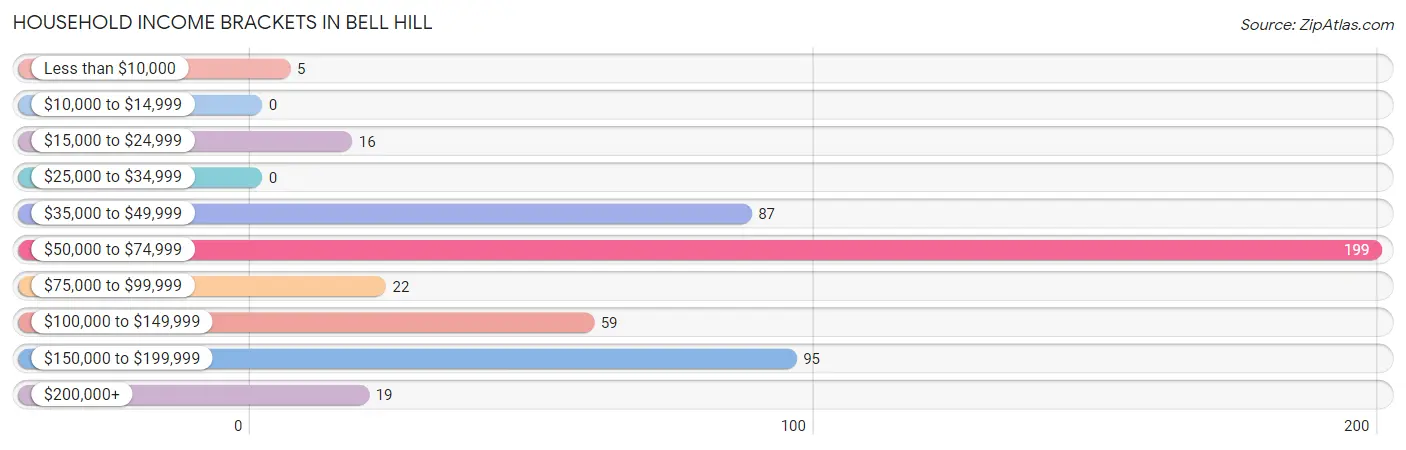
| Income Bracket | # Households | % Households |
| Less than $10,000 | 5 | 1.0% |
| $10,000 to $14,999 | 0 | 0.0% |
| $15,000 to $24,999 | 16 | 3.2% |
| $25,000 to $34,999 | 0 | 0.0% |
| $35,000 to $49,999 | 87 | 17.3% |
| $50,000 to $74,999 | 199 | 39.6% |
| $75,000 to $99,999 | 22 | 4.4% |
| $100,000 to $149,999 | 59 | 11.8% |
| $150,000 to $199,999 | 95 | 18.9% |
| $200,000+ | 19 | 3.8% |
Household Income by Householder Age in Bell Hill
The median household income in Bell Hill is $73,679, with the highest median household income of $126,316 found in the 45 to 64 years age bracket for the primary householder. A total of 82 households (16.3%) fall into this category.
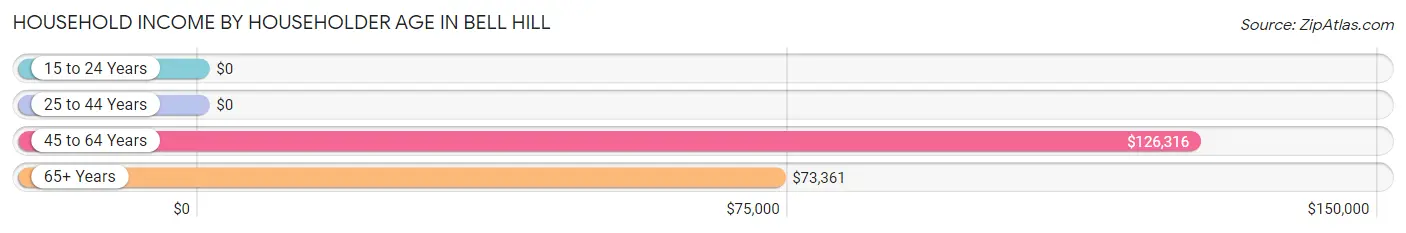
| Income Bracket | # Households | Median Income |
| 15 to 24 Years | 0 (0.0%) | $0 |
| 25 to 44 Years | 7 (1.4%) | $0 |
| 45 to 64 Years | 82 (16.3%) | $126,316 |
| 65+ Years | 413 (82.3%) | $73,361 |
| Total | 502 (100.0%) | $73,679 |
Poverty in Bell Hill
Income Below Poverty by Sex and Age in Bell Hill
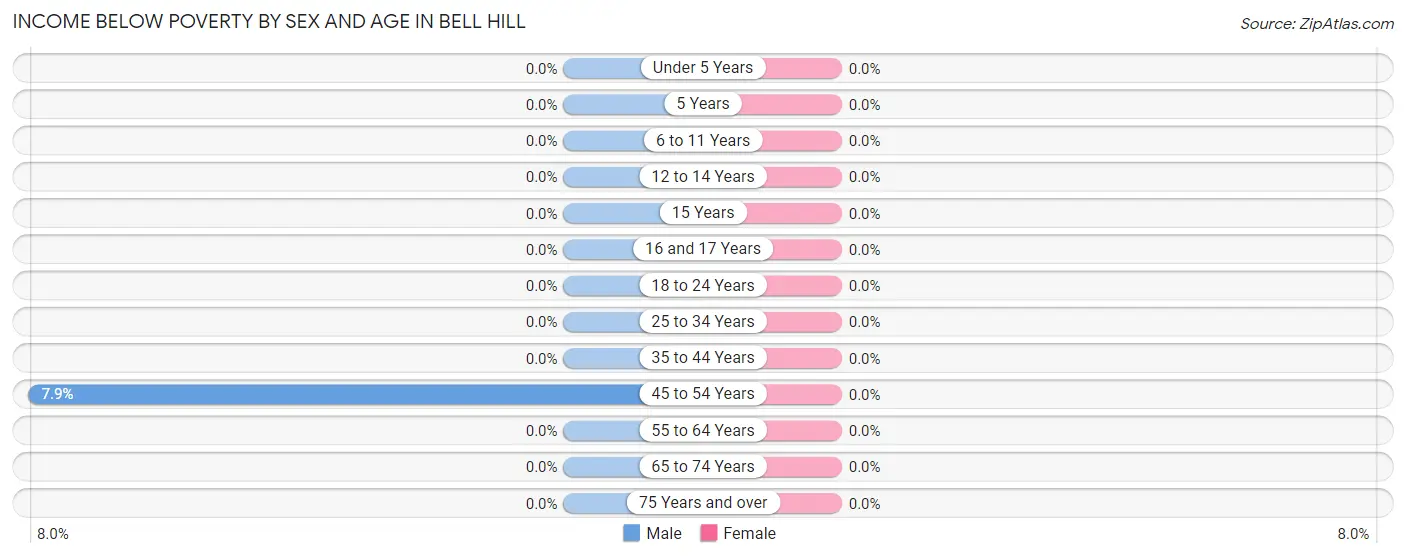
| Age Bracket | Male | Female |
| Under 5 Years | 0 (0.0%) | 0 (0.0%) |
| 5 Years | 0 (0.0%) | 0 (0.0%) |
| 6 to 11 Years | 0 (0.0%) | 0 (0.0%) |
| 12 to 14 Years | 0 (0.0%) | 0 (0.0%) |
| 15 Years | 0 (0.0%) | 0 (0.0%) |
| 16 and 17 Years | 0 (0.0%) | 0 (0.0%) |
| 18 to 24 Years | 0 (0.0%) | 0 (0.0%) |
| 25 to 34 Years | 0 (0.0%) | 0 (0.0%) |
| 35 to 44 Years | 0 (0.0%) | 0 (0.0%) |
| 45 to 54 Years | 5 (7.9%) | 0 (0.0%) |
| 55 to 64 Years | 0 (0.0%) | 0 (0.0%) |
| 65 to 74 Years | 0 (0.0%) | 0 (0.0%) |
| 75 Years and over | 0 (0.0%) | 0 (0.0%) |
| Total | 5 (1.0%) | 0 (0.0%) |
Income Above Poverty by Sex and Age in Bell Hill
According to the poverty statistics in Bell Hill, males aged 18 to 24 years and females aged 18 to 24 years are the age groups that are most secure financially, with 100.0% of males and 100.0% of females in these age groups living above the poverty line.
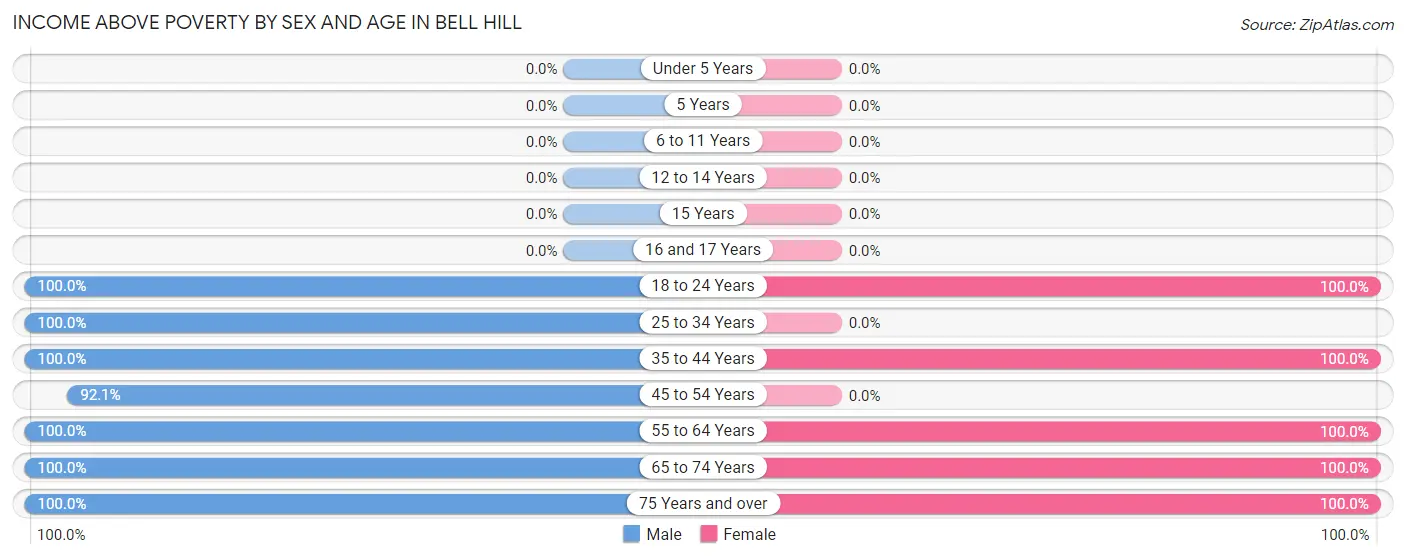
| Age Bracket | Male | Female |
| Under 5 Years | 0 (0.0%) | 0 (0.0%) |
| 5 Years | 0 (0.0%) | 0 (0.0%) |
| 6 to 11 Years | 0 (0.0%) | 0 (0.0%) |
| 12 to 14 Years | 0 (0.0%) | 0 (0.0%) |
| 15 Years | 0 (0.0%) | 0 (0.0%) |
| 16 and 17 Years | 0 (0.0%) | 0 (0.0%) |
| 18 to 24 Years | 30 (100.0%) | 37 (100.0%) |
| 25 to 34 Years | 7 (100.0%) | 0 (0.0%) |
| 35 to 44 Years | 9 (100.0%) | 8 (100.0%) |
| 45 to 54 Years | 58 (92.1%) | 0 (0.0%) |
| 55 to 64 Years | 6 (100.0%) | 114 (100.0%) |
| 65 to 74 Years | 161 (100.0%) | 176 (100.0%) |
| 75 Years and over | 215 (100.0%) | 74 (100.0%) |
| Total | 486 (99.0%) | 409 (100.0%) |
Income Below Poverty Among Married-Couple Families in Bell Hill
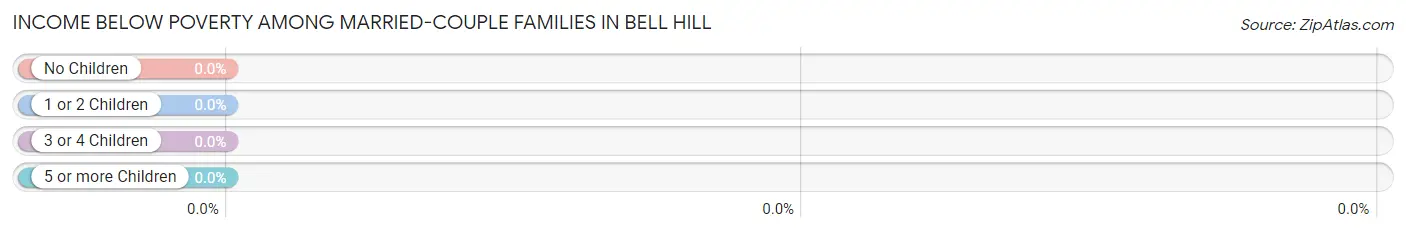
| Children | Above Poverty | Below Poverty |
| No Children | 280 (100.0%) | 0 (0.0%) |
| 1 or 2 Children | 0 (0.0%) | 0 (0.0%) |
| 3 or 4 Children | 0 (0.0%) | 0 (0.0%) |
| 5 or more Children | 0 (0.0%) | 0 (0.0%) |
| Total | 280 (100.0%) | 0 (0.0%) |
Income Below Poverty Among Single-Parent Households in Bell Hill
| Children | Single Father | Single Mother |
| No Children | 0 (0.0%) | 0 (0.0%) |
| 1 or 2 Children | 0 (0.0%) | 0 (0.0%) |
| 3 or 4 Children | 0 (0.0%) | 0 (0.0%) |
| 5 or more Children | 0 (0.0%) | 0 (0.0%) |
| Total | 0 (0.0%) | 0 (0.0%) |
Income Below Poverty Among Married-Couple vs Single-Parent Households in Bell Hill
| Children | Married-Couple Families | Single-Parent Households |
| No Children | 0 (0.0%) | 0 (0.0%) |
| 1 or 2 Children | 0 (0.0%) | 0 (0.0%) |
| 3 or 4 Children | 0 (0.0%) | 0 (0.0%) |
| 5 or more Children | 0 (0.0%) | 0 (0.0%) |
| Total | 0 (0.0%) | 0 (0.0%) |
Race in Bell Hill
The most populous races in Bell Hill are White / Caucasian (808 | 89.8%), Asian (62 | 6.9%), and Two or more Races (30 | 3.3%).
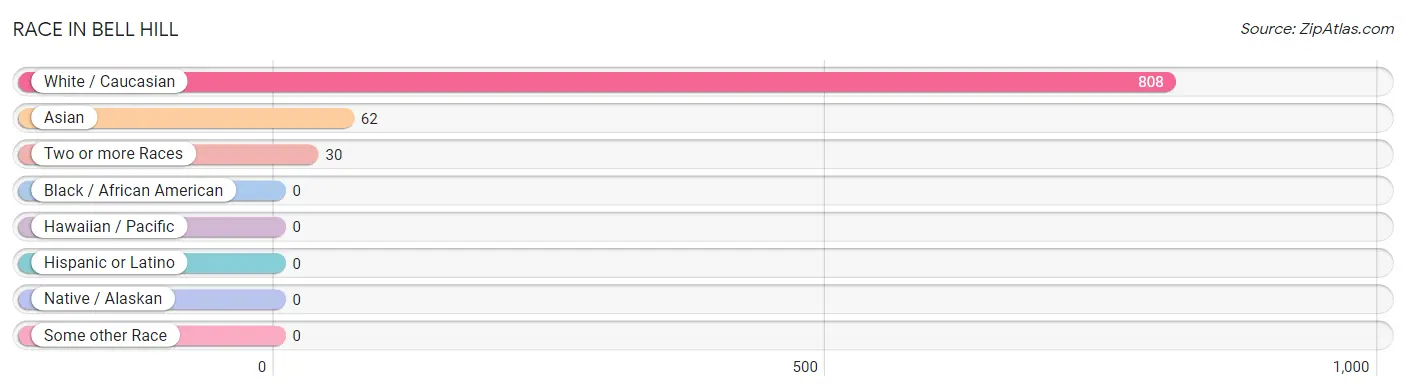
| Race | # Population | % Population |
| Asian | 62 | 6.9% |
| Black / African American | 0 | 0.0% |
| Hawaiian / Pacific | 0 | 0.0% |
| Hispanic or Latino | 0 | 0.0% |
| Native / Alaskan | 0 | 0.0% |
| White / Caucasian | 808 | 89.8% |
| Two or more Races | 30 | 3.3% |
| Some other Race | 0 | 0.0% |
| Total | 900 | 100.0% |
Ancestry in Bell Hill
The most populous ancestries reported in Bell Hill are English (224 | 24.9%), German (203 | 22.6%), Irish (109 | 12.1%), Italian (102 | 11.3%), and Indonesian (67 | 7.4%), together accounting for 78.3% of all Bell Hill residents.
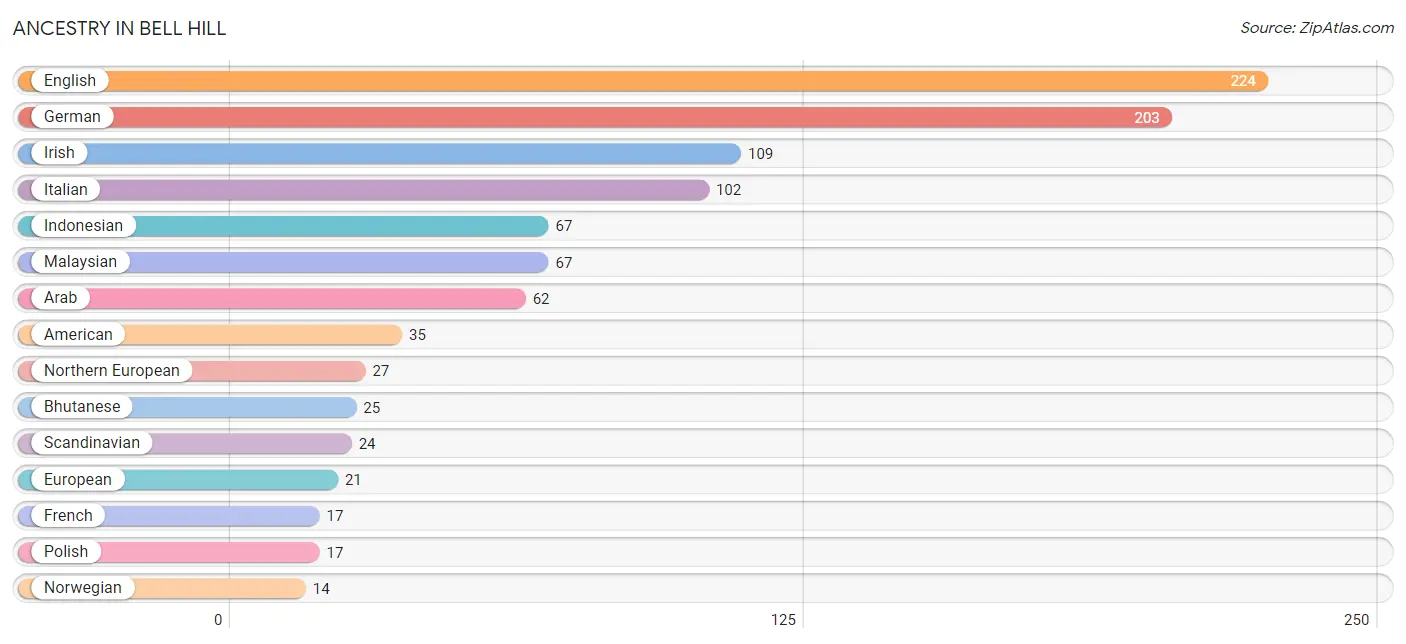
| Ancestry | # Population | % Population |
| American | 35 | 3.9% |
| Arab | 62 | 6.9% |
| Bhutanese | 25 | 2.8% |
| Canadian | 12 | 1.3% |
| Danish | 8 | 0.9% |
| English | 224 | 24.9% |
| European | 21 | 2.3% |
| French | 17 | 1.9% |
| German | 203 | 22.6% |
| Indonesian | 67 | 7.4% |
| Irish | 109 | 12.1% |
| Italian | 102 | 11.3% |
| Malaysian | 67 | 7.4% |
| Northern European | 27 | 3.0% |
| Norwegian | 14 | 1.6% |
| Polish | 17 | 1.9% |
| Russian | 7 | 0.8% |
| Scandinavian | 24 | 2.7% | View All 18 Rows |
Immigrants in Bell Hill
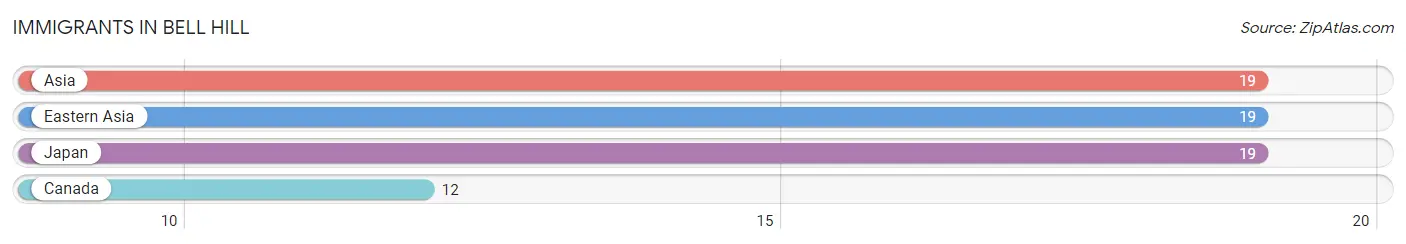
The most numerous immigrant groups reported in Bell Hill came from Asia (19 | 2.1%), Eastern Asia (19 | 2.1%), Japan (19 | 2.1%), and Canada (12 | 1.3%), together accounting for 7.7% of all Bell Hill residents.
| Immigration Origin | # Population | % Population |
| Asia | 19 | 2.1% |
| Canada | 12 | 1.3% |
| Eastern Asia | 19 | 2.1% |
| Japan | 19 | 2.1% | View All 4 Rows |
Sex and Age in Bell Hill
Sex and Age in Bell Hill
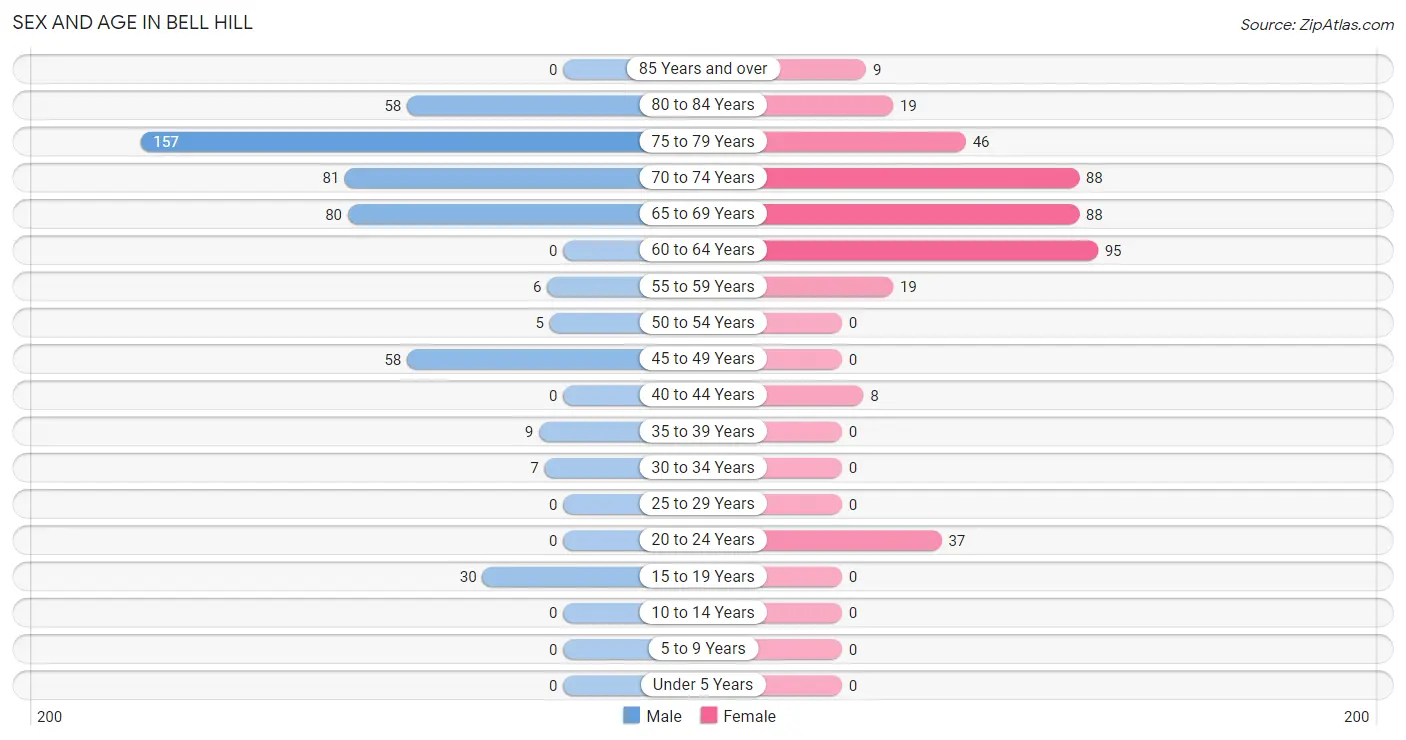
The most populous age groups in Bell Hill are 75 to 79 Years (157 | 32.0%) for men and 60 to 64 Years (95 | 23.2%) for women.
| Age Bracket | Male | Female |
| Under 5 Years | 0 (0.0%) | 0 (0.0%) |
| 5 to 9 Years | 0 (0.0%) | 0 (0.0%) |
| 10 to 14 Years | 0 (0.0%) | 0 (0.0%) |
| 15 to 19 Years | 30 (6.1%) | 0 (0.0%) |
| 20 to 24 Years | 0 (0.0%) | 37 (9.0%) |
| 25 to 29 Years | 0 (0.0%) | 0 (0.0%) |
| 30 to 34 Years | 7 (1.4%) | 0 (0.0%) |
| 35 to 39 Years | 9 (1.8%) | 0 (0.0%) |
| 40 to 44 Years | 0 (0.0%) | 8 (2.0%) |
| 45 to 49 Years | 58 (11.8%) | 0 (0.0%) |
| 50 to 54 Years | 5 (1.0%) | 0 (0.0%) |
| 55 to 59 Years | 6 (1.2%) | 19 (4.6%) |
| 60 to 64 Years | 0 (0.0%) | 95 (23.2%) |
| 65 to 69 Years | 80 (16.3%) | 88 (21.5%) |
| 70 to 74 Years | 81 (16.5%) | 88 (21.5%) |
| 75 to 79 Years | 157 (32.0%) | 46 (11.3%) |
| 80 to 84 Years | 58 (11.8%) | 19 (4.6%) |
| 85 Years and over | 0 (0.0%) | 9 (2.2%) |
| Total | 491 (100.0%) | 409 (100.0%) |
Families and Households in Bell Hill
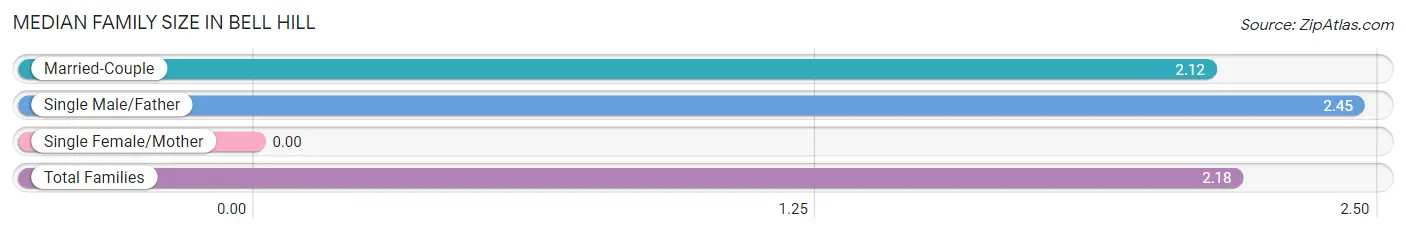
Median Family Size in Bell Hill
| Family Type | # Families | Family Size |
| Married-Couple | 280 (82.8%) | 2.12 |
| Single Male/Father | 58 (17.2%) | 2.45 |
| Single Female/Mother | 0 (0.0%) | - |
| Total Families | 338 (100.0%) | 2.18 |
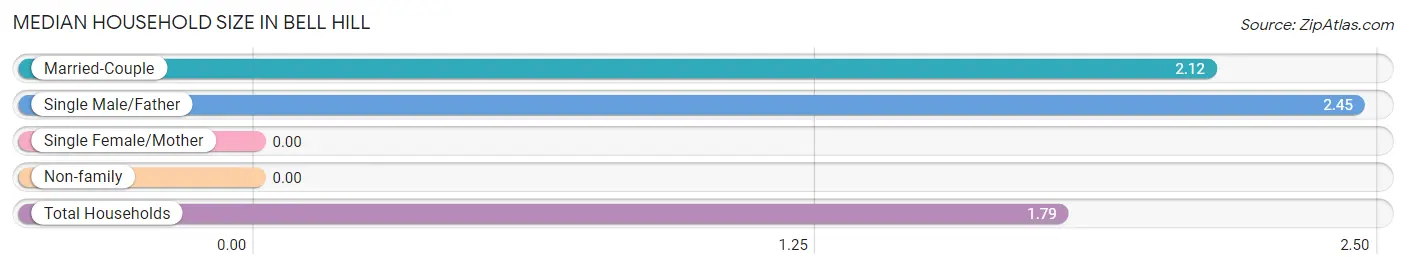
Median Household Size in Bell Hill
| Household Type | # Households | Household Size |
| Married-Couple | 280 (55.8%) | 2.12 |
| Single Male/Father | 58 (11.6%) | 2.45 |
| Single Female/Mother | 0 (0.0%) | - |
| Non-family | 164 (32.7%) | - |
| Total Households | 502 (100.0%) | 1.79 |
Household Size by Marriage Status in Bell Hill
Out of a total of 502 households in Bell Hill, 338 (67.3%) are family households, while 164 (32.7%) are nonfamily households. The most numerous type of family households are 2-person households, comprising 298, and the most common type of nonfamily households are 1-person households, comprising 164.
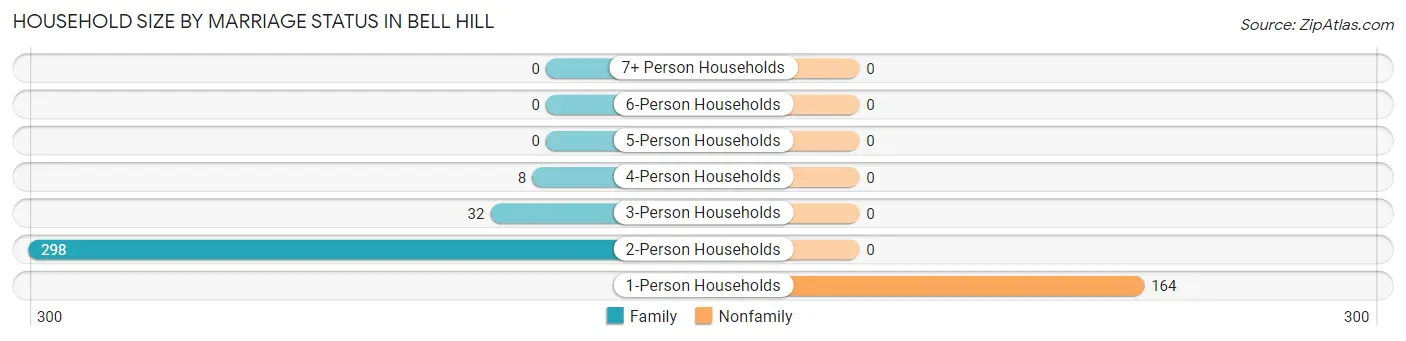
| Household Size | Family Households | Nonfamily Households |
| 1-Person Households | - | 164 (32.7%) |
| 2-Person Households | 298 (59.4%) | 0 (0.0%) |
| 3-Person Households | 32 (6.4%) | 0 (0.0%) |
| 4-Person Households | 8 (1.6%) | 0 (0.0%) |
| 5-Person Households | 0 (0.0%) | 0 (0.0%) |
| 6-Person Households | 0 (0.0%) | 0 (0.0%) |
| 7+ Person Households | 0 (0.0%) | 0 (0.0%) |
| Total | 338 (67.3%) | 164 (32.7%) |
Female Fertility in Bell Hill
Fertility by Age in Bell Hill
| Age Bracket | Women with Births | Births / 1,000 Women |
| 15 to 19 years | 0 (0.0%) | 0.0 |
| 20 to 34 years | 0 (0.0%) | 0.0 |
| 35 to 50 years | 0 (0.0%) | 0.0 |
| Total | 0 (0.0%) | 0.0 |
Fertility by Age by Marriage Status in Bell Hill
| Age Bracket | Married | Unmarried |
| 15 to 19 years | 0 (0.0%) | 0 (0.0%) |
| 20 to 34 years | 0 (0.0%) | 0 (0.0%) |
| 35 to 50 years | 0 (0.0%) | 0 (0.0%) |
| Total | 0 (0.0%) | 0 (0.0%) |
Fertility by Education in Bell Hill
| Educational Attainment | Women with Births | Births / 1,000 Women |
| Less than High School | 0 (0.0%) | 0.0 |
| High School Diploma | 0 (0.0%) | 0.0 |
| College or Associate's Degree | 0 (0.0%) | 0.0 |
| Bachelor's Degree | 0 (0.0%) | 0.0 |
| Graduate Degree | 0 (0.0%) | 0.0 |
| Total | 0 (0.0%) | 0.0 |
Fertility by Education by Marriage Status in Bell Hill
| Educational Attainment | Married | Unmarried |
| Less than High School | 0 (0.0%) | 0 (0.0%) |
| High School Diploma | 0 (0.0%) | 0 (0.0%) |
| College or Associate's Degree | 0 (0.0%) | 0 (0.0%) |
| Bachelor's Degree | 0 (0.0%) | 0 (0.0%) |
| Graduate Degree | 0 (0.0%) | 0 (0.0%) |
| Total | 0 (0.0%) | 0 (0.0%) |
Employment Characteristics in Bell Hill
Employment by Class of Employer in Bell Hill
Among the 100 employed individuals in Bell Hill, local government employees (76 | 76.0%), private company employees (17 | 17.0%), and self-employed (incorporated) (7 | 7.0%) make up the most common classes of employment.
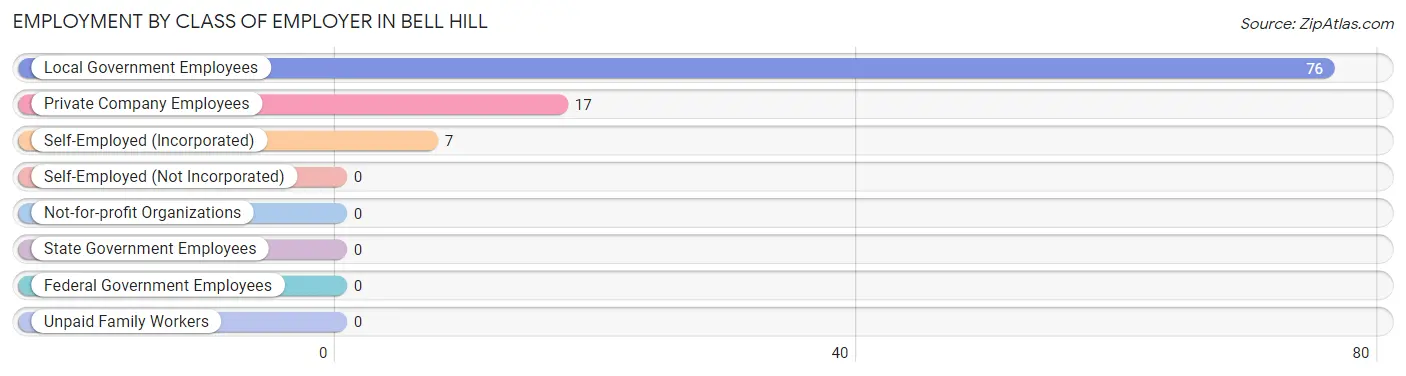
| Employer Class | # Employees | % Employees |
| Private Company Employees | 17 | 17.0% |
| Self-Employed (Incorporated) | 7 | 7.0% |
| Self-Employed (Not Incorporated) | 0 | 0.0% |
| Not-for-profit Organizations | 0 | 0.0% |
| Local Government Employees | 76 | 76.0% |
| State Government Employees | 0 | 0.0% |
| Federal Government Employees | 0 | 0.0% |
| Unpaid Family Workers | 0 | 0.0% |
| Total | 100 | 100.0% |
Employment Status by Age in Bell Hill
According to the labor force statistics for Bell Hill, out of the total population over 16 years of age (900), 14.4% or 130 individuals are in the labor force, with 23.1% or 30 of them unemployed. The age group with the highest labor force participation rate is 16 to 19 years, with 100.0% or 30 individuals in the labor force. Within the labor force, the 16 to 19 years age range has the highest percentage of unemployed individuals, with 100.0% or 30 of them being unemployed.
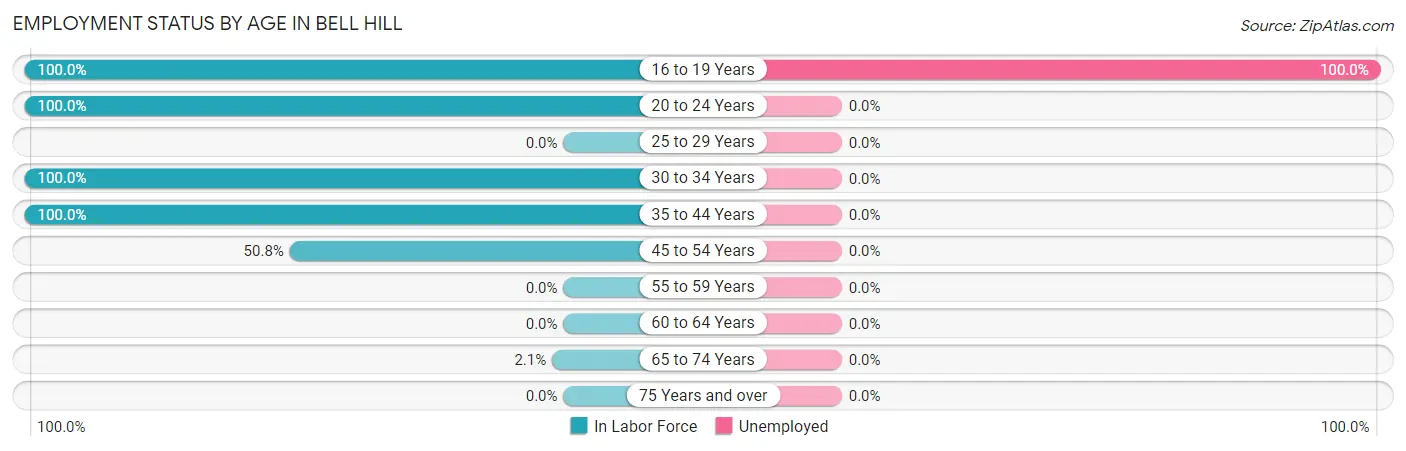
| Age Bracket | In Labor Force | Unemployed |
| 16 to 19 Years | 30 (100.0%) | 30 (100.0%) |
| 20 to 24 Years | 37 (100.0%) | 0 (0.0%) |
| 25 to 29 Years | 0 (0.0%) | 0 (0.0%) |
| 30 to 34 Years | 7 (100.0%) | 0 (0.0%) |
| 35 to 44 Years | 17 (100.0%) | 0 (0.0%) |
| 45 to 54 Years | 32 (50.8%) | 0 (0.0%) |
| 55 to 59 Years | 0 (0.0%) | 0 (0.0%) |
| 60 to 64 Years | 0 (0.0%) | 0 (0.0%) |
| 65 to 74 Years | 7 (2.1%) | 0 (0.0%) |
| 75 Years and over | 0 (0.0%) | 0 (0.0%) |
| Total | 130 (14.4%) | 30 (23.1%) |
Employment Status by Educational Attainment in Bell Hill
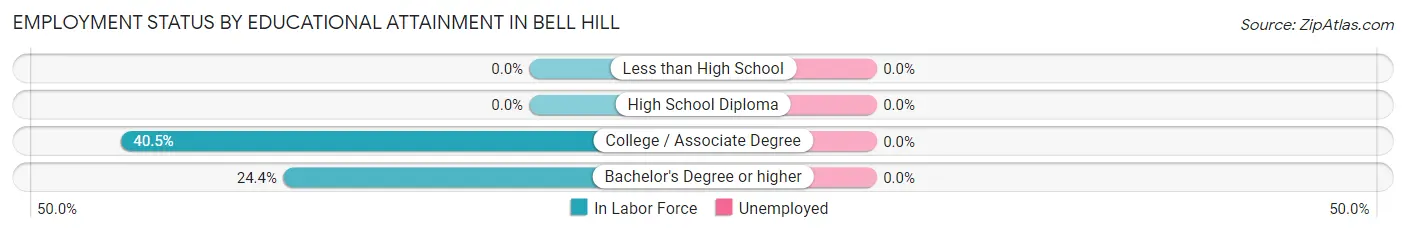
| Educational Attainment | In Labor Force | Unemployed |
| Less than High School | 0 (0.0%) | 0 (0.0%) |
| High School Diploma | 0 (0.0%) | 0 (0.0%) |
| College / Associate Degree | 17 (40.5%) | 0 (0.0%) |
| Bachelor's Degree or higher | 39 (24.4%) | 0 (0.0%) |
| Total | 56 (27.1%) | 0 (0.0%) |
Employment Occupations by Sex in Bell Hill
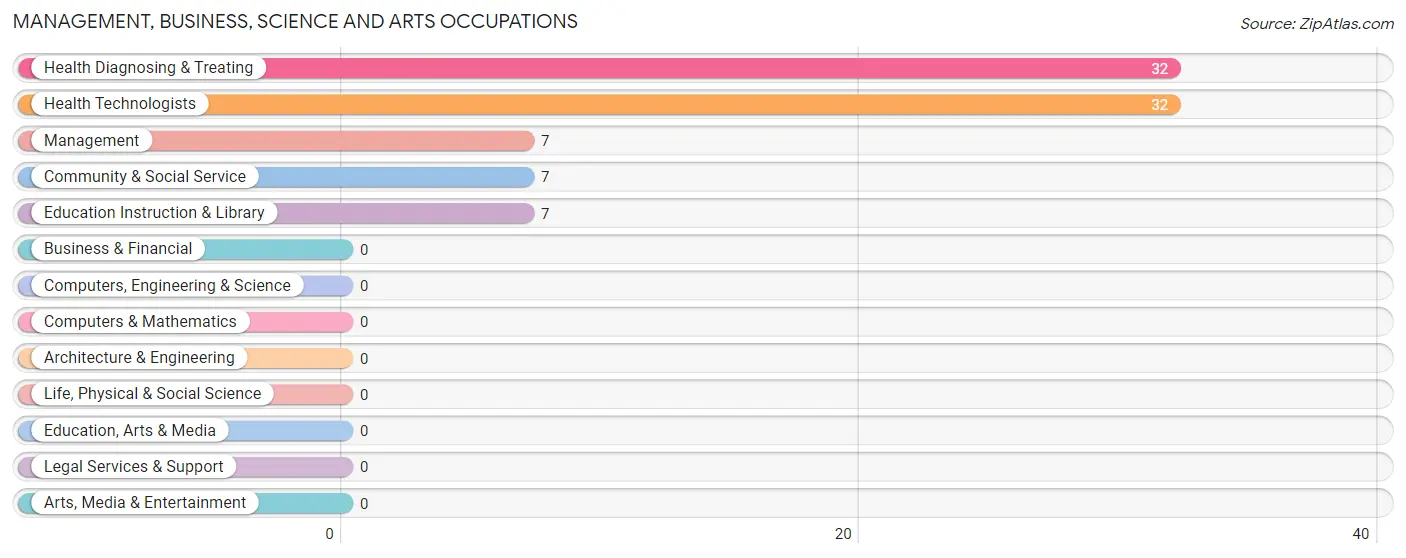
Management, Business, Science and Arts Occupations
The most common Management, Business, Science and Arts occupations in Bell Hill are Health Diagnosing & Treating (32 | 32.0%), Health Technologists (32 | 32.0%), Management (7 | 7.0%), Community & Social Service (7 | 7.0%), and Education Instruction & Library (7 | 7.0%).
Management, Business, Science and Arts Occupations by Sex
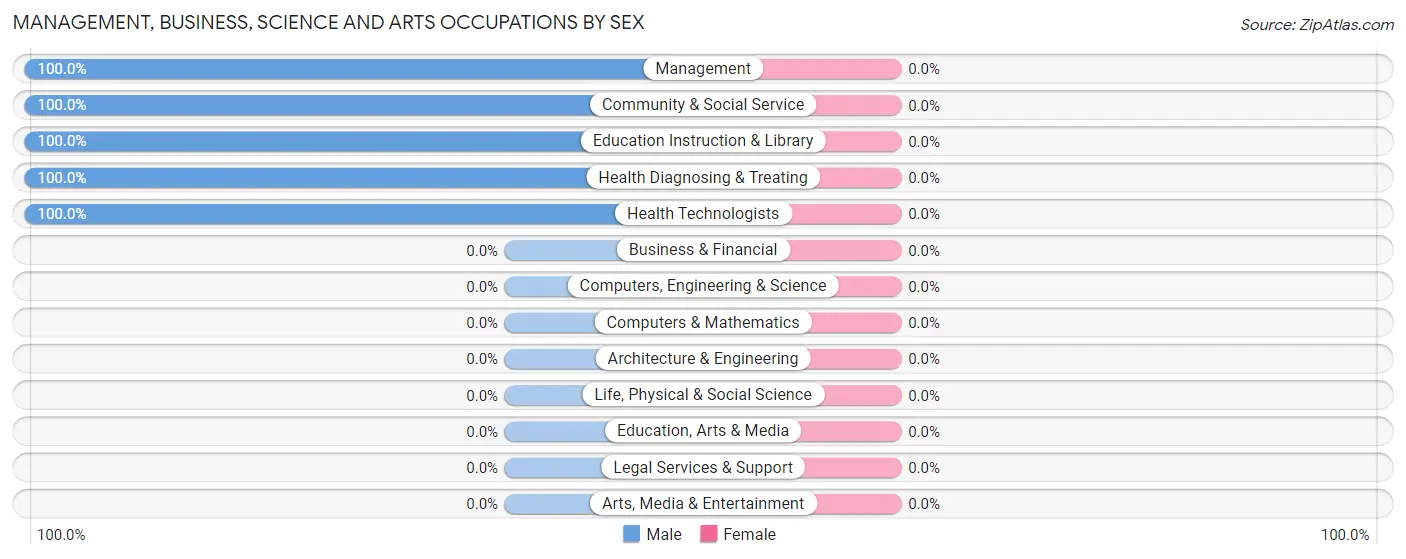
| Occupation | Male | Female |
| Management | 7 (100.0%) | 0 (0.0%) |
| Business & Financial | 0 (0.0%) | 0 (0.0%) |
| Computers, Engineering & Science | 0 (0.0%) | 0 (0.0%) |
| Computers & Mathematics | 0 (0.0%) | 0 (0.0%) |
| Architecture & Engineering | 0 (0.0%) | 0 (0.0%) |
| Life, Physical & Social Science | 0 (0.0%) | 0 (0.0%) |
| Community & Social Service | 7 (100.0%) | 0 (0.0%) |
| Education, Arts & Media | 0 (0.0%) | 0 (0.0%) |
| Legal Services & Support | 0 (0.0%) | 0 (0.0%) |
| Education Instruction & Library | 7 (100.0%) | 0 (0.0%) |
| Arts, Media & Entertainment | 0 (0.0%) | 0 (0.0%) |
| Health Diagnosing & Treating | 32 (100.0%) | 0 (0.0%) |
| Health Technologists | 32 (100.0%) | 0 (0.0%) |
| Total (Category) | 46 (100.0%) | 0 (0.0%) |
| Total (Overall) | 55 (55.0%) | 45 (45.0%) |
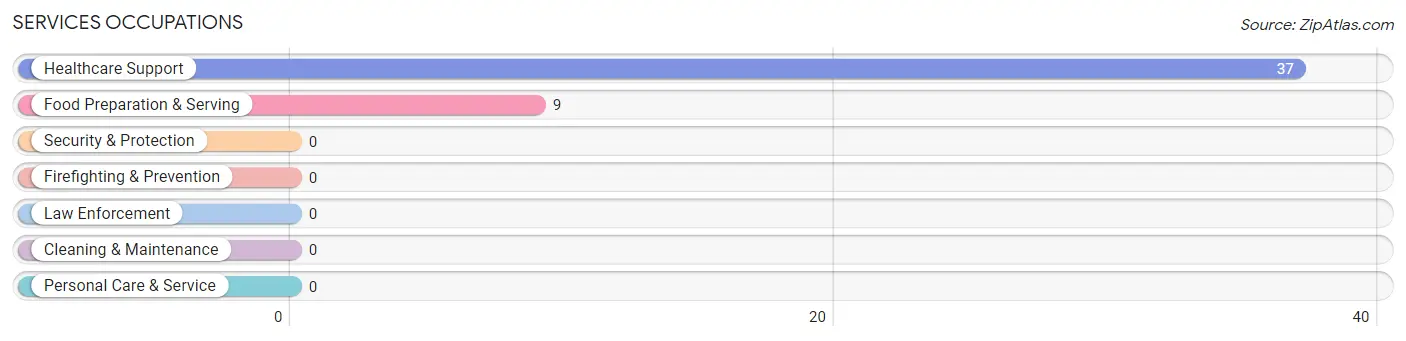
Services Occupations
The most common Services occupations in Bell Hill are Healthcare Support (37 | 37.0%), and Food Preparation & Serving (9 | 9.0%).
Services Occupations by Sex
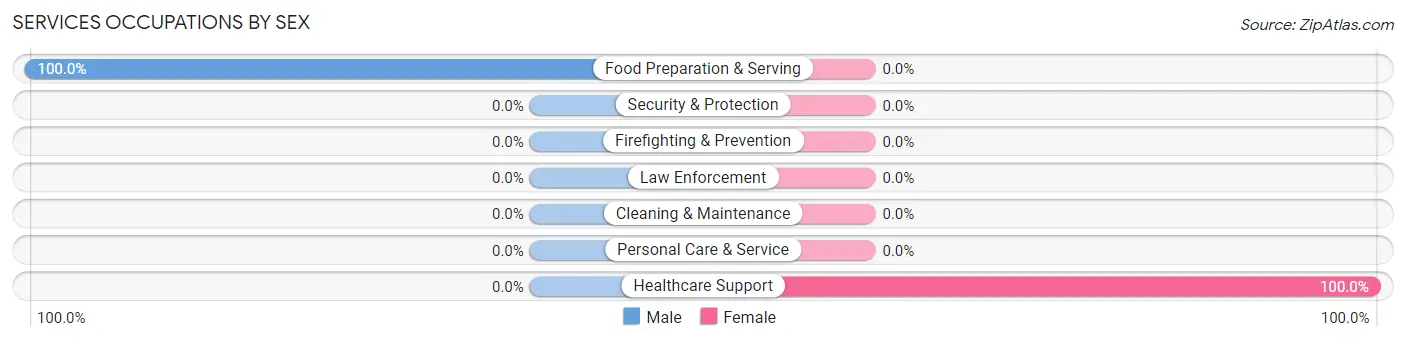
| Occupation | Male | Female |
| Healthcare Support | 0 (0.0%) | 37 (100.0%) |
| Security & Protection | 0 (0.0%) | 0 (0.0%) |
| Firefighting & Prevention | 0 (0.0%) | 0 (0.0%) |
| Law Enforcement | 0 (0.0%) | 0 (0.0%) |
| Food Preparation & Serving | 9 (100.0%) | 0 (0.0%) |
| Cleaning & Maintenance | 0 (0.0%) | 0 (0.0%) |
| Personal Care & Service | 0 (0.0%) | 0 (0.0%) |
| Total (Category) | 9 (19.6%) | 37 (80.4%) |
| Total (Overall) | 55 (55.0%) | 45 (45.0%) |
Sales and Office Occupations

Sales and Office Occupations by Sex

| Occupation | Male | Female |
| Sales & Related | 0 (0.0%) | 0 (0.0%) |
| Office & Administration | 0 (0.0%) | 0 (0.0%) |
| Total (Category) | 0 (0.0%) | 0 (0.0%) |
| Total (Overall) | 55 (55.0%) | 45 (45.0%) |
Natural Resources, Construction and Maintenance Occupations
The most common Natural Resources, Construction and Maintenance occupations in Bell Hill are , and Construction & Extraction (8 | 8.0%).
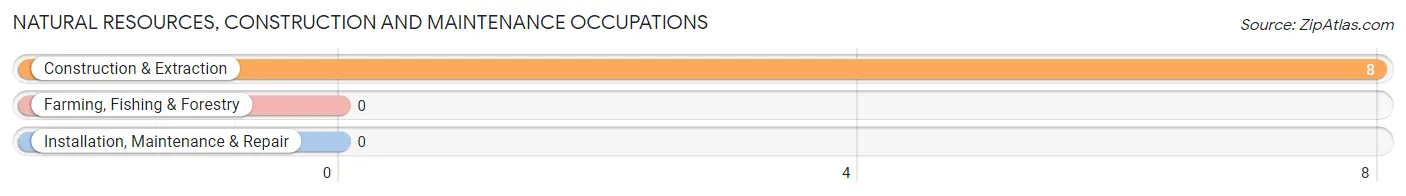
Natural Resources, Construction and Maintenance Occupations by Sex

| Occupation | Male | Female |
| Farming, Fishing & Forestry | 0 (0.0%) | 0 (0.0%) |
| Construction & Extraction | 0 (0.0%) | 8 (100.0%) |
| Installation, Maintenance & Repair | 0 (0.0%) | 0 (0.0%) |
| Total (Category) | 0 (0.0%) | 8 (100.0%) |
| Total (Overall) | 55 (55.0%) | 45 (45.0%) |
Production, Transportation and Moving Occupations
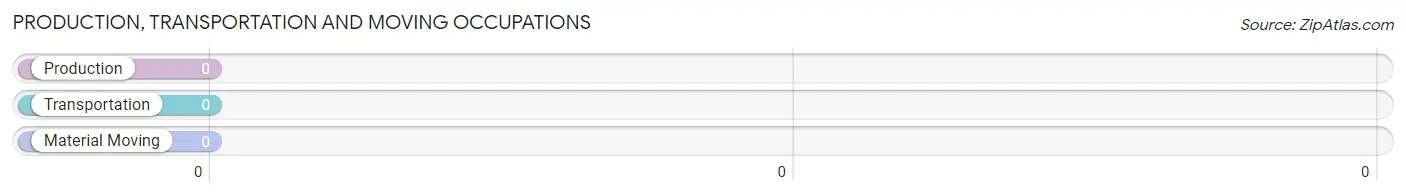
Production, Transportation and Moving Occupations by Sex
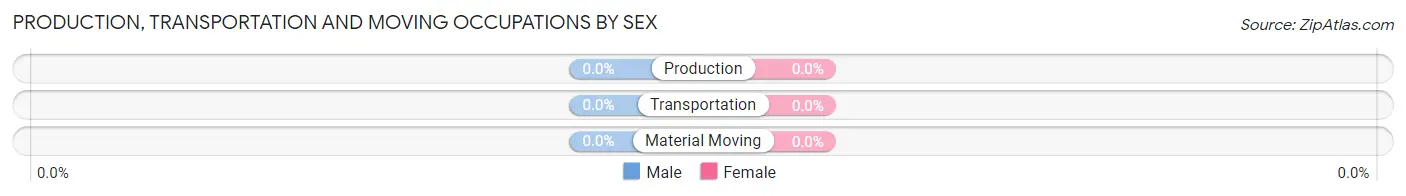
| Occupation | Male | Female |
| Production | 0 (0.0%) | 0 (0.0%) |
| Transportation | 0 (0.0%) | 0 (0.0%) |
| Material Moving | 0 (0.0%) | 0 (0.0%) |
| Total (Category) | 0 (0.0%) | 0 (0.0%) |
| Total (Overall) | 55 (55.0%) | 45 (45.0%) |
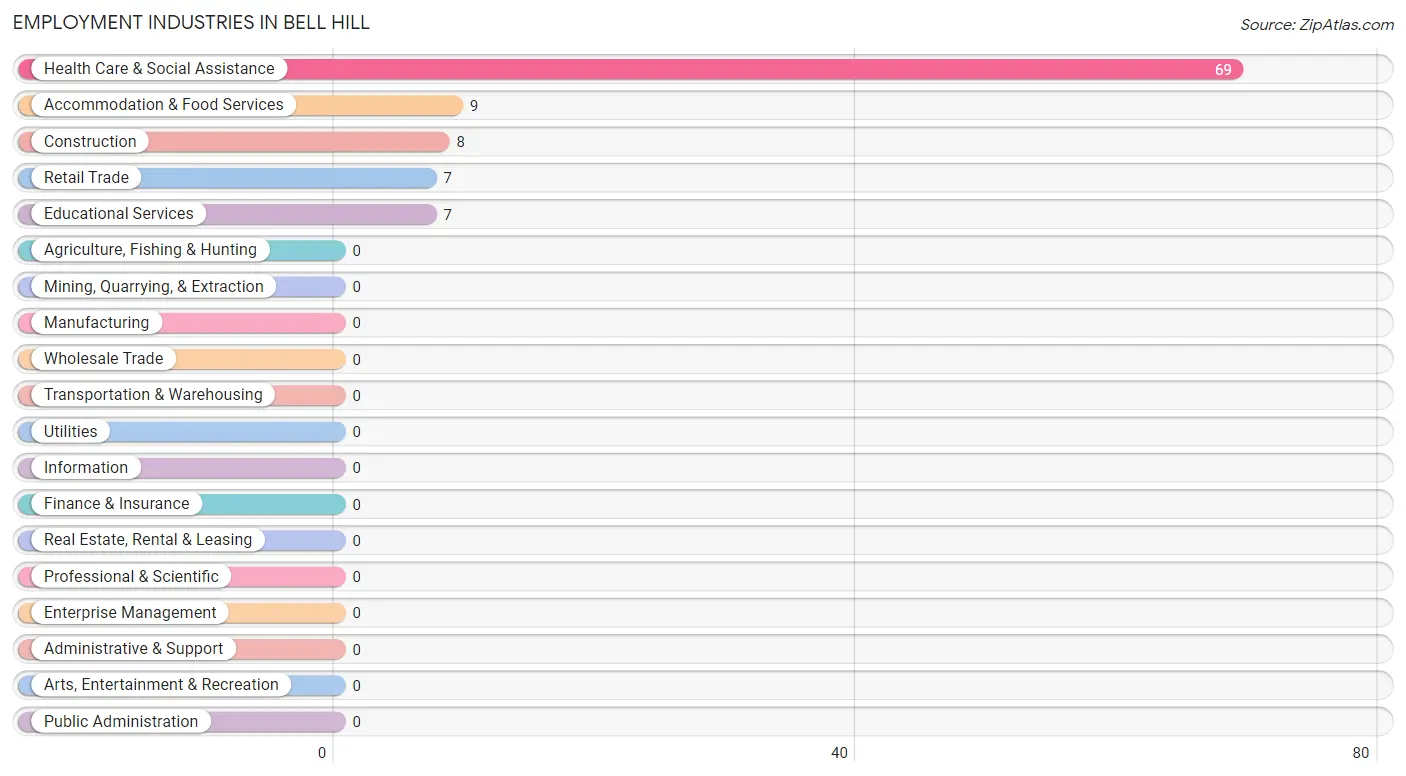
Employment Industries by Sex in Bell Hill
Employment Industries in Bell Hill
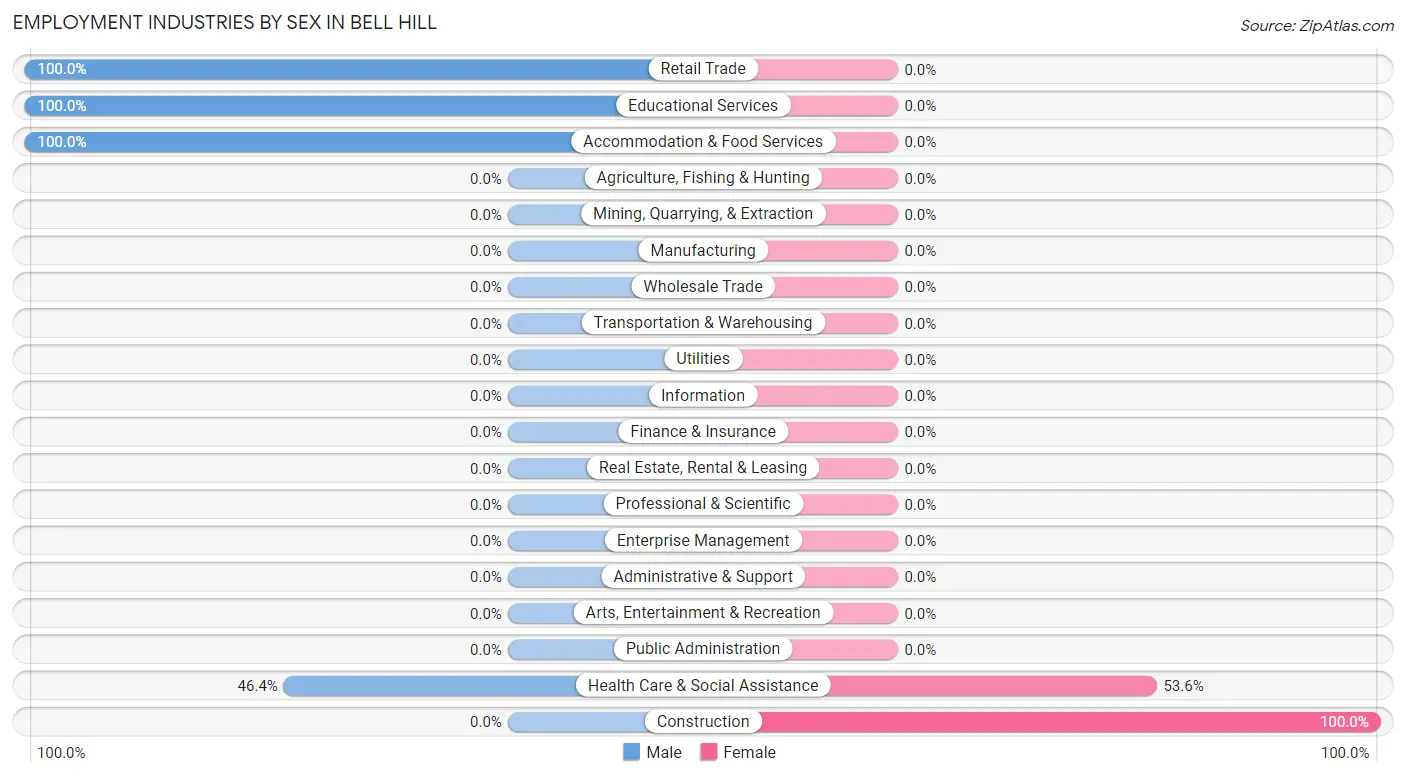
The major employment industries in Bell Hill include Health Care & Social Assistance (69 | 69.0%), Accommodation & Food Services (9 | 9.0%), Construction (8 | 8.0%), Retail Trade (7 | 7.0%), and Educational Services (7 | 7.0%).
Employment Industries by Sex in Bell Hill
The Bell Hill industries that see more men than women are Retail Trade (100.0%), Educational Services (100.0%), and Accommodation & Food Services (100.0%), whereas the industries that tend to have a higher number of women are Construction (100.0%), and Health Care & Social Assistance (53.6%).
| Industry | Male | Female |
| Agriculture, Fishing & Hunting | 0 (0.0%) | 0 (0.0%) |
| Mining, Quarrying, & Extraction | 0 (0.0%) | 0 (0.0%) |
| Construction | 0 (0.0%) | 8 (100.0%) |
| Manufacturing | 0 (0.0%) | 0 (0.0%) |
| Wholesale Trade | 0 (0.0%) | 0 (0.0%) |
| Retail Trade | 7 (100.0%) | 0 (0.0%) |
| Transportation & Warehousing | 0 (0.0%) | 0 (0.0%) |
| Utilities | 0 (0.0%) | 0 (0.0%) |
| Information | 0 (0.0%) | 0 (0.0%) |
| Finance & Insurance | 0 (0.0%) | 0 (0.0%) |
| Real Estate, Rental & Leasing | 0 (0.0%) | 0 (0.0%) |
| Professional & Scientific | 0 (0.0%) | 0 (0.0%) |
| Enterprise Management | 0 (0.0%) | 0 (0.0%) |
| Administrative & Support | 0 (0.0%) | 0 (0.0%) |
| Educational Services | 7 (100.0%) | 0 (0.0%) |
| Health Care & Social Assistance | 32 (46.4%) | 37 (53.6%) |
| Arts, Entertainment & Recreation | 0 (0.0%) | 0 (0.0%) |
| Accommodation & Food Services | 9 (100.0%) | 0 (0.0%) |
| Public Administration | 0 (0.0%) | 0 (0.0%) |
| Total | 55 (55.0%) | 45 (45.0%) |
Education in Bell Hill
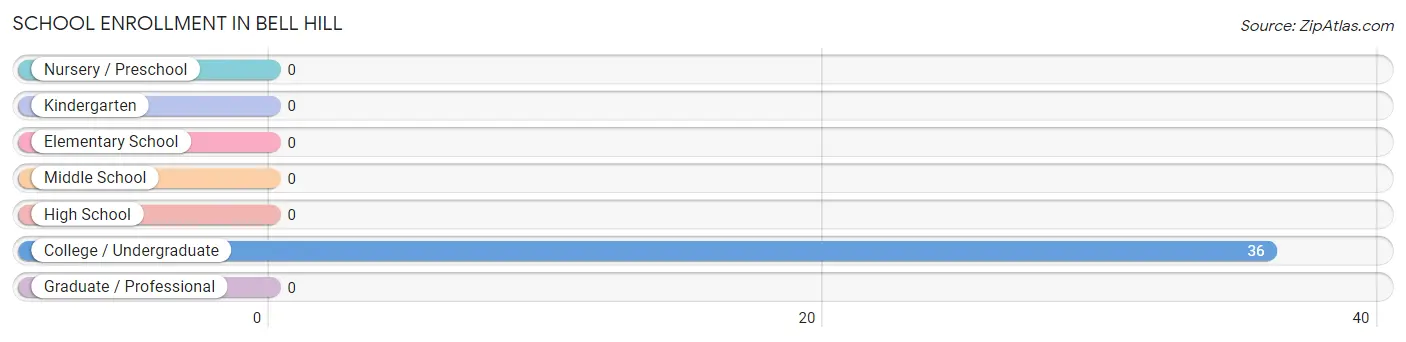
School Enrollment in Bell Hill
| School Level | # Students | % Students |
| Nursery / Preschool | 0 | 0.0% |
| Kindergarten | 0 | 0.0% |
| Elementary School | 0 | 0.0% |
| Middle School | 0 | 0.0% |
| High School | 0 | 0.0% |
| College / Undergraduate | 36 | 100.0% |
| Graduate / Professional | 0 | 0.0% |
| Total | 36 | 100.0% |
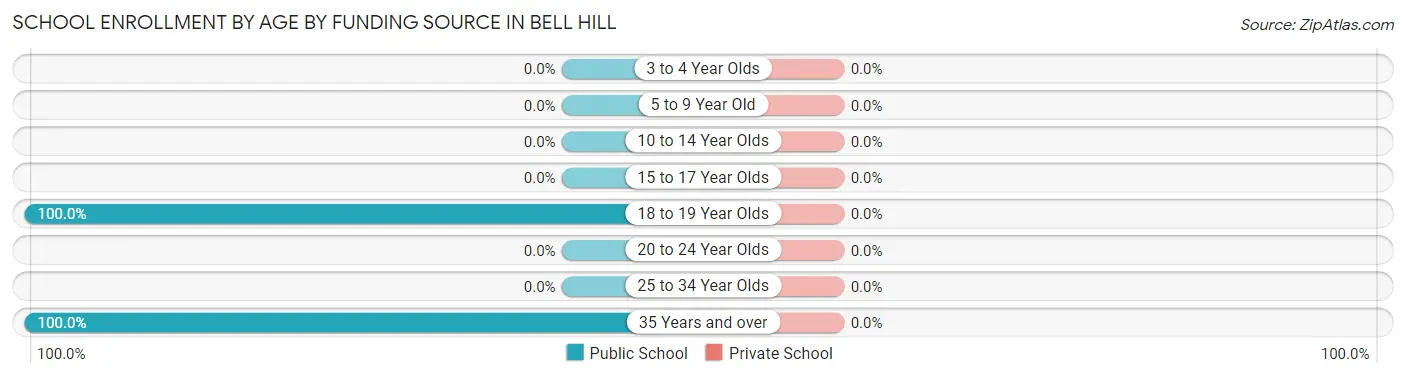
School Enrollment by Age by Funding Source in Bell Hill
| Age Bracket | Public School | Private School |
| 3 to 4 Year Olds | 0 (0.0%) | 0 (0.0%) |
| 5 to 9 Year Old | 0 (0.0%) | 0 (0.0%) |
| 10 to 14 Year Olds | 0 (0.0%) | 0 (0.0%) |
| 15 to 17 Year Olds | 0 (0.0%) | 0 (0.0%) |
| 18 to 19 Year Olds | 30 (100.0%) | 0 (0.0%) |
| 20 to 24 Year Olds | 0 (0.0%) | 0 (0.0%) |
| 25 to 34 Year Olds | 0 (0.0%) | 0 (0.0%) |
| 35 Years and over | 6 (100.0%) | 0 (0.0%) |
| Total | 36 (100.0%) | 0 (0.0%) |
Educational Attainment by Field of Study in Bell Hill
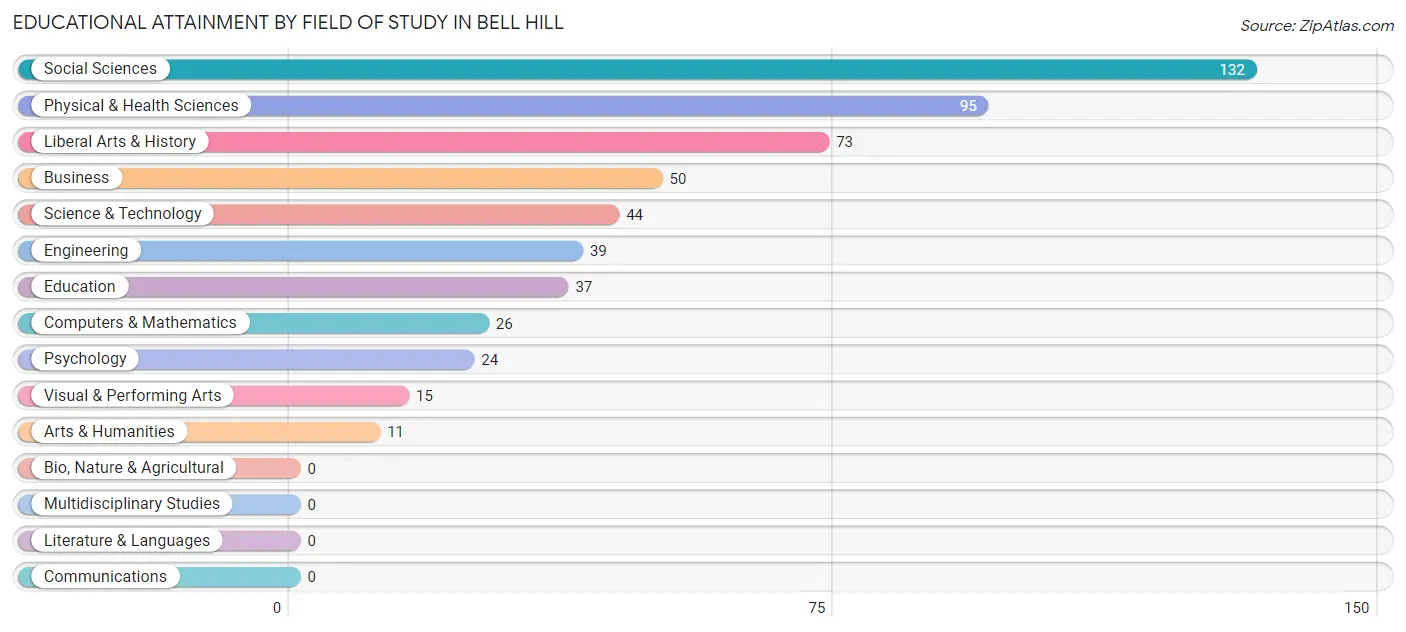
Social sciences (132 | 24.2%), physical & health sciences (95 | 17.4%), liberal arts & history (73 | 13.4%), business (50 | 9.2%), and science & technology (44 | 8.1%) are the most common fields of study among 546 individuals in Bell Hill who have obtained a bachelor's degree or higher.
| Field of Study | # Graduates | % Graduates |
| Computers & Mathematics | 26 | 4.8% |
| Bio, Nature & Agricultural | 0 | 0.0% |
| Physical & Health Sciences | 95 | 17.4% |
| Psychology | 24 | 4.4% |
| Social Sciences | 132 | 24.2% |
| Engineering | 39 | 7.1% |
| Multidisciplinary Studies | 0 | 0.0% |
| Science & Technology | 44 | 8.1% |
| Business | 50 | 9.2% |
| Education | 37 | 6.8% |
| Literature & Languages | 0 | 0.0% |
| Liberal Arts & History | 73 | 13.4% |
| Visual & Performing Arts | 15 | 2.8% |
| Communications | 0 | 0.0% |
| Arts & Humanities | 11 | 2.0% |
| Total | 546 | 100.0% |
Transportation & Commute in Bell Hill
Vehicle Availability by Sex in Bell Hill
The most prevalent vehicle ownership categories in Bell Hill are males with 3 vehicles (41, accounting for 74.6%) and females with 3 vehicles (45, making up 91.1%).
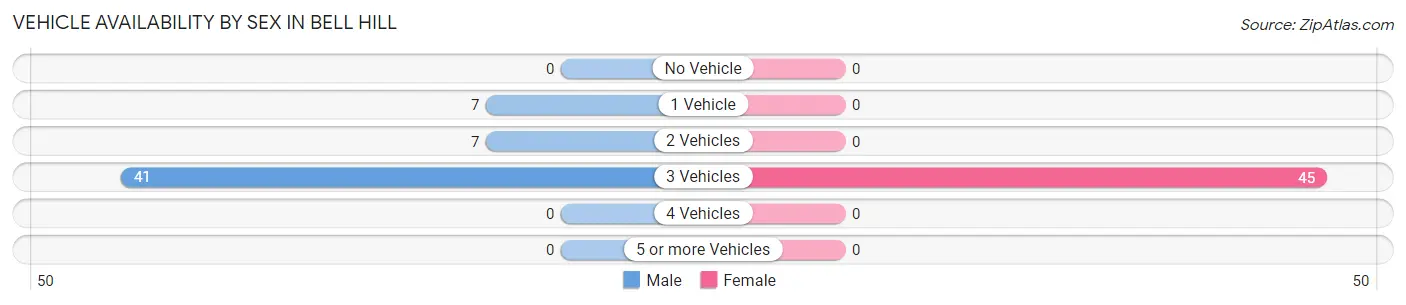
| Vehicles Available | Male | Female |
| No Vehicle | 0 (0.0%) | 0 (0.0%) |
| 1 Vehicle | 7 (12.7%) | 0 (0.0%) |
| 2 Vehicles | 7 (12.7%) | 0 (0.0%) |
| 3 Vehicles | 41 (74.6%) | 45 (100.0%) |
| 4 Vehicles | 0 (0.0%) | 0 (0.0%) |
| 5 or more Vehicles | 0 (0.0%) | 0 (0.0%) |
| Total | 55 (100.0%) | 45 (100.0%) |
Commute Time in Bell Hill
The most frequently occuring commute durations in Bell Hill are 10 to 14 minutes (46 commuters, 46.0%), 30 to 34 minutes (37 commuters, 37.0%), and 5 to 9 minutes (17 commuters, 17.0%).
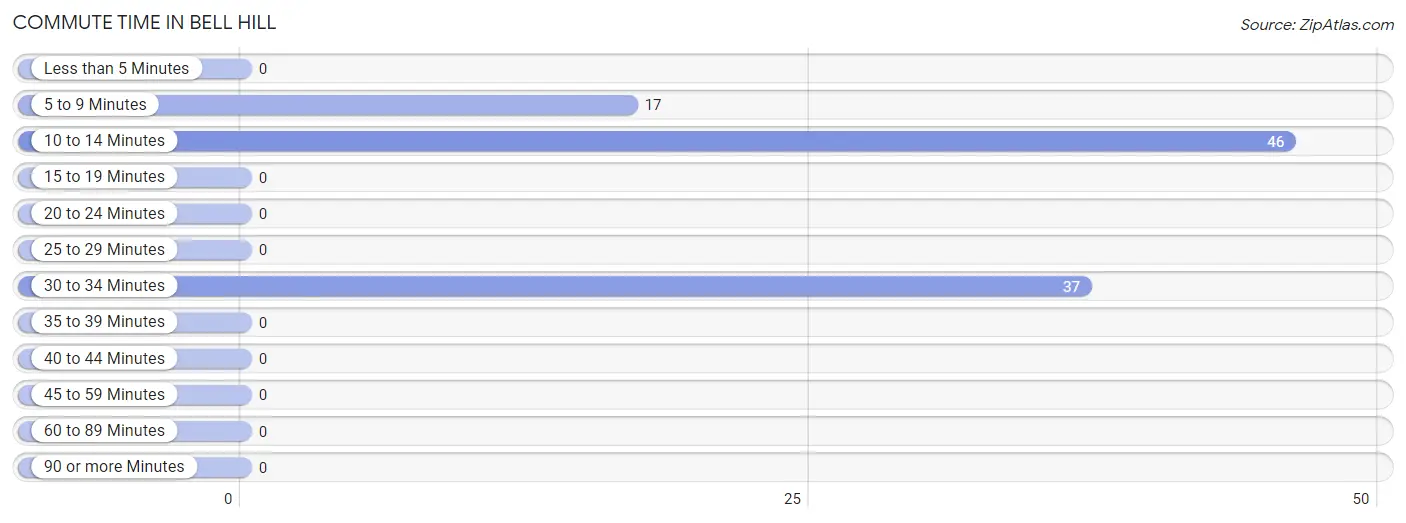
| Commute Time | # Commuters | % Commuters |
| Less than 5 Minutes | 0 | 0.0% |
| 5 to 9 Minutes | 17 | 17.0% |
| 10 to 14 Minutes | 46 | 46.0% |
| 15 to 19 Minutes | 0 | 0.0% |
| 20 to 24 Minutes | 0 | 0.0% |
| 25 to 29 Minutes | 0 | 0.0% |
| 30 to 34 Minutes | 37 | 37.0% |
| 35 to 39 Minutes | 0 | 0.0% |
| 40 to 44 Minutes | 0 | 0.0% |
| 45 to 59 Minutes | 0 | 0.0% |
| 60 to 89 Minutes | 0 | 0.0% |
| 90 or more Minutes | 0 | 0.0% |
Commute Time by Sex in Bell Hill
The most common commute times in Bell Hill are 10 to 14 minutes (46 commuters, 83.6%) for males and 30 to 34 minutes (37 commuters, 82.2%) for females.
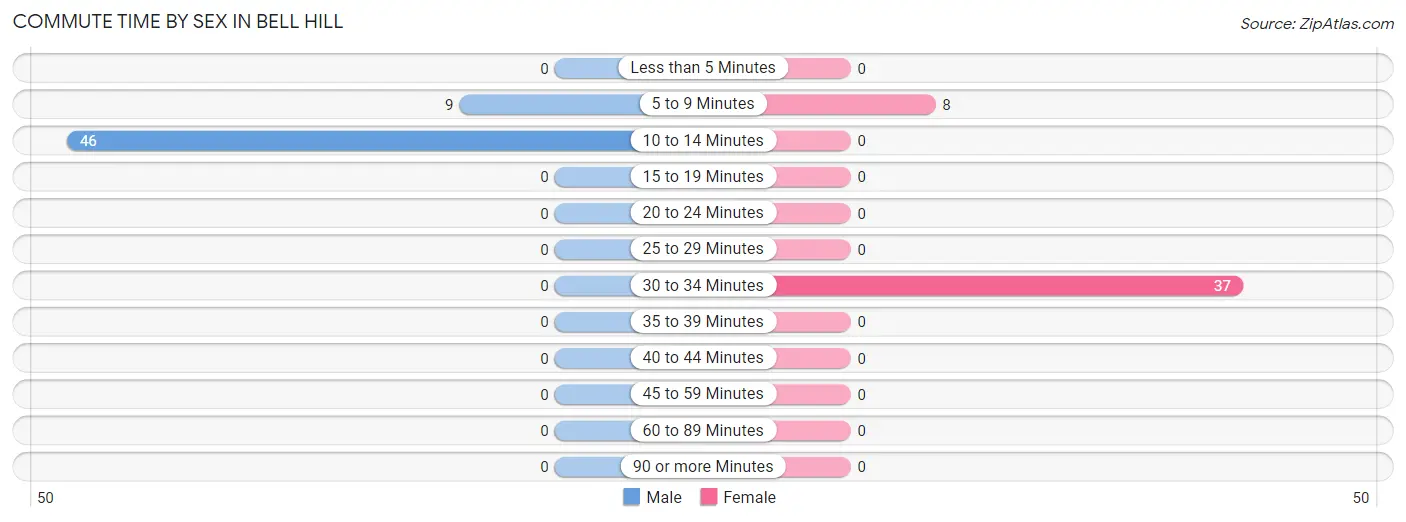
| Commute Time | Male | Female |
| Less than 5 Minutes | 0 (0.0%) | 0 (0.0%) |
| 5 to 9 Minutes | 9 (16.4%) | 8 (17.8%) |
| 10 to 14 Minutes | 46 (83.6%) | 0 (0.0%) |
| 15 to 19 Minutes | 0 (0.0%) | 0 (0.0%) |
| 20 to 24 Minutes | 0 (0.0%) | 0 (0.0%) |
| 25 to 29 Minutes | 0 (0.0%) | 0 (0.0%) |
| 30 to 34 Minutes | 0 (0.0%) | 37 (82.2%) |
| 35 to 39 Minutes | 0 (0.0%) | 0 (0.0%) |
| 40 to 44 Minutes | 0 (0.0%) | 0 (0.0%) |
| 45 to 59 Minutes | 0 (0.0%) | 0 (0.0%) |
| 60 to 89 Minutes | 0 (0.0%) | 0 (0.0%) |
| 90 or more Minutes | 0 (0.0%) | 0 (0.0%) |
Time of Departure to Work by Sex in Bell Hill
The most frequent times of departure to work in Bell Hill are 6:00 AM to 6:29 AM (32, 58.2%) for males and 7:30 AM to 7:59 AM (37, 82.2%) for females.
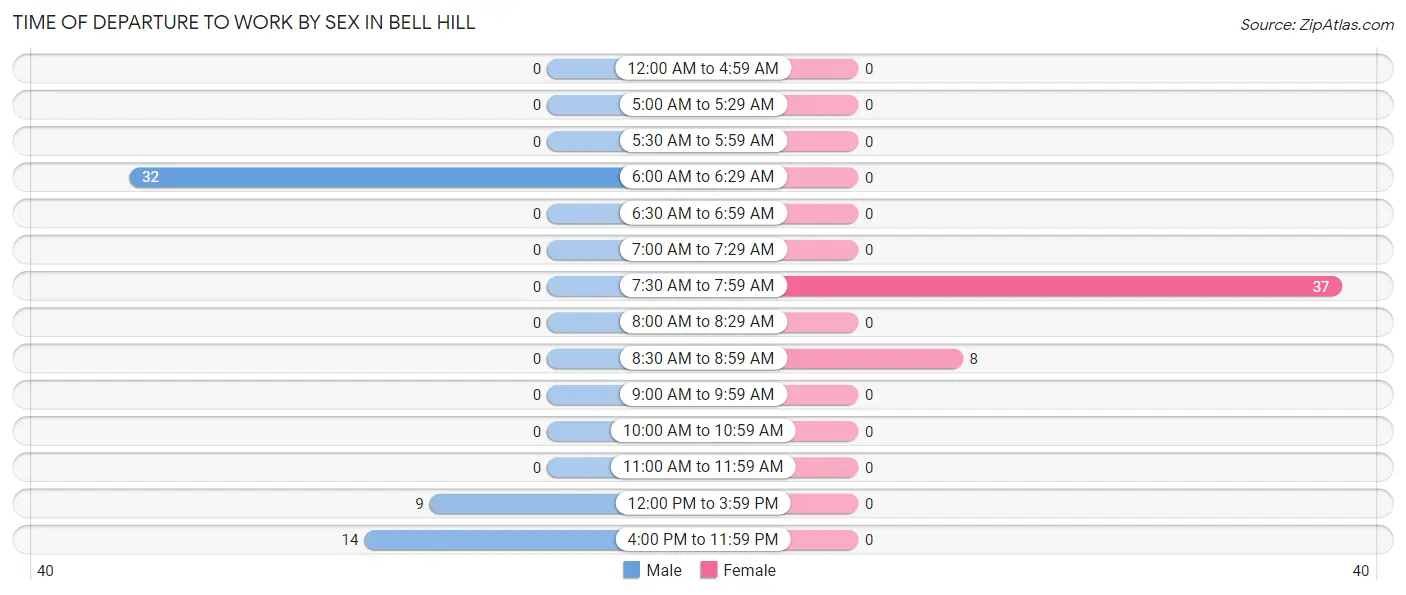
| Time of Departure | Male | Female |
| 12:00 AM to 4:59 AM | 0 (0.0%) | 0 (0.0%) |
| 5:00 AM to 5:29 AM | 0 (0.0%) | 0 (0.0%) |
| 5:30 AM to 5:59 AM | 0 (0.0%) | 0 (0.0%) |
| 6:00 AM to 6:29 AM | 32 (58.2%) | 0 (0.0%) |
| 6:30 AM to 6:59 AM | 0 (0.0%) | 0 (0.0%) |
| 7:00 AM to 7:29 AM | 0 (0.0%) | 0 (0.0%) |
| 7:30 AM to 7:59 AM | 0 (0.0%) | 37 (82.2%) |
| 8:00 AM to 8:29 AM | 0 (0.0%) | 0 (0.0%) |
| 8:30 AM to 8:59 AM | 0 (0.0%) | 8 (17.8%) |
| 9:00 AM to 9:59 AM | 0 (0.0%) | 0 (0.0%) |
| 10:00 AM to 10:59 AM | 0 (0.0%) | 0 (0.0%) |
| 11:00 AM to 11:59 AM | 0 (0.0%) | 0 (0.0%) |
| 12:00 PM to 3:59 PM | 9 (16.4%) | 0 (0.0%) |
| 4:00 PM to 11:59 PM | 14 (25.5%) | 0 (0.0%) |
| Total | 55 (100.0%) | 45 (100.0%) |
Housing Occupancy in Bell Hill
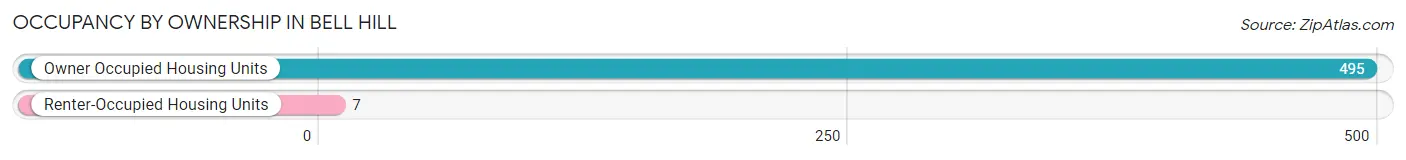
Occupancy by Ownership in Bell Hill
Of the total 502 dwellings in Bell Hill, owner-occupied units account for 495 (98.6%), while renter-occupied units make up 7 (1.4%).
| Occupancy | # Housing Units | % Housing Units |
| Owner Occupied Housing Units | 495 | 98.6% |
| Renter-Occupied Housing Units | 7 | 1.4% |
| Total Occupied Housing Units | 502 | 100.0% |
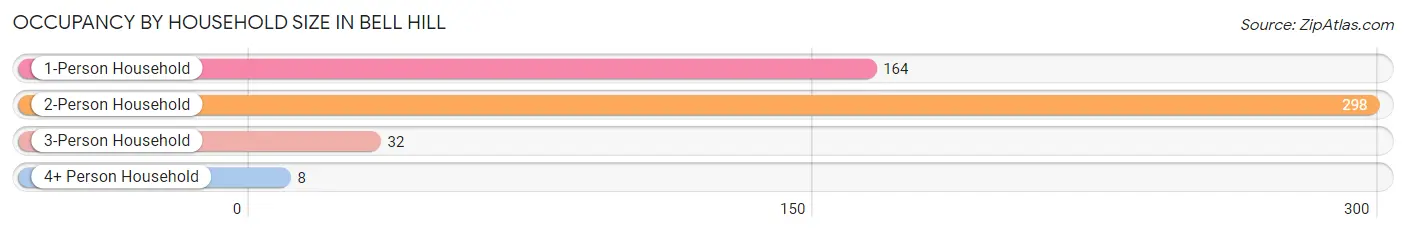
Occupancy by Household Size in Bell Hill
| Household Size | # Housing Units | % Housing Units |
| 1-Person Household | 164 | 32.7% |
| 2-Person Household | 298 | 59.4% |
| 3-Person Household | 32 | 6.4% |
| 4+ Person Household | 8 | 1.6% |
| Total Housing Units | 502 | 100.0% |
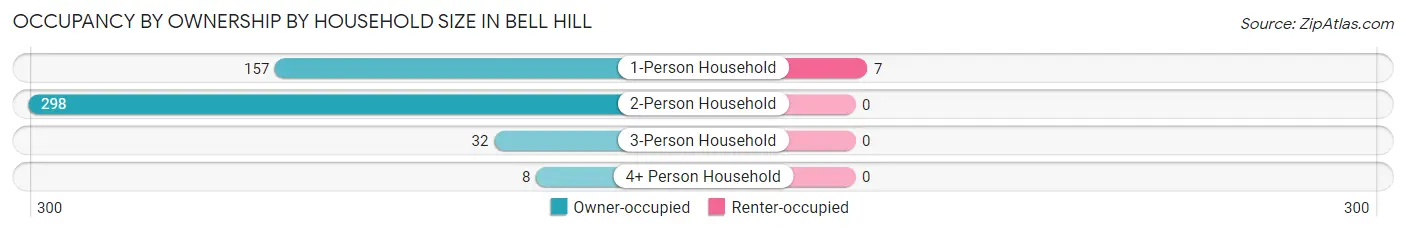
Occupancy by Ownership by Household Size in Bell Hill
| Household Size | Owner-occupied | Renter-occupied |
| 1-Person Household | 157 (95.7%) | 7 (4.3%) |
| 2-Person Household | 298 (100.0%) | 0 (0.0%) |
| 3-Person Household | 32 (100.0%) | 0 (0.0%) |
| 4+ Person Household | 8 (100.0%) | 0 (0.0%) |
| Total Housing Units | 495 (98.6%) | 7 (1.4%) |
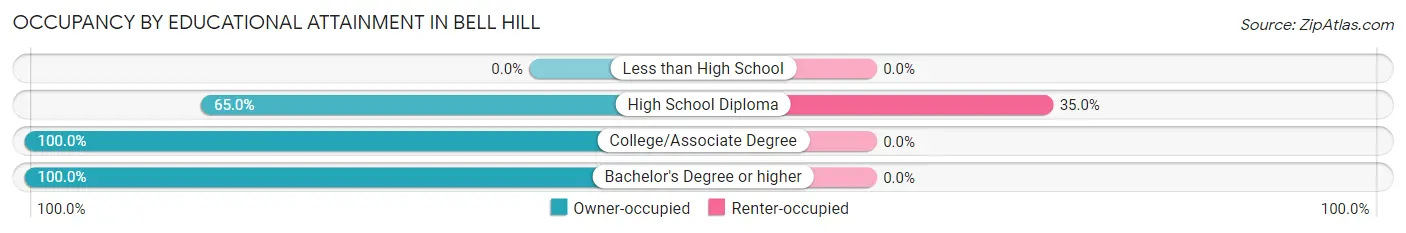
Occupancy by Educational Attainment in Bell Hill
| Household Size | Owner-occupied | Renter-occupied |
| Less than High School | 0 (0.0%) | 0 (0.0%) |
| High School Diploma | 13 (65.0%) | 7 (35.0%) |
| College/Associate Degree | 130 (100.0%) | 0 (0.0%) |
| Bachelor's Degree or higher | 352 (100.0%) | 0 (0.0%) |
Occupancy by Age of Householder in Bell Hill
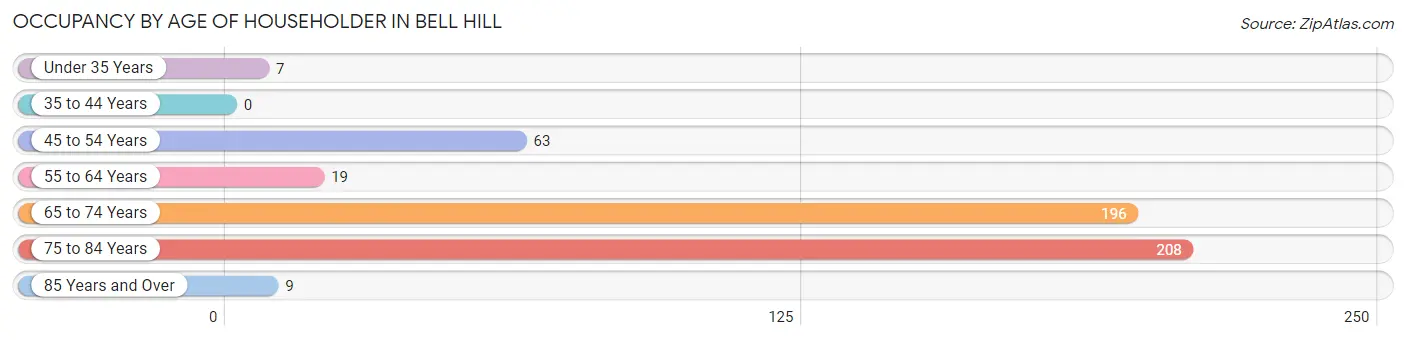
| Age Bracket | # Households | % Households |
| Under 35 Years | 7 | 1.4% |
| 35 to 44 Years | 0 | 0.0% |
| 45 to 54 Years | 63 | 12.6% |
| 55 to 64 Years | 19 | 3.8% |
| 65 to 74 Years | 196 | 39.0% |
| 75 to 84 Years | 208 | 41.4% |
| 85 Years and Over | 9 | 1.8% |
| Total | 502 | 100.0% |
Housing Finances in Bell Hill
Median Income by Occupancy in Bell Hill
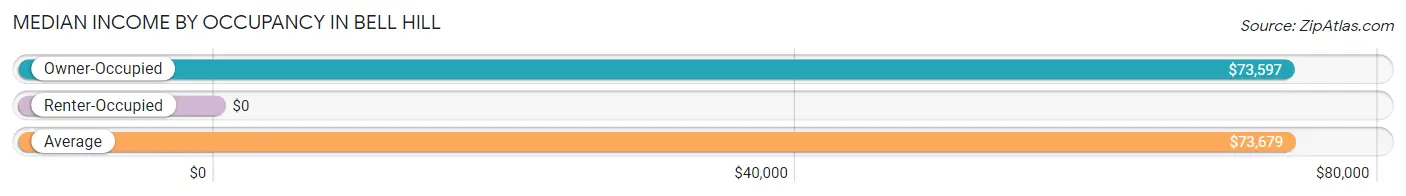
| Occupancy Type | # Households | Median Income |
| Owner-Occupied | 495 (98.6%) | $73,597 |
| Renter-Occupied | 7 (1.4%) | $0 |
| Average | 502 (100.0%) | $73,679 |
Occupancy by Householder Income Bracket in Bell Hill
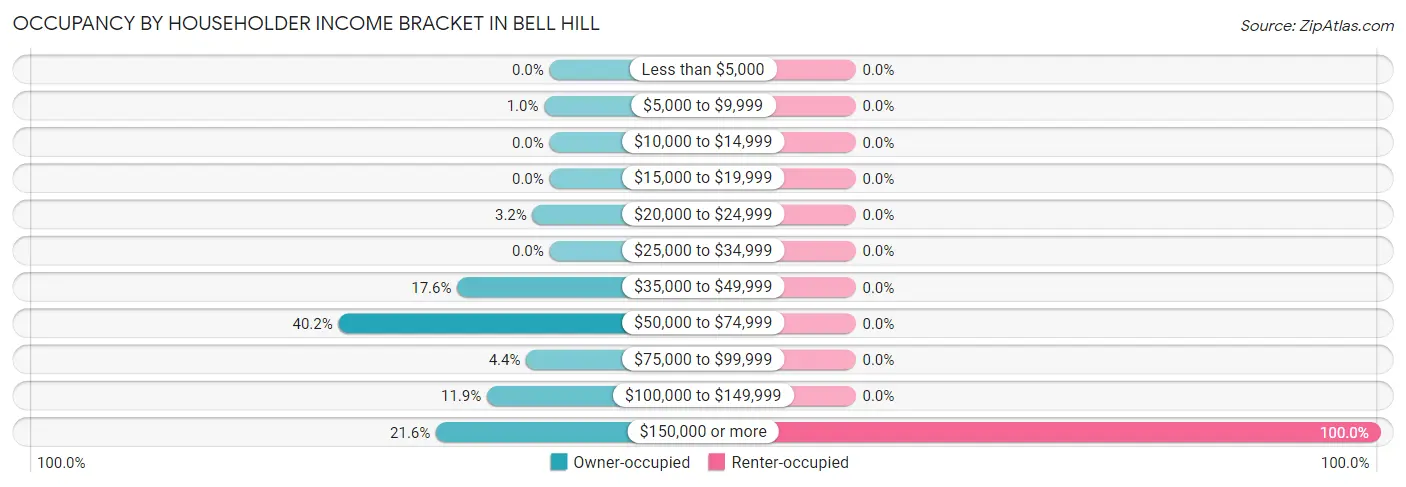
| Income Bracket | Owner-occupied | Renter-occupied |
| Less than $5,000 | 0 (0.0%) | 0 (0.0%) |
| $5,000 to $9,999 | 5 (1.0%) | 0 (0.0%) |
| $10,000 to $14,999 | 0 (0.0%) | 0 (0.0%) |
| $15,000 to $19,999 | 0 (0.0%) | 0 (0.0%) |
| $20,000 to $24,999 | 16 (3.2%) | 0 (0.0%) |
| $25,000 to $34,999 | 0 (0.0%) | 0 (0.0%) |
| $35,000 to $49,999 | 87 (17.6%) | 0 (0.0%) |
| $50,000 to $74,999 | 199 (40.2%) | 0 (0.0%) |
| $75,000 to $99,999 | 22 (4.4%) | 0 (0.0%) |
| $100,000 to $149,999 | 59 (11.9%) | 0 (0.0%) |
| $150,000 or more | 107 (21.6%) | 7 (100.0%) |
| Total | 495 (100.0%) | 7 (100.0%) |
Monthly Housing Cost Tiers in Bell Hill
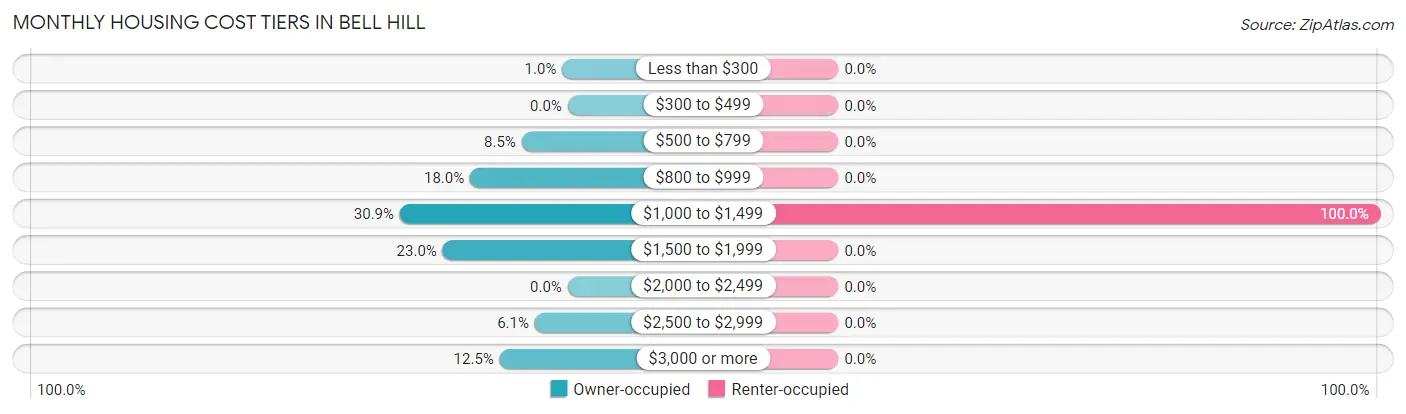
| Monthly Cost | Owner-occupied | Renter-occupied |
| Less than $300 | 5 (1.0%) | 0 (0.0%) |
| $300 to $499 | 0 (0.0%) | 0 (0.0%) |
| $500 to $799 | 42 (8.5%) | 0 (0.0%) |
| $800 to $999 | 89 (18.0%) | 0 (0.0%) |
| $1,000 to $1,499 | 153 (30.9%) | 7 (100.0%) |
| $1,500 to $1,999 | 114 (23.0%) | 0 (0.0%) |
| $2,000 to $2,499 | 0 (0.0%) | 0 (0.0%) |
| $2,500 to $2,999 | 30 (6.1%) | 0 (0.0%) |
| $3,000 or more | 62 (12.5%) | 0 (0.0%) |
| Total | 495 (100.0%) | 7 (100.0%) |
Physical Housing Characteristics in Bell Hill
Housing Structures in Bell Hill
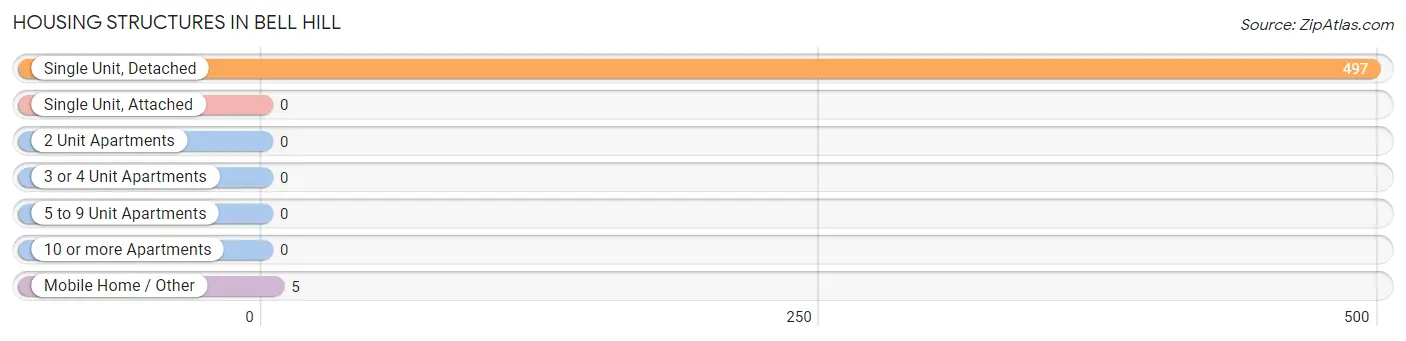
| Structure Type | # Housing Units | % Housing Units |
| Single Unit, Detached | 497 | 99.0% |
| Single Unit, Attached | 0 | 0.0% |
| 2 Unit Apartments | 0 | 0.0% |
| 3 or 4 Unit Apartments | 0 | 0.0% |
| 5 to 9 Unit Apartments | 0 | 0.0% |
| 10 or more Apartments | 0 | 0.0% |
| Mobile Home / Other | 5 | 1.0% |
| Total | 502 | 100.0% |
Housing Structures by Occupancy in Bell Hill
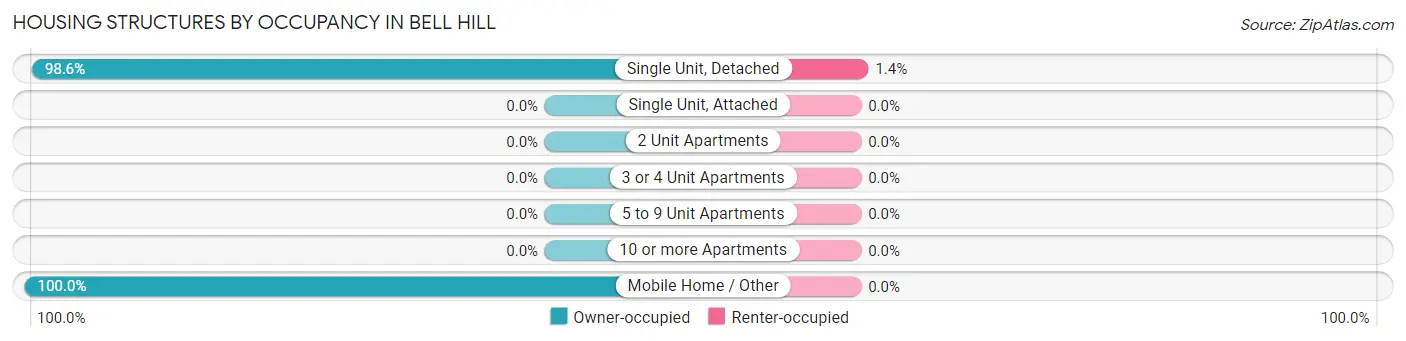
| Structure Type | Owner-occupied | Renter-occupied |
| Single Unit, Detached | 490 (98.6%) | 7 (1.4%) |
| Single Unit, Attached | 0 (0.0%) | 0 (0.0%) |
| 2 Unit Apartments | 0 (0.0%) | 0 (0.0%) |
| 3 or 4 Unit Apartments | 0 (0.0%) | 0 (0.0%) |
| 5 to 9 Unit Apartments | 0 (0.0%) | 0 (0.0%) |
| 10 or more Apartments | 0 (0.0%) | 0 (0.0%) |
| Mobile Home / Other | 5 (100.0%) | 0 (0.0%) |
| Total | 495 (98.6%) | 7 (1.4%) |
Housing Structures by Number of Rooms in Bell Hill
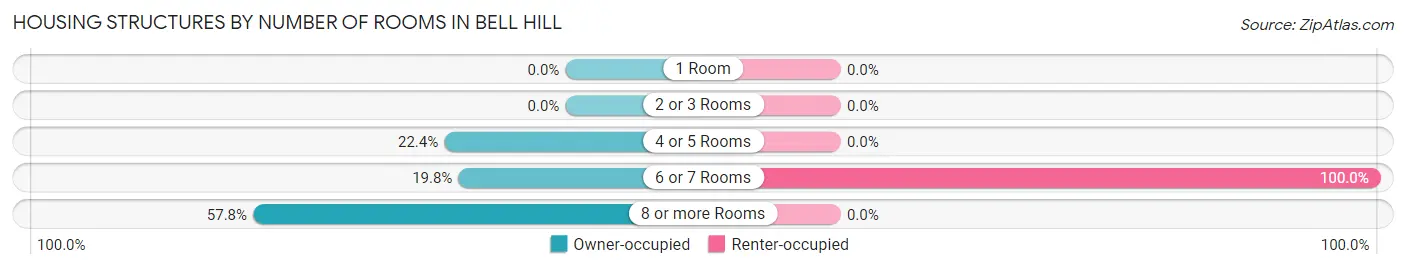
| Number of Rooms | Owner-occupied | Renter-occupied |
| 1 Room | 0 (0.0%) | 0 (0.0%) |
| 2 or 3 Rooms | 0 (0.0%) | 0 (0.0%) |
| 4 or 5 Rooms | 111 (22.4%) | 0 (0.0%) |
| 6 or 7 Rooms | 98 (19.8%) | 7 (100.0%) |
| 8 or more Rooms | 286 (57.8%) | 0 (0.0%) |
| Total | 495 (100.0%) | 7 (100.0%) |
Housing Structure by Heating Type in Bell Hill
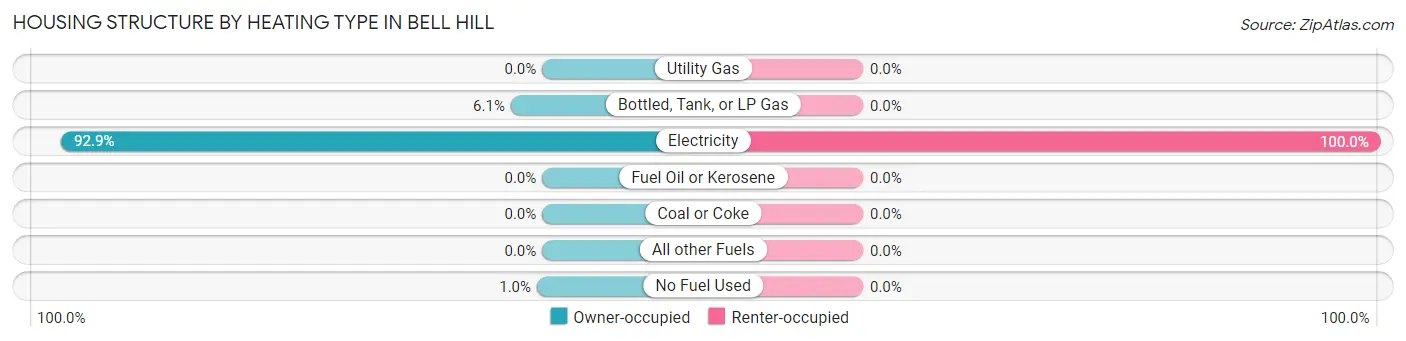
| Heating Type | Owner-occupied | Renter-occupied |
| Utility Gas | 0 (0.0%) | 0 (0.0%) |
| Bottled, Tank, or LP Gas | 30 (6.1%) | 0 (0.0%) |
| Electricity | 460 (92.9%) | 7 (100.0%) |
| Fuel Oil or Kerosene | 0 (0.0%) | 0 (0.0%) |
| Coal or Coke | 0 (0.0%) | 0 (0.0%) |
| All other Fuels | 0 (0.0%) | 0 (0.0%) |
| No Fuel Used | 5 (1.0%) | 0 (0.0%) |
| Total | 495 (100.0%) | 7 (100.0%) |
Household Vehicle Usage in Bell Hill
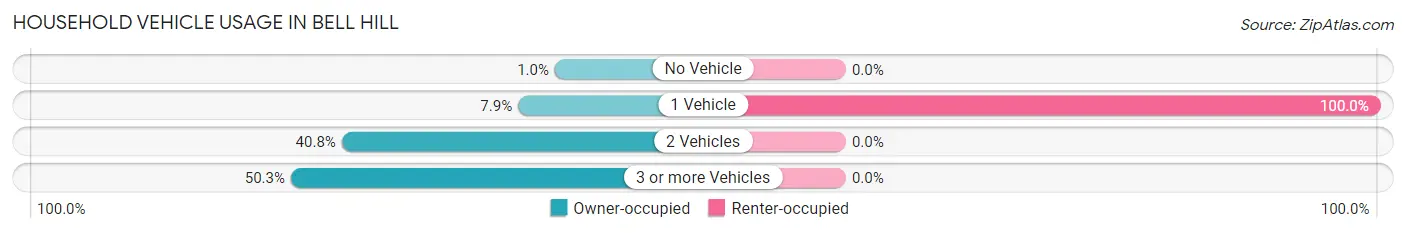
| Vehicles per Household | Owner-occupied | Renter-occupied |
| No Vehicle | 5 (1.0%) | 0 (0.0%) |
| 1 Vehicle | 39 (7.9%) | 7 (100.0%) |
| 2 Vehicles | 202 (40.8%) | 0 (0.0%) |
| 3 or more Vehicles | 249 (50.3%) | 0 (0.0%) |
| Total | 495 (100.0%) | 7 (100.0%) |
Real Estate & Mortgages in Bell Hill
Real Estate and Mortgage Overview in Bell Hill
| Characteristic | Without Mortgage | With Mortgage |
| Housing Units | 289 | 206 |
| Median Property Value | $852,200 | $659,000 |
| Median Household Income | $68,495 | $46 |
| Monthly Housing Costs | $1,013 | $62 |
| Real Estate Taxes | $6,242 | $16 |
Property Value by Mortgage Status in Bell Hill
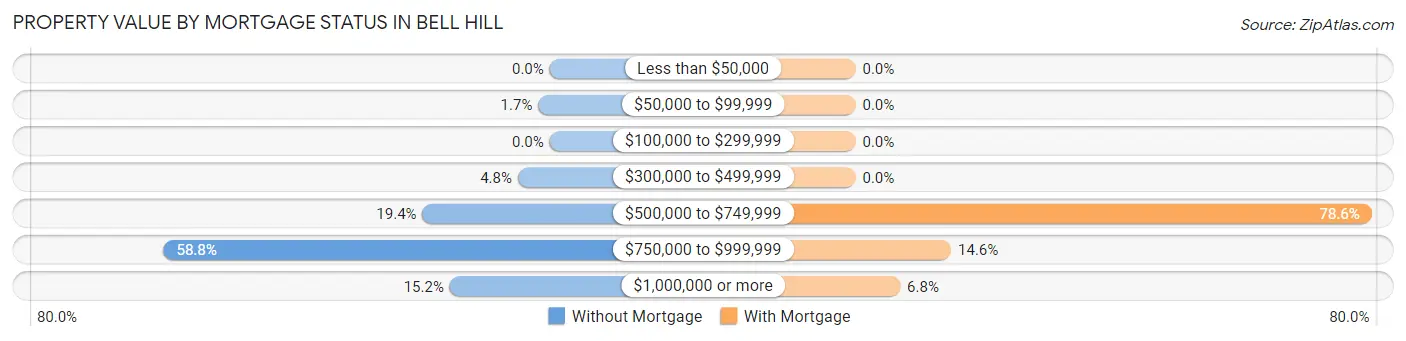
| Property Value | Without Mortgage | With Mortgage |
| Less than $50,000 | 0 (0.0%) | 0 (0.0%) |
| $50,000 to $99,999 | 5 (1.7%) | 0 (0.0%) |
| $100,000 to $299,999 | 0 (0.0%) | 0 (0.0%) |
| $300,000 to $499,999 | 14 (4.8%) | 0 (0.0%) |
| $500,000 to $749,999 | 56 (19.4%) | 162 (78.6%) |
| $750,000 to $999,999 | 170 (58.8%) | 30 (14.6%) |
| $1,000,000 or more | 44 (15.2%) | 14 (6.8%) |
| Total | 289 (100.0%) | 206 (100.0%) |
Household Income by Mortgage Status in Bell Hill
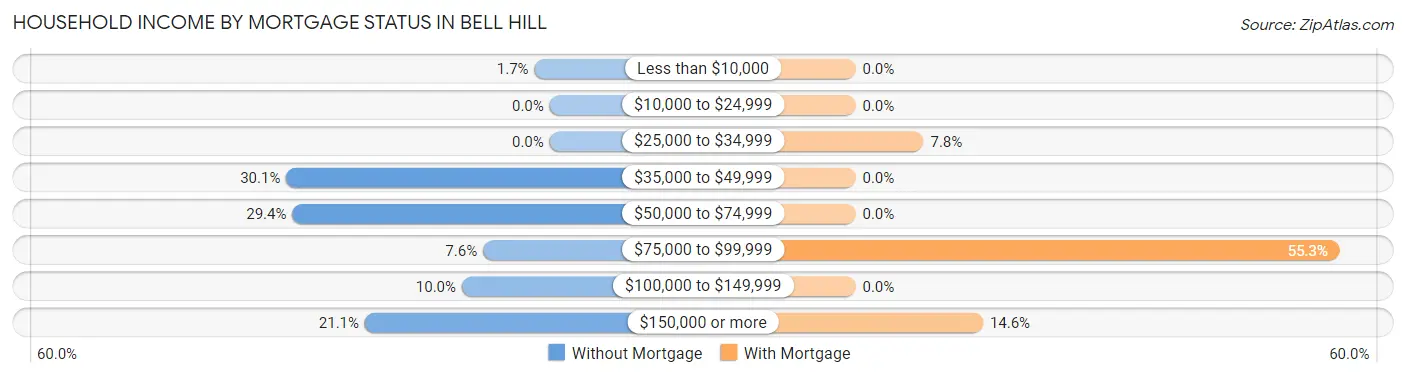
| Household Income | Without Mortgage | With Mortgage |
| Less than $10,000 | 5 (1.7%) | 0 (0.0%) |
| $10,000 to $24,999 | 0 (0.0%) | 0 (0.0%) |
| $25,000 to $34,999 | 0 (0.0%) | 16 (7.8%) |
| $35,000 to $49,999 | 87 (30.1%) | 0 (0.0%) |
| $50,000 to $74,999 | 85 (29.4%) | 0 (0.0%) |
| $75,000 to $99,999 | 22 (7.6%) | 114 (55.3%) |
| $100,000 to $149,999 | 29 (10.0%) | 0 (0.0%) |
| $150,000 or more | 61 (21.1%) | 30 (14.6%) |
| Total | 289 (100.0%) | 206 (100.0%) |
Property Value to Household Income Ratio in Bell Hill
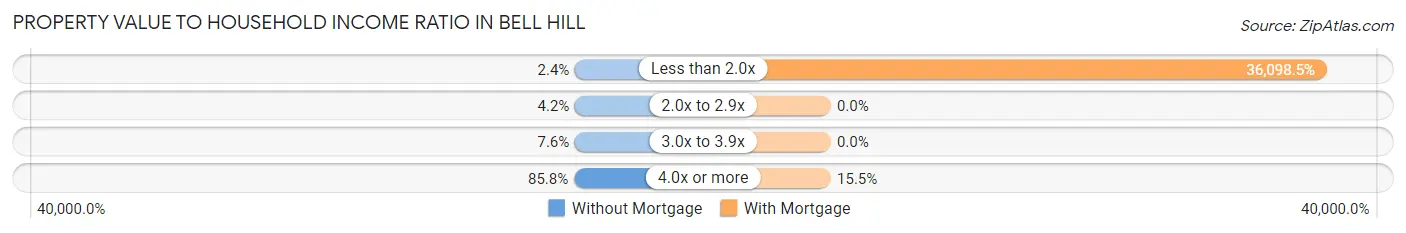
| Value-to-Income Ratio | Without Mortgage | With Mortgage |
| Less than 2.0x | 7 (2.4%) | 74,363 (36,098.5%) |
| 2.0x to 2.9x | 12 (4.2%) | 0 (0.0%) |
| 3.0x to 3.9x | 22 (7.6%) | 0 (0.0%) |
| 4.0x or more | 248 (85.8%) | 32 (15.5%) |
| Total | 289 (100.0%) | 206 (100.0%) |
Real Estate Taxes by Mortgage Status in Bell Hill
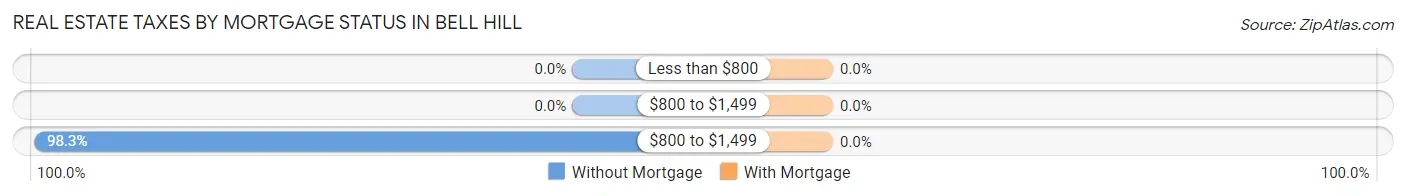
| Property Taxes | Without Mortgage | With Mortgage |
| Less than $800 | 0 (0.0%) | 0 (0.0%) |
| $800 to $1,499 | 0 (0.0%) | 0 (0.0%) |
| $800 to $1,499 | 284 (98.3%) | 0 (0.0%) |
| Total | 289 (100.0%) | 206 (100.0%) |
Health & Disability in Bell Hill
Health Insurance Coverage by Age in Bell Hill
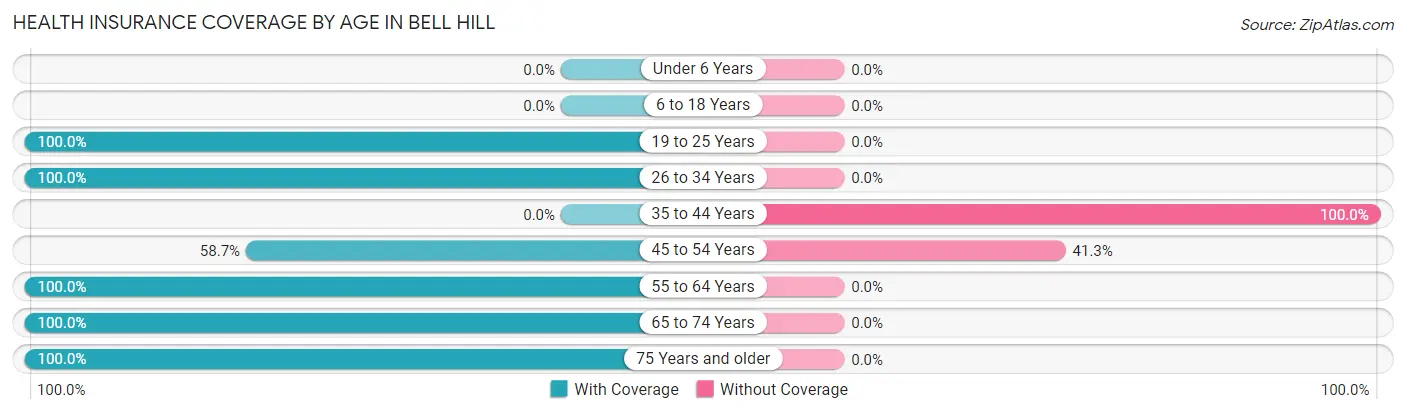
| Age Bracket | With Coverage | Without Coverage |
| Under 6 Years | 0 (0.0%) | 0 (0.0%) |
| 6 to 18 Years | 0 (0.0%) | 0 (0.0%) |
| 19 to 25 Years | 67 (100.0%) | 0 (0.0%) |
| 26 to 34 Years | 7 (100.0%) | 0 (0.0%) |
| 35 to 44 Years | 0 (0.0%) | 17 (100.0%) |
| 45 to 54 Years | 37 (58.7%) | 26 (41.3%) |
| 55 to 64 Years | 120 (100.0%) | 0 (0.0%) |
| 65 to 74 Years | 337 (100.0%) | 0 (0.0%) |
| 75 Years and older | 289 (100.0%) | 0 (0.0%) |
| Total | 857 (95.2%) | 43 (4.8%) |
Health Insurance Coverage by Citizenship Status in Bell Hill
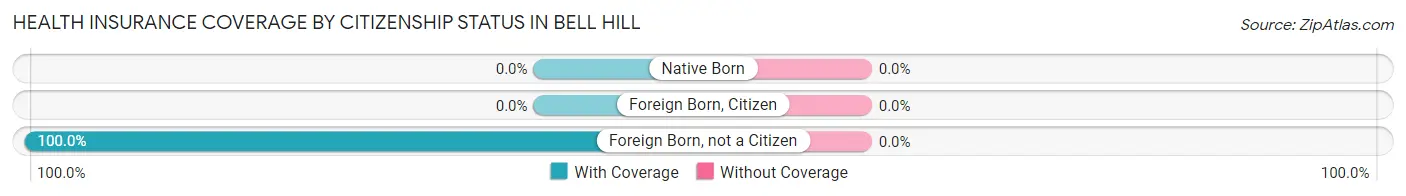
| Citizenship Status | With Coverage | Without Coverage |
| Native Born | 0 (0.0%) | 0 (0.0%) |
| Foreign Born, Citizen | 0 (0.0%) | 0 (0.0%) |
| Foreign Born, not a Citizen | 67 (100.0%) | 0 (0.0%) |
Health Insurance Coverage by Household Income in Bell Hill
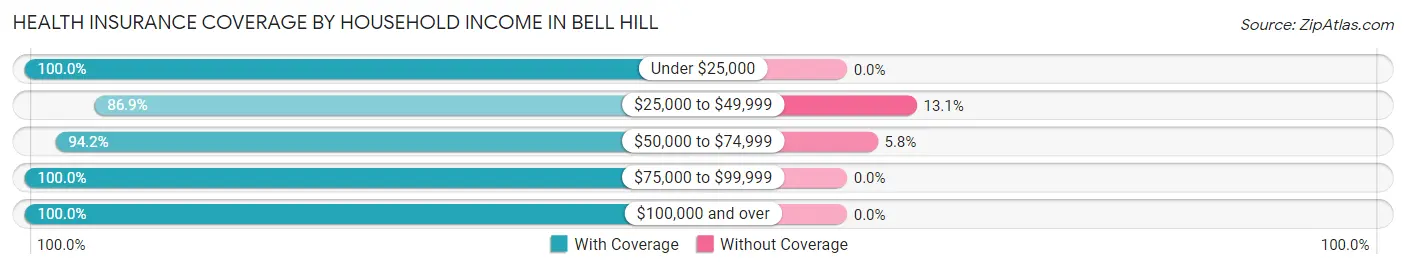
| Household Income | With Coverage | Without Coverage |
| Under $25,000 | 21 (100.0%) | 0 (0.0%) |
| $25,000 to $49,999 | 173 (86.9%) | 26 (13.1%) |
| $50,000 to $74,999 | 278 (94.2%) | 17 (5.8%) |
| $75,000 to $99,999 | 45 (100.0%) | 0 (0.0%) |
| $100,000 and over | 340 (100.0%) | 0 (0.0%) |
Public vs Private Health Insurance Coverage by Age in Bell Hill
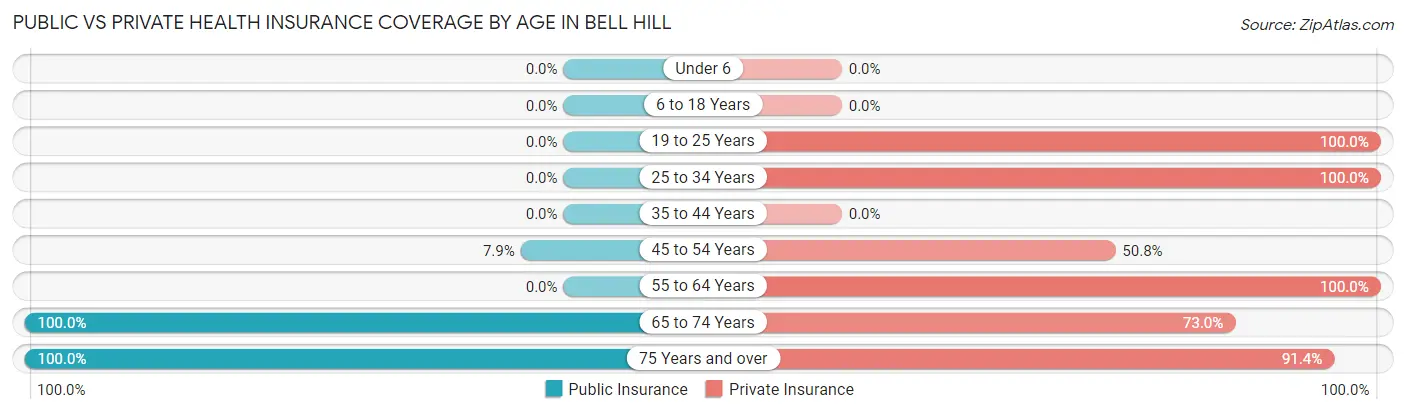
| Age Bracket | Public Insurance | Private Insurance |
| Under 6 | 0 (0.0%) | 0 (0.0%) |
| 6 to 18 Years | 0 (0.0%) | 0 (0.0%) |
| 19 to 25 Years | 0 (0.0%) | 67 (100.0%) |
| 25 to 34 Years | 0 (0.0%) | 7 (100.0%) |
| 35 to 44 Years | 0 (0.0%) | 0 (0.0%) |
| 45 to 54 Years | 5 (7.9%) | 32 (50.8%) |
| 55 to 64 Years | 0 (0.0%) | 120 (100.0%) |
| 65 to 74 Years | 337 (100.0%) | 246 (73.0%) |
| 75 Years and over | 289 (100.0%) | 264 (91.3%) |
| Total | 631 (70.1%) | 736 (81.8%) |
Disability Status by Sex by Age in Bell Hill
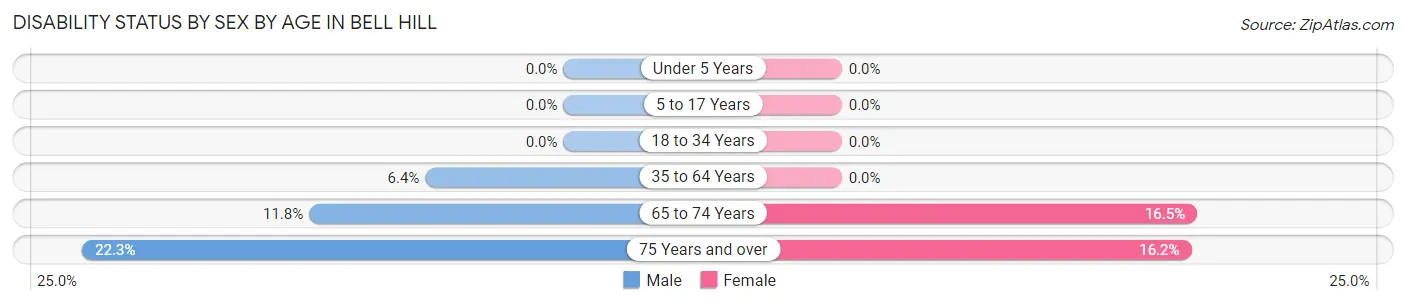
| Age Bracket | Male | Female |
| Under 5 Years | 0 (0.0%) | 0 (0.0%) |
| 5 to 17 Years | 0 (0.0%) | 0 (0.0%) |
| 18 to 34 Years | 0 (0.0%) | 0 (0.0%) |
| 35 to 64 Years | 5 (6.4%) | 0 (0.0%) |
| 65 to 74 Years | 19 (11.8%) | 29 (16.5%) |
| 75 Years and over | 48 (22.3%) | 12 (16.2%) |
Disability Class by Sex by Age in Bell Hill
Disability Class: Hearing Difficulty
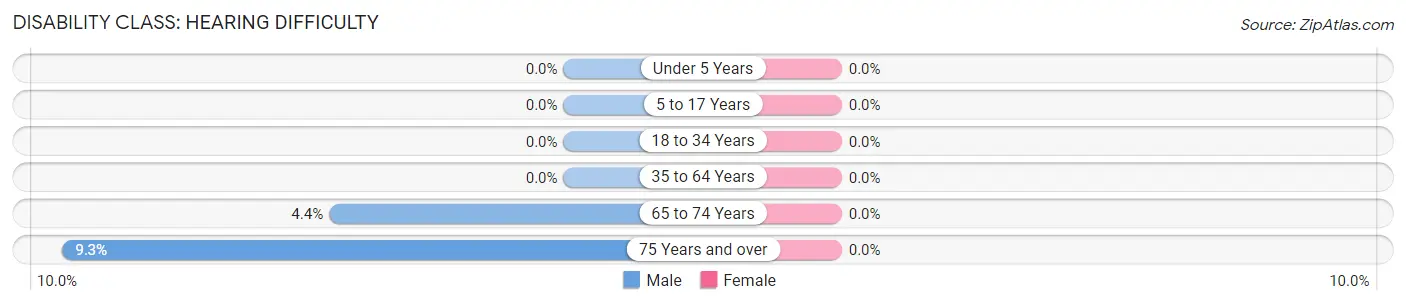
| Age Bracket | Male | Female |
| Under 5 Years | 0 (0.0%) | 0 (0.0%) |
| 5 to 17 Years | 0 (0.0%) | 0 (0.0%) |
| 18 to 34 Years | 0 (0.0%) | 0 (0.0%) |
| 35 to 64 Years | 0 (0.0%) | 0 (0.0%) |
| 65 to 74 Years | 7 (4.3%) | 0 (0.0%) |
| 75 Years and over | 20 (9.3%) | 0 (0.0%) |
Disability Class: Vision Difficulty
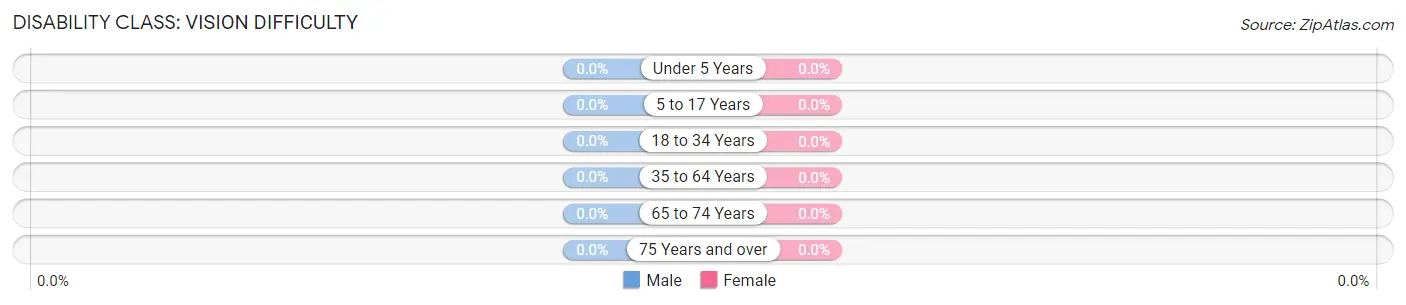
| Age Bracket | Male | Female |
| Under 5 Years | 0 (0.0%) | 0 (0.0%) |
| 5 to 17 Years | 0 (0.0%) | 0 (0.0%) |
| 18 to 34 Years | 0 (0.0%) | 0 (0.0%) |
| 35 to 64 Years | 0 (0.0%) | 0 (0.0%) |
| 65 to 74 Years | 0 (0.0%) | 0 (0.0%) |
| 75 Years and over | 0 (0.0%) | 0 (0.0%) |
Disability Class: Cognitive Difficulty
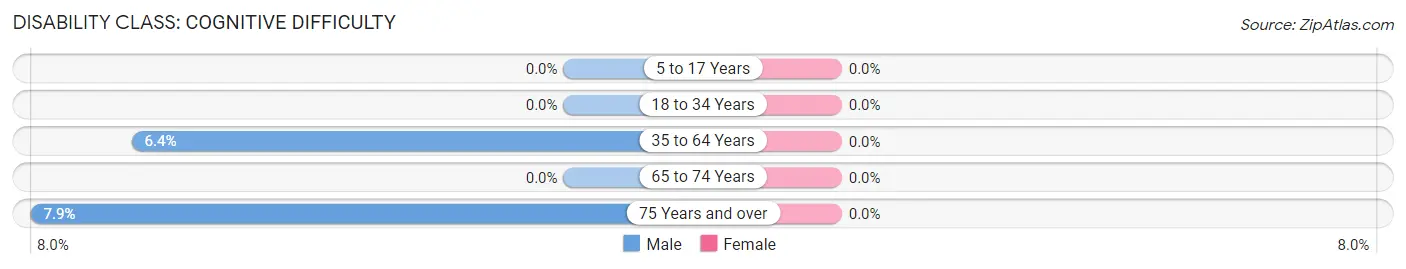
| Age Bracket | Male | Female |
| 5 to 17 Years | 0 (0.0%) | 0 (0.0%) |
| 18 to 34 Years | 0 (0.0%) | 0 (0.0%) |
| 35 to 64 Years | 5 (6.4%) | 0 (0.0%) |
| 65 to 74 Years | 0 (0.0%) | 0 (0.0%) |
| 75 Years and over | 17 (7.9%) | 0 (0.0%) |
Disability Class: Ambulatory Difficulty
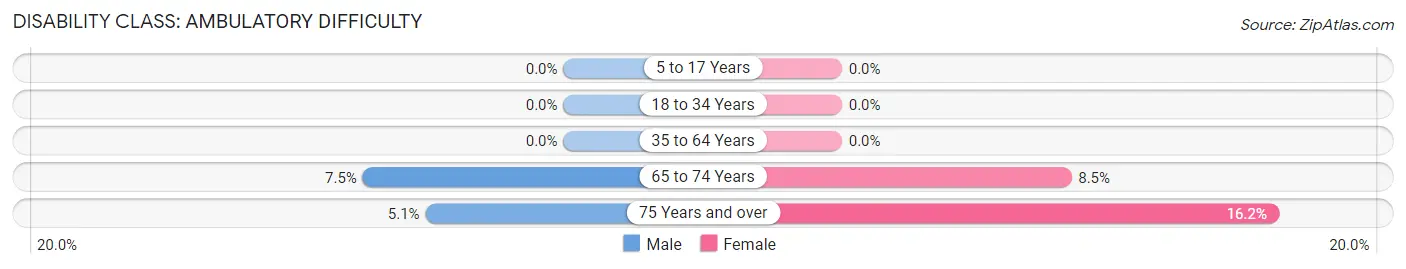
| Age Bracket | Male | Female |
| 5 to 17 Years | 0 (0.0%) | 0 (0.0%) |
| 18 to 34 Years | 0 (0.0%) | 0 (0.0%) |
| 35 to 64 Years | 0 (0.0%) | 0 (0.0%) |
| 65 to 74 Years | 12 (7.4%) | 15 (8.5%) |
| 75 Years and over | 11 (5.1%) | 12 (16.2%) |
Disability Class: Self-Care Difficulty
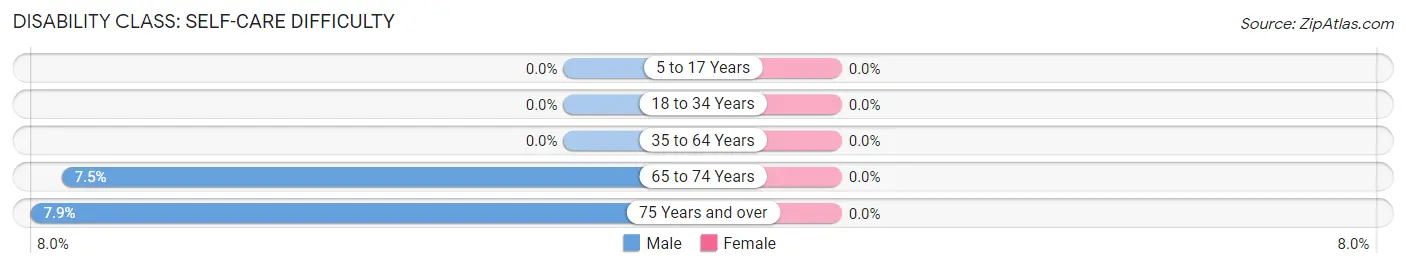
| Age Bracket | Male | Female |
| 5 to 17 Years | 0 (0.0%) | 0 (0.0%) |
| 18 to 34 Years | 0 (0.0%) | 0 (0.0%) |
| 35 to 64 Years | 0 (0.0%) | 0 (0.0%) |
| 65 to 74 Years | 12 (7.4%) | 0 (0.0%) |
| 75 Years and over | 17 (7.9%) | 0 (0.0%) |
Technology Access in Bell Hill
Computing Device Access in Bell Hill
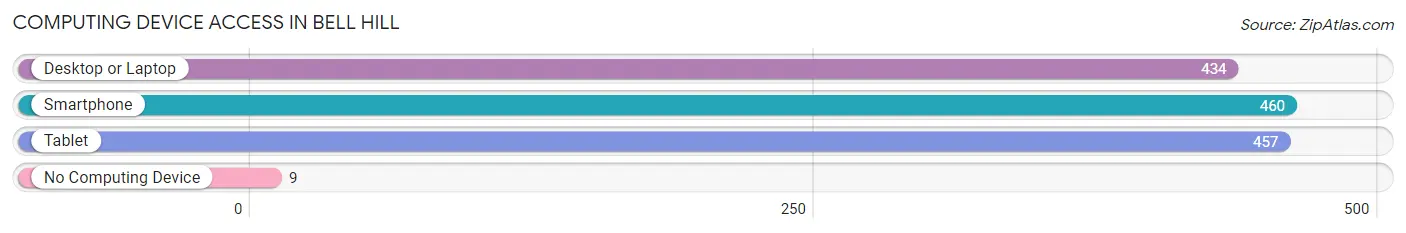
| Device Type | # Households | % Households |
| Desktop or Laptop | 434 | 86.5% |
| Smartphone | 460 | 91.6% |
| Tablet | 457 | 91.0% |
| No Computing Device | 9 | 1.8% |
| Total | 502 | 100.0% |
Internet Access in Bell Hill
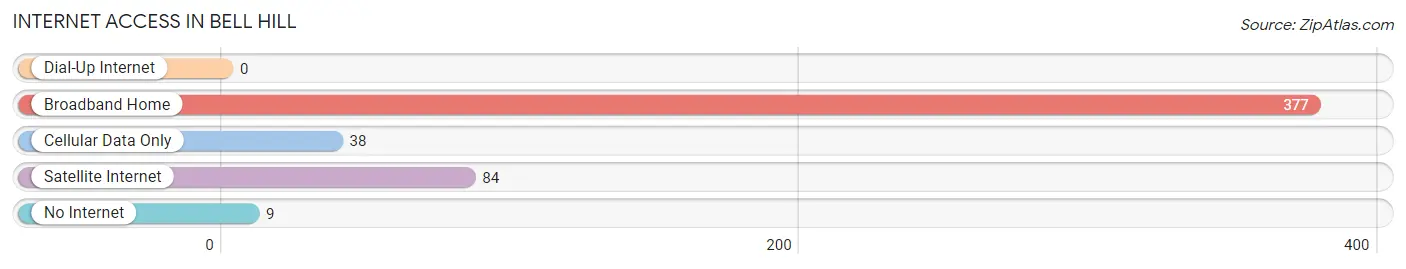
| Internet Type | # Households | % Households |
| Dial-Up Internet | 0 | 0.0% |
| Broadband Home | 377 | 75.1% |
| Cellular Data Only | 38 | 7.6% |
| Satellite Internet | 84 | 16.7% |
| No Internet | 9 | 1.8% |
| Total | 502 | 100.0% |
Bell Hill Summary
Hill, WA is a small town located in the state of Washington, United States. It is situated in the foothills of the Cascade Mountains, approximately 20 miles east of Seattle. The town is home to a population of approximately 1,500 people, and is known for its rural charm and scenic beauty.
History
The area that is now Bell Hill was first settled in the late 1800s by a group of homesteaders. The town was originally known as “Bell’s Hill”, named after the first settler, William Bell. The town was officially incorporated in 1909, and the name was changed to Bell Hill.
In the early 1900s, the town was a thriving logging and farming community. The logging industry provided employment for many of the town’s residents, and the farms provided food for the local population. The town also had a small sawmill, which provided lumber for the local area.
In the 1950s, the town began to experience a decline in population as many of the residents moved away in search of better job opportunities. The town’s economy shifted to focus more on tourism, as the area became a popular destination for outdoor recreation.
Geography
Bell Hill is located in the foothills of the Cascade Mountains, approximately 20 miles east of Seattle. The town is situated at an elevation of approximately 1,000 feet, and is surrounded by lush forests and rolling hills. The town is located in the Snoqualmie Valley, and is bordered by the Snoqualmie River to the north and the Tolt River to the south.
The climate in Bell Hill is mild and temperate, with warm summers and cool winters. The average annual temperature is around 50 degrees Fahrenheit, and the average annual precipitation is around 40 inches.
Economy
The economy of Bell Hill is largely based on tourism and outdoor recreation. The town is home to several popular outdoor attractions, including hiking trails, fishing spots, and camping sites. The town also has a small retail sector, with several shops and restaurants located in the downtown area.
The town is also home to several small businesses, including a local brewery, a winery, and a distillery. The town is also home to a small manufacturing sector, with several small factories located in the area.
Demographics
As of the 2010 census, the population of Bell Hill was 1,500. The racial makeup of the town was 94.2% White, 0.7% African American, 0.7% Native American, 0.7% Asian, 0.7% from other races, and 2.7% from two or more races. Hispanic or Latino of any race were 2.7% of the population.
The median household income in Bell Hill was $50,000, and the median family income was $54,000. The per capita income for the town was $25,000. Approximately 8.7% of the population was below the poverty line.
Conclusion
Bell Hill, WA is a small town located in the foothills of the Cascade Mountains, approximately 20 miles east of Seattle. The town is home to a population of approximately 1,500 people, and is known for its rural charm and scenic beauty. The economy of Bell Hill is largely based on tourism and outdoor recreation, and the town is home to several small businesses and manufacturing facilities. The racial makeup of the town is predominantly White, with a small percentage of African American, Native American, Asian, and other races. The median household income in Bell Hill is $50,000, and the per capita income is $25,000.
Common Questions
What is Per Capita Income in Bell Hill?
Per Capita income in Bell Hill is $56,163.
What is the Median Household income in Bell Hill?
Median Household Income in Bell Hill is $73,679.
What is Inequality or Gini Index in Bell Hill?
Inequality or Gini Index in Bell Hill is 0.36.
What is the Total Population of Bell Hill?
Total Population of Bell Hill is 900.
What is the Total Male Population of Bell Hill?
Total Male Population of Bell Hill is 491.
What is the Total Female Population of Bell Hill?
Total Female Population of Bell Hill is 409.
What is the Ratio of Males per 100 Females in Bell Hill?
There are 120.05 Males per 100 Females in Bell Hill.
What is the Ratio of Females per 100 Males in Bell Hill?
There are 83.30 Females per 100 Males in Bell Hill.
What is the Median Population Age in Bell Hill?
Median Population Age in Bell Hill is 70.3 Years.
What is the Average Family Size in Bell Hill
Average Family Size in Bell Hill is 2.2 People.
What is the Average Household Size in Bell Hill
Average Household Size in Bell Hill is 1.8 People.
How Large is the Labor Force in Bell Hill?
There are 130 People in the Labor Forcein in Bell Hill.
What is the Percentage of People in the Labor Force in Bell Hill?
14.4% of People are in the Labor Force in Bell Hill.
What is the Unemployment Rate in Bell Hill?
Unemployment Rate in Bell Hill is 23.1%.