Cities with the Highest Percentage of Immigrants from Bosnia and Herzegovina in Washington
RELATED REPORTS & OPTIONS
Bosnia and Herzegovina
Washington
Compare Cities
Map of Cities with the Highest Percentage of Immigrants from Bosnia and Herzegovina in Washington
0.00%
2.00%
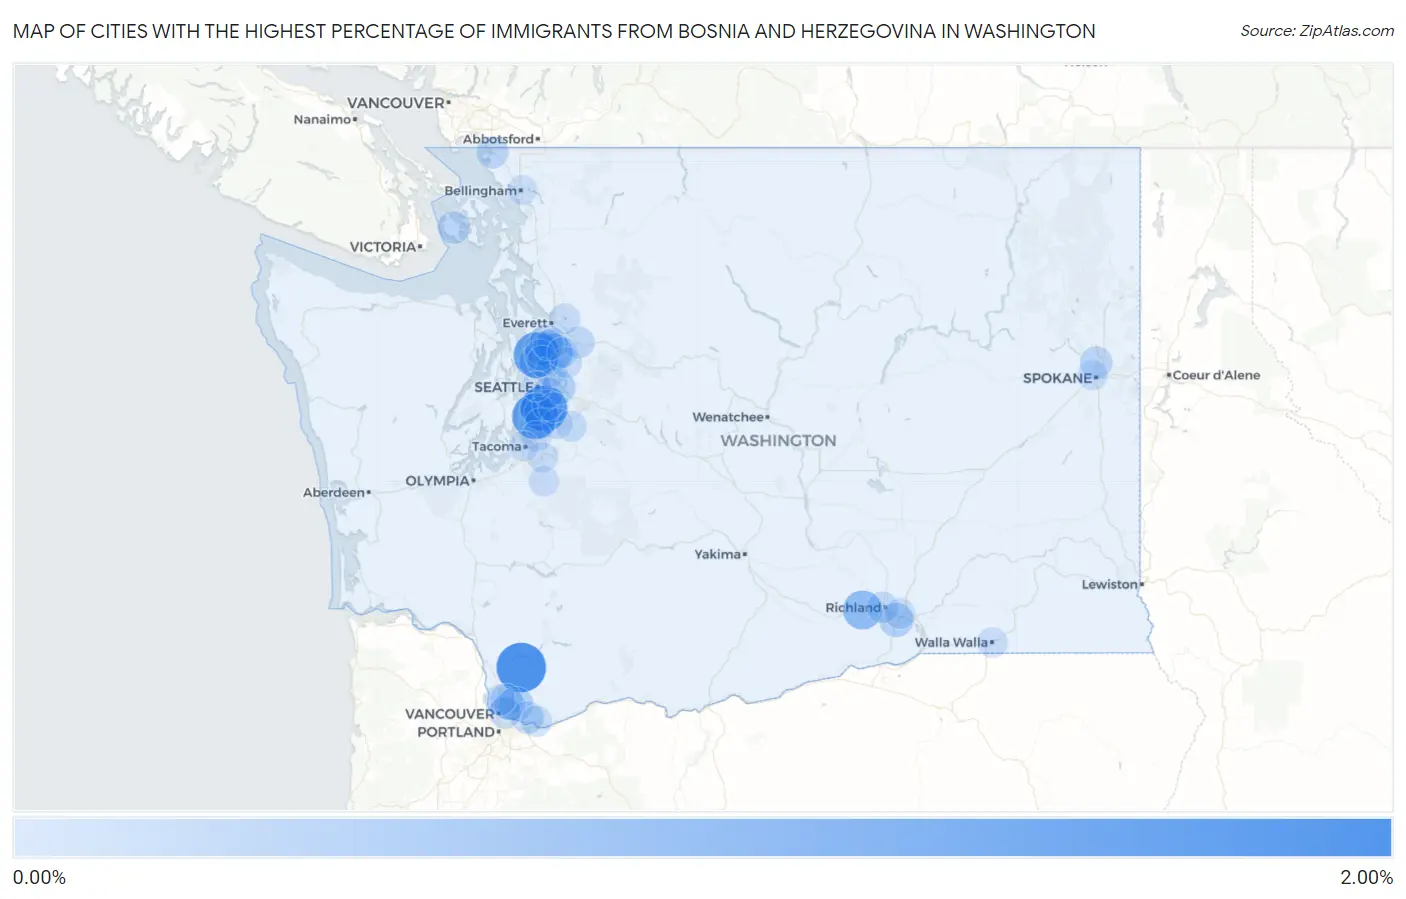
Cities with the Highest Percentage of Immigrants from Bosnia and Herzegovina in Washington
| City | Bosnia and Herzegovina | vs State | vs National | |
| 1. | Amboy | 1.96% | 0.050%(+1.91)#1 | 0.032%(+1.93)#34 |
| 2. | Tukwila | 1.66% | 0.050%(+1.61)#2 | 0.032%(+1.62)#41 |
| 3. | Normandy Park | 1.55% | 0.050%(+1.50)#3 | 0.032%(+1.52)#50 |
| 4. | Esperance | 1.52% | 0.050%(+1.47)#4 | 0.032%(+1.49)#52 |
| 5. | Benton City | 0.89% | 0.050%(+0.836)#5 | 0.032%(+0.854)#100 |
| 6. | Bothell East | 0.75% | 0.050%(+0.696)#6 | 0.032%(+0.714)#122 |
| 7. | Shoreline | 0.42% | 0.050%(+0.373)#7 | 0.032%(+0.391)#204 |
| 8. | Seatac | 0.40% | 0.050%(+0.351)#8 | 0.032%(+0.369)#213 |
| 9. | Kennewick | 0.39% | 0.050%(+0.343)#9 | 0.032%(+0.360)#218 |
| 10. | Orchards | 0.37% | 0.050%(+0.320)#10 | 0.032%(+0.338)#238 |
| 11. | Bellevue | 0.36% | 0.050%(+0.309)#11 | 0.032%(+0.327)#245 |
| 12. | Lynnwood | 0.35% | 0.050%(+0.299)#12 | 0.032%(+0.317)#253 |
| 13. | Lake Stickney | 0.25% | 0.050%(+0.202)#13 | 0.032%(+0.220)#327 |
| 14. | Friday Harbor | 0.23% | 0.050%(+0.177)#14 | 0.032%(+0.195)#350 |
| 15. | Country Homes | 0.22% | 0.050%(+0.174)#15 | 0.032%(+0.192)#353 |
| 16. | Barberton | 0.21% | 0.050%(+0.164)#16 | 0.032%(+0.182)#365 |
| 17. | Camas | 0.21% | 0.050%(+0.159)#17 | 0.032%(+0.176)#372 |
| 18. | Vancouver | 0.20% | 0.050%(+0.153)#18 | 0.032%(+0.171)#379 |
| 19. | Burien | 0.20% | 0.050%(+0.152)#19 | 0.032%(+0.170)#383 |
| 20. | Blaine | 0.19% | 0.050%(+0.138)#20 | 0.032%(+0.155)#402 |
| 21. | Monroe | 0.18% | 0.050%(+0.129)#21 | 0.032%(+0.146)#414 |
| 22. | Kirkland | 0.15% | 0.050%(+0.096)#22 | 0.032%(+0.114)#460 |
| 23. | Richland | 0.14% | 0.050%(+0.095)#23 | 0.032%(+0.112)#463 |
| 24. | Mill Creek | 0.12% | 0.050%(+0.070)#24 | 0.032%(+0.088)#513 |
| 25. | Five Corners | 0.12% | 0.050%(+0.070)#25 | 0.032%(+0.087)#515 |
| 26. | Washougal | 0.10% | 0.050%(+0.051)#26 | 0.032%(+0.069)#557 |
| 27. | Mountlake Terrace | 0.089% | 0.050%(+0.039)#27 | 0.032%(+0.057)#598 |
| 28. | Maple Valley | 0.086% | 0.050%(+0.036)#28 | 0.032%(+0.054)#610 |
| 29. | Lake Forest Park | 0.082% | 0.050%(+0.032)#29 | 0.032%(+0.050)#625 |
| 30. | Salmon Creek | 0.079% | 0.050%(+0.029)#30 | 0.032%(+0.047)#635 |
| 31. | Cottage Lake | 0.077% | 0.050%(+0.028)#31 | 0.032%(+0.045)#641 |
| 32. | Lake Stevens | 0.075% | 0.050%(+0.025)#32 | 0.032%(+0.043)#646 |
| 33. | Martha Lake | 0.073% | 0.050%(+0.023)#33 | 0.032%(+0.041)#654 |
| 34. | Pasco | 0.060% | 0.050%(+0.010)#34 | 0.032%(+0.027)#687 |
| 35. | Des Moines | 0.055% | 0.050%(+0.005)#35 | 0.032%(+0.023)#703 |
| 36. | Maltby | 0.053% | 0.050%(+0.003)#36 | 0.032%(+0.021)#715 |
| 37. | Kent | 0.047% | 0.050%(-0.002)#37 | 0.032%(+0.015)#736 |
| 38. | Bryn Mawr Skyway | 0.044% | 0.050%(-0.005)#38 | 0.032%(+0.012)#754 |
| 39. | Walla Walla | 0.044% | 0.050%(-0.005)#39 | 0.032%(+0.012)#755 |
| 40. | Fairwood Cdp King County | 0.043% | 0.050%(-0.007)#40 | 0.032%(+0.011)#764 |
| 41. | Federal Way | 0.042% | 0.050%(-0.008)#41 | 0.032%(+0.010)#771 |
| 42. | Spokane | 0.035% | 0.050%(-0.015)#42 | 0.032%(+0.003)#811 |
| 43. | Mercer Island | 0.031% | 0.050%(-0.018)#43 | 0.032%(-0.001)#849 |
| 44. | Graham | 0.029% | 0.050%(-0.021)#44 | 0.032%(-0.003)#869 |
| 45. | Renton | 0.022% | 0.050%(-0.028)#45 | 0.032%(-0.010)#920 |
| 46. | Puyallup | 0.021% | 0.050%(-0.029)#46 | 0.032%(-0.011)#924 |
| 47. | Seattle | 0.013% | 0.050%(-0.037)#47 | 0.032%(-0.020)#984 |
| 48. | Bellingham | 0.0055% | 0.050%(-0.044)#48 | 0.032%(-0.027)#1,036 |
| 49. | Tacoma | 0.0023% | 0.050%(-0.047)#49 | 0.032%(-0.030)#1,057 |
Common Questions
What are the Top 10 Cities with the Highest Percentage of Immigrants from Bosnia and Herzegovina in Washington?
Top 10 Cities with the Highest Percentage of Immigrants from Bosnia and Herzegovina in Washington are:
#1
1.96%
#2
1.66%
#3
1.55%
#4
1.52%
#5
0.89%
#6
0.75%
#7
0.42%
#8
0.40%
#9
0.39%
#10
0.37%
What city has the Highest Percentage of Immigrants from Bosnia and Herzegovina in Washington?
Amboy has the Highest Percentage of Immigrants from Bosnia and Herzegovina in Washington with 1.96%.
What is the Percentage of Immigrants from Bosnia and Herzegovina in the State of Washington?
Percentage of Immigrants from Bosnia and Herzegovina in Washington is 0.050%.
What is the Percentage of Immigrants from Bosnia and Herzegovina in the United States?
Percentage of Immigrants from Bosnia and Herzegovina in the United States is 0.032%.