Lake Ketchum, WA Map & Demographics
Lake Ketchum Map
Lake Ketchum Overview
$33,854
PER CAPITA INCOME
$93,203
AVG FAMILY INCOME
$82,431
AVG HOUSEHOLD INCOME
46.9%
WAGE / INCOME GAP [ % ]
53.1¢/ $1
WAGE / INCOME GAP [ $ ]
0.34
INEQUALITY / GINI INDEX
1,402
TOTAL POPULATION
736
MALE POPULATION
666
FEMALE POPULATION
110.51
MALES / 100 FEMALES
90.49
FEMALES / 100 MALES
52.0
MEDIAN AGE
3.1
AVG FAMILY SIZE
3.2
AVG HOUSEHOLD SIZE
584
LABOR FORCE [ PEOPLE ]
50.7%
PERCENT IN LABOR FORCE
Income in Lake Ketchum
Income Overview in Lake Ketchum
Per Capita Income in Lake Ketchum is $33,854, while median incomes of families and households are $93,203 and $82,431 respectively.
| Characteristic | Number | Measure |
| Per Capita Income | 1,402 | $33,854 |
| Median Family Income | 401 | $93,203 |
| Mean Family Income | 401 | $113,422 |
| Median Household Income | 433 | $82,431 |
| Mean Household Income | 433 | $106,849 |
| Income Deficit | 401 | $0 |
| Wage / Income Gap (%) | 1,402 | 46.88% |
| Wage / Income Gap ($) | 1,402 | 53.12¢ per $1 |
| Gini / Inequality Index | 1,402 | 0.34 |
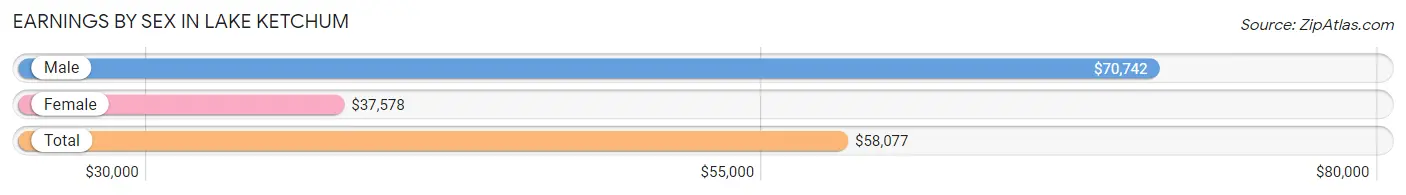
Earnings by Sex in Lake Ketchum
Average Earnings in Lake Ketchum are $58,077, $70,742 for men and $37,578 for women, a difference of 46.9%.
| Sex | Number | Average Earnings |
| Male | 375 (61.5%) | $70,742 |
| Female | 235 (38.5%) | $37,578 |
| Total | 610 (100.0%) | $58,077 |
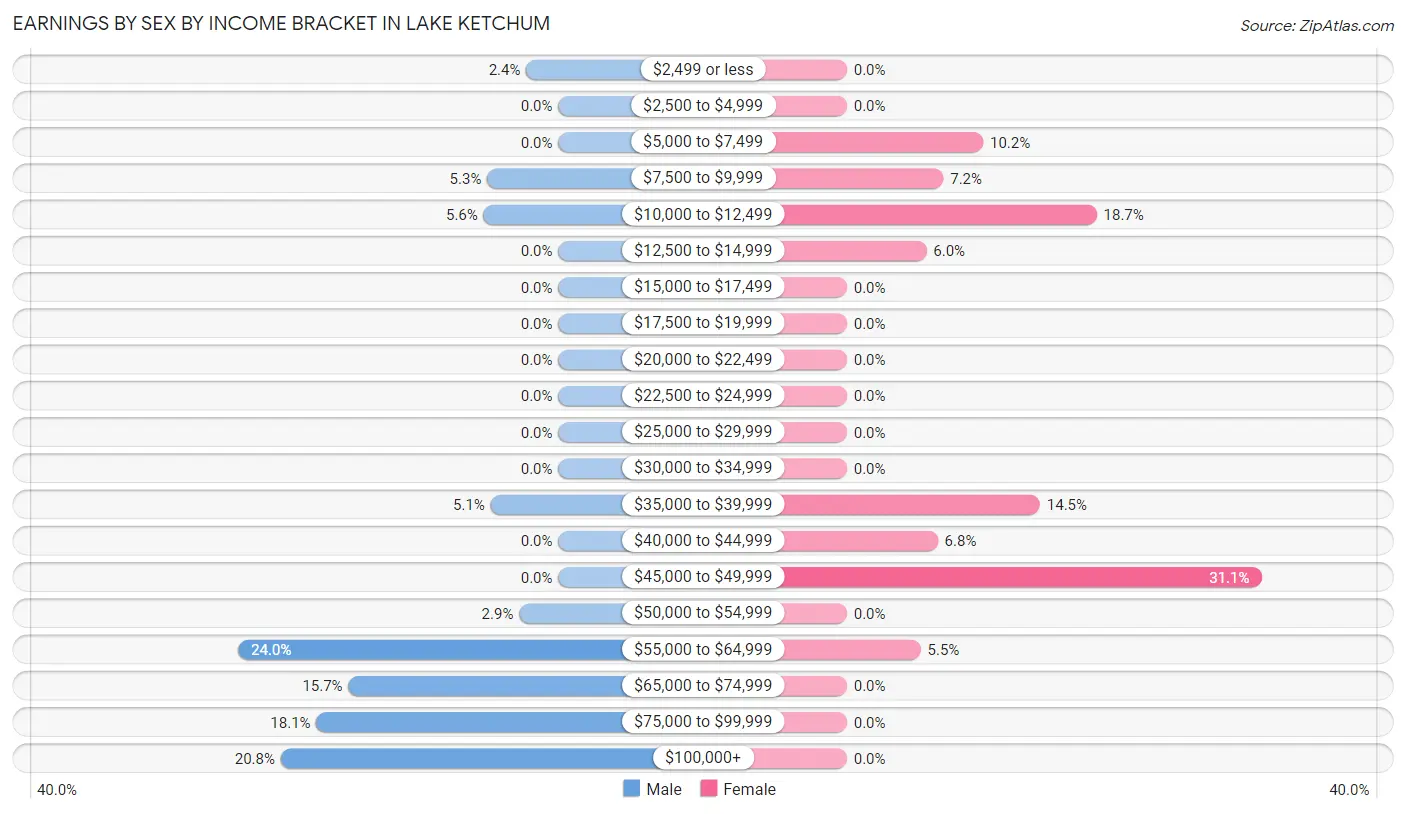
Earnings by Sex by Income Bracket in Lake Ketchum
The most common earnings brackets in Lake Ketchum are $55,000 to $64,999 for men (90 | 24.0%) and $45,000 to $49,999 for women (73 | 31.1%).
| Income | Male | Female |
| $2,499 or less | 9 (2.4%) | 0 (0.0%) |
| $2,500 to $4,999 | 0 (0.0%) | 0 (0.0%) |
| $5,000 to $7,499 | 0 (0.0%) | 24 (10.2%) |
| $7,500 to $9,999 | 20 (5.3%) | 17 (7.2%) |
| $10,000 to $12,499 | 21 (5.6%) | 44 (18.7%) |
| $12,500 to $14,999 | 0 (0.0%) | 14 (6.0%) |
| $15,000 to $17,499 | 0 (0.0%) | 0 (0.0%) |
| $17,500 to $19,999 | 0 (0.0%) | 0 (0.0%) |
| $20,000 to $22,499 | 0 (0.0%) | 0 (0.0%) |
| $22,500 to $24,999 | 0 (0.0%) | 0 (0.0%) |
| $25,000 to $29,999 | 0 (0.0%) | 0 (0.0%) |
| $30,000 to $34,999 | 0 (0.0%) | 0 (0.0%) |
| $35,000 to $39,999 | 19 (5.1%) | 34 (14.5%) |
| $40,000 to $44,999 | 0 (0.0%) | 16 (6.8%) |
| $45,000 to $49,999 | 0 (0.0%) | 73 (31.1%) |
| $50,000 to $54,999 | 11 (2.9%) | 0 (0.0%) |
| $55,000 to $64,999 | 90 (24.0%) | 13 (5.5%) |
| $65,000 to $74,999 | 59 (15.7%) | 0 (0.0%) |
| $75,000 to $99,999 | 68 (18.1%) | 0 (0.0%) |
| $100,000+ | 78 (20.8%) | 0 (0.0%) |
| Total | 375 (100.0%) | 235 (100.0%) |
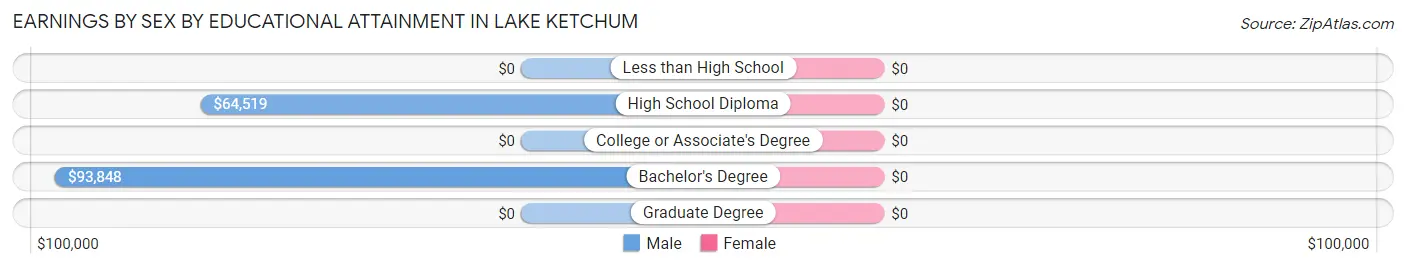
Earnings by Sex by Educational Attainment in Lake Ketchum
| Educational Attainment | Male Income | Female Income |
| Less than High School | - | - |
| High School Diploma | $64,519 | $0 |
| College or Associate's Degree | - | - |
| Bachelor's Degree | $93,848 | $0 |
| Graduate Degree | - | - |
| Total | $71,186 | $41,172 |
Family Income in Lake Ketchum
Family Income Brackets in Lake Ketchum
According to the Lake Ketchum family income data, there are 97 families falling into the $50,000 to $74,999 income range, which is the most common income bracket and makes up 24.2% of all families.
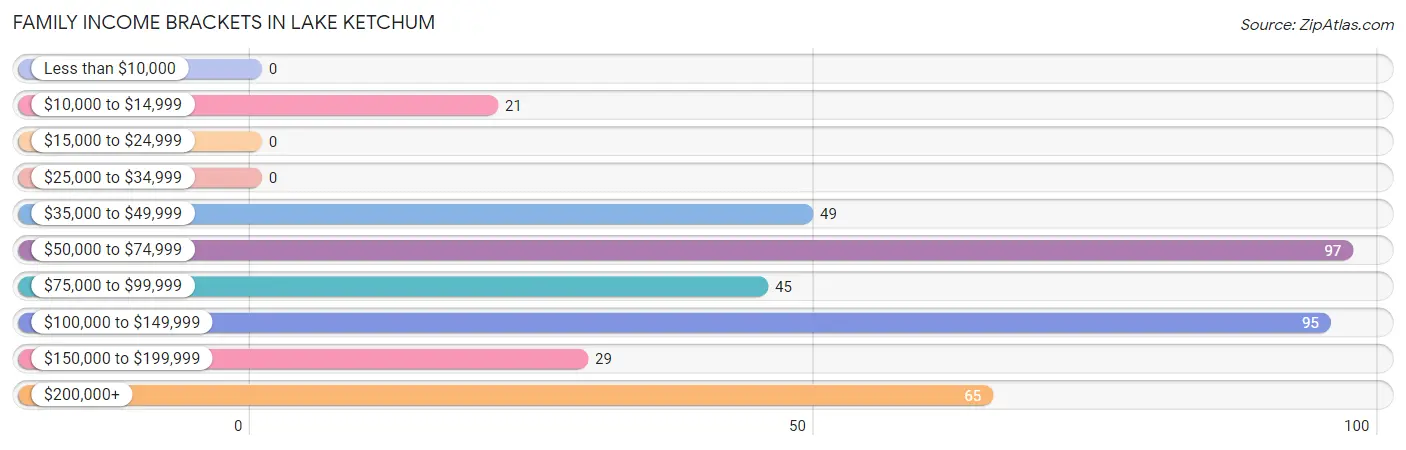
| Income Bracket | # Families | % Families |
| Less than $10,000 | 0 | 0.0% |
| $10,000 to $14,999 | 21 | 5.2% |
| $15,000 to $24,999 | 0 | 0.0% |
| $25,000 to $34,999 | 0 | 0.0% |
| $35,000 to $49,999 | 49 | 12.2% |
| $50,000 to $74,999 | 97 | 24.2% |
| $75,000 to $99,999 | 45 | 11.2% |
| $100,000 to $149,999 | 95 | 23.7% |
| $150,000 to $199,999 | 29 | 7.2% |
| $200,000+ | 65 | 16.2% |
Family Income by Famaliy Size in Lake Ketchum
4-person families (136 | 33.9%) account for the highest median family income in Lake Ketchum with $144,281 per family, while 4-person families (136 | 33.9%) have the highest median income of $36,070 per family member.
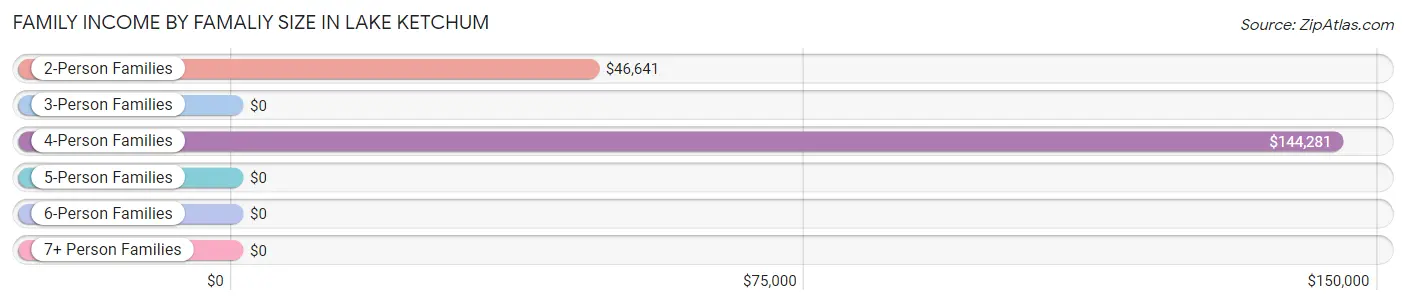
| Income Bracket | # Families | Median Income |
| 2-Person Families | 129 (32.2%) | $46,641 |
| 3-Person Families | 136 (33.9%) | $0 |
| 4-Person Families | 136 (33.9%) | $144,281 |
| 5-Person Families | 0 (0.0%) | $0 |
| 6-Person Families | 0 (0.0%) | $0 |
| 7+ Person Families | 0 (0.0%) | $0 |
| Total | 401 (100.0%) | $93,203 |
Family Income by Number of Earners in Lake Ketchum
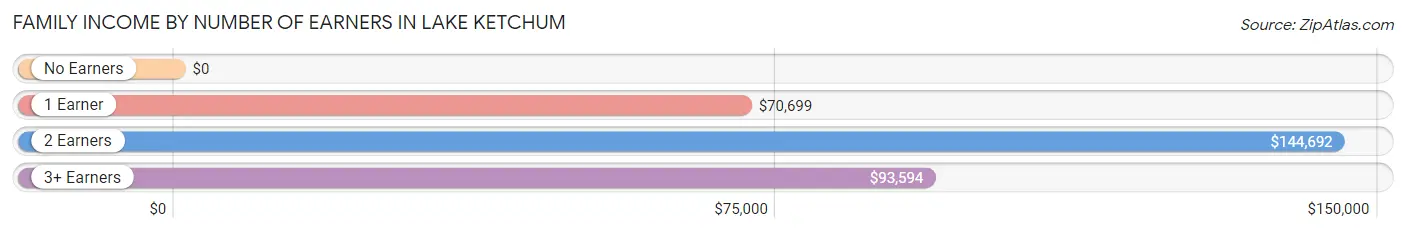
| Number of Earners | # Families | Median Income |
| No Earners | 68 (17.0%) | $0 |
| 1 Earner | 121 (30.2%) | $70,699 |
| 2 Earners | 162 (40.4%) | $144,692 |
| 3+ Earners | 50 (12.5%) | $93,594 |
| Total | 401 (100.0%) | $93,203 |
Household Income in Lake Ketchum
Household Income Brackets in Lake Ketchum
With 97 households falling in the category, the $50,000 to $74,999 income range is the most frequent in Lake Ketchum, accounting for 22.4% of all households.
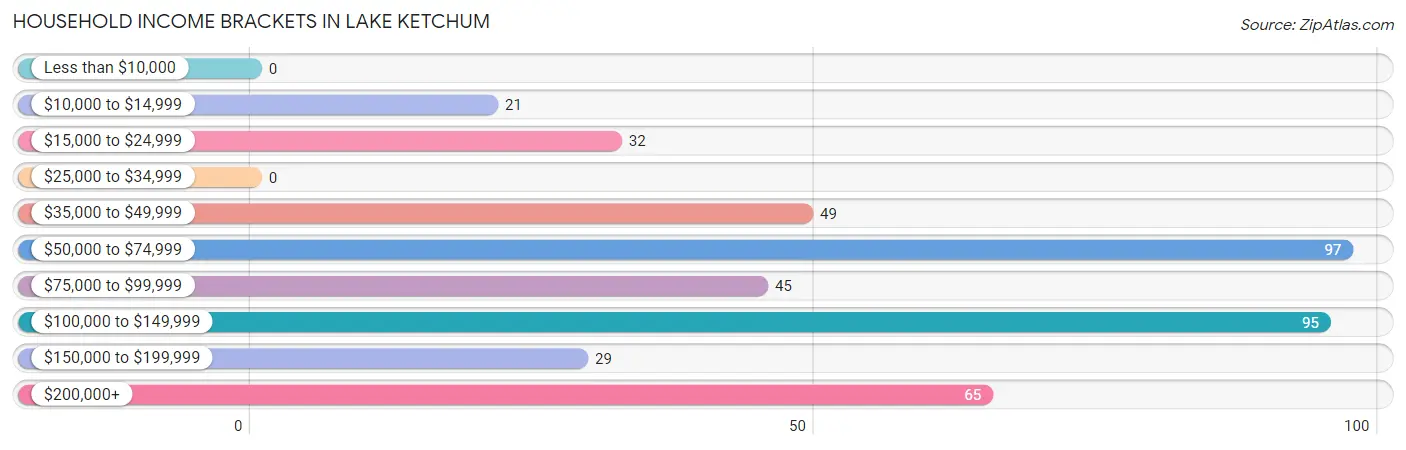
| Income Bracket | # Households | % Households |
| Less than $10,000 | 0 | 0.0% |
| $10,000 to $14,999 | 21 | 4.8% |
| $15,000 to $24,999 | 32 | 7.4% |
| $25,000 to $34,999 | 0 | 0.0% |
| $35,000 to $49,999 | 49 | 11.3% |
| $50,000 to $74,999 | 97 | 22.4% |
| $75,000 to $99,999 | 45 | 10.4% |
| $100,000 to $149,999 | 95 | 21.9% |
| $150,000 to $199,999 | 29 | 6.7% |
| $200,000+ | 65 | 15.0% |
Household Income by Householder Age in Lake Ketchum
The median household income in Lake Ketchum is $82,431, with the highest median household income of $143,322 found in the 45 to 64 years age bracket for the primary householder. A total of 166 households (38.3%) fall into this category.
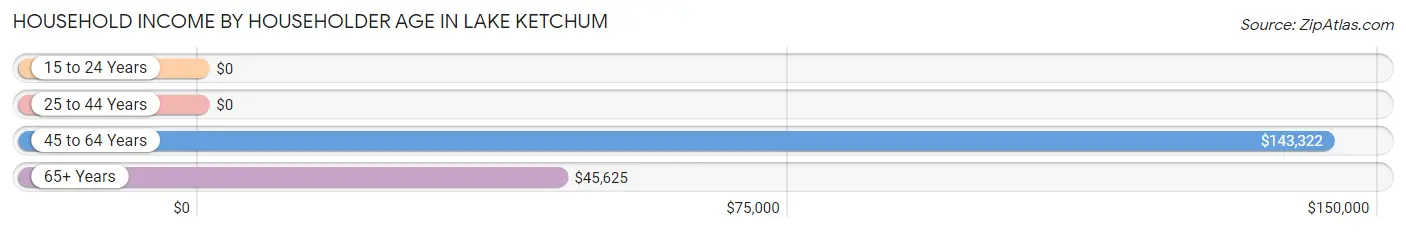
| Income Bracket | # Households | Median Income |
| 15 to 24 Years | 0 (0.0%) | $0 |
| 25 to 44 Years | 135 (31.2%) | $0 |
| 45 to 64 Years | 166 (38.3%) | $143,322 |
| 65+ Years | 132 (30.5%) | $45,625 |
| Total | 433 (100.0%) | $82,431 |
Poverty in Lake Ketchum
Income Below Poverty by Sex and Age in Lake Ketchum
With 7.7% poverty level for males and 13.8% for females among the residents of Lake Ketchum, 16 and 17 year old males and 75 year old and over females are the most vulnerable to poverty, with 22 males (100.0%) and 21 females (100.0%) in their respective age groups living below the poverty level.
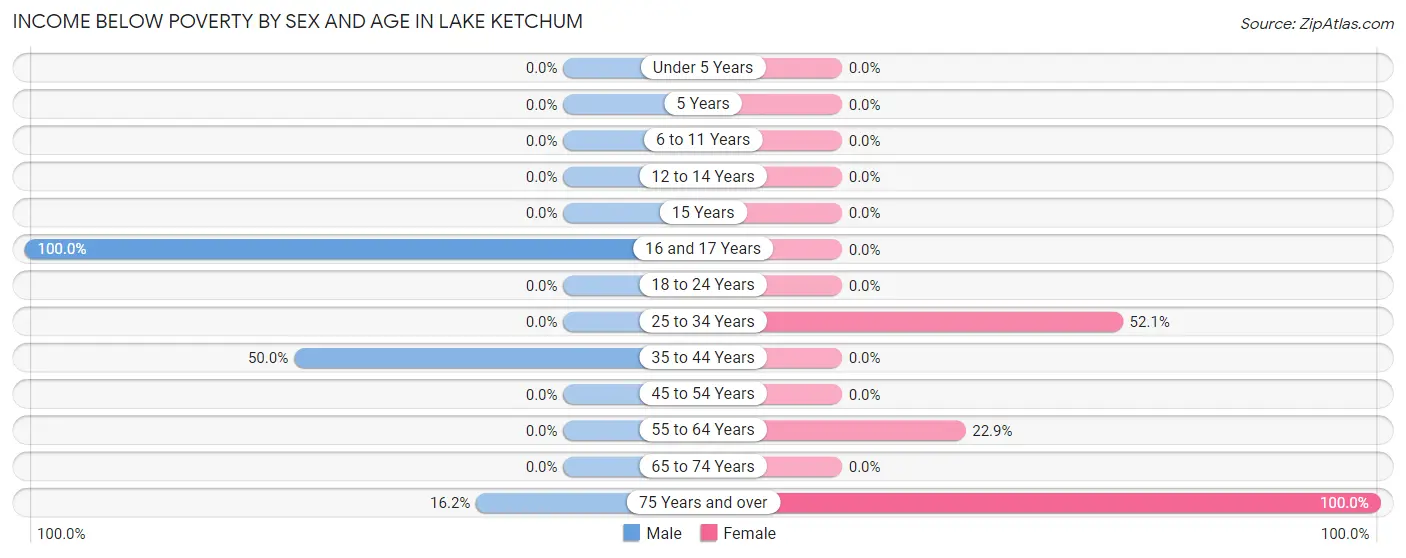
| Age Bracket | Male | Female |
| Under 5 Years | 0 (0.0%) | 0 (0.0%) |
| 5 Years | 0 (0.0%) | 0 (0.0%) |
| 6 to 11 Years | 0 (0.0%) | 0 (0.0%) |
| 12 to 14 Years | 0 (0.0%) | 0 (0.0%) |
| 15 Years | 0 (0.0%) | 0 (0.0%) |
| 16 and 17 Years | 22 (100.0%) | 0 (0.0%) |
| 18 to 24 Years | 0 (0.0%) | 0 (0.0%) |
| 25 to 34 Years | 0 (0.0%) | 49 (52.1%) |
| 35 to 44 Years | 13 (50.0%) | 0 (0.0%) |
| 45 to 54 Years | 0 (0.0%) | 0 (0.0%) |
| 55 to 64 Years | 0 (0.0%) | 22 (22.9%) |
| 65 to 74 Years | 0 (0.0%) | 0 (0.0%) |
| 75 Years and over | 22 (16.2%) | 21 (100.0%) |
| Total | 57 (7.7%) | 92 (13.8%) |
Income Above Poverty by Sex and Age in Lake Ketchum
According to the poverty statistics in Lake Ketchum, males aged under 5 years and females aged under 5 years are the age groups that are most secure financially, with 100.0% of males and 100.0% of females in these age groups living above the poverty line.
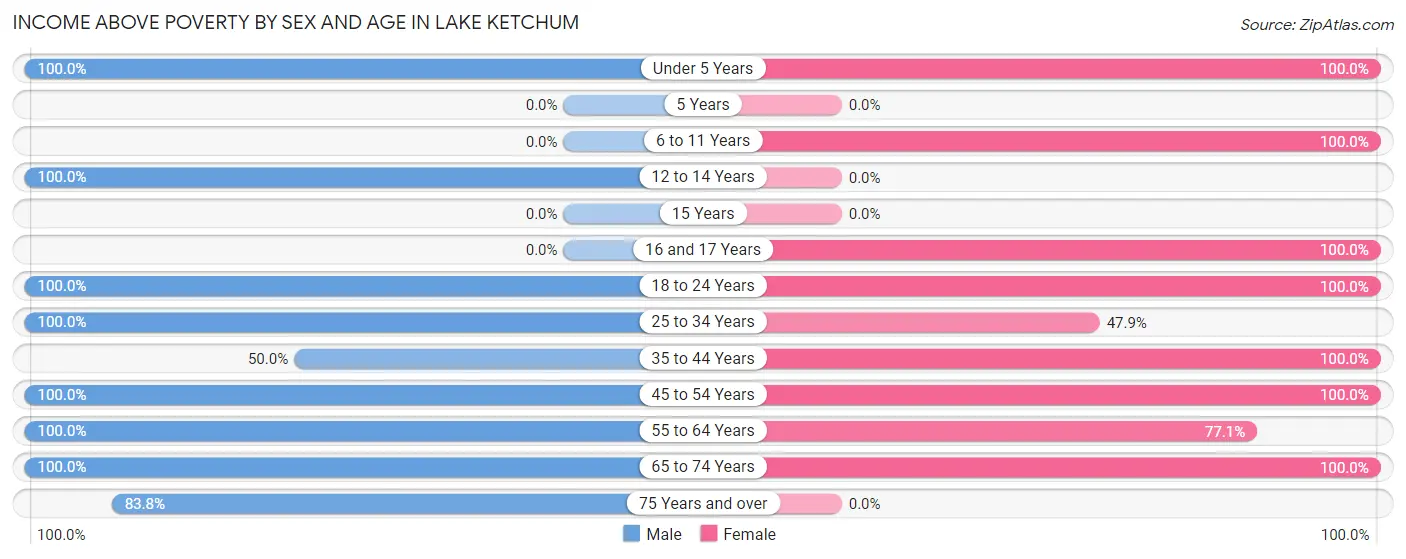
| Age Bracket | Male | Female |
| Under 5 Years | 89 (100.0%) | 52 (100.0%) |
| 5 Years | 0 (0.0%) | 0 (0.0%) |
| 6 to 11 Years | 0 (0.0%) | 91 (100.0%) |
| 12 to 14 Years | 19 (100.0%) | 0 (0.0%) |
| 15 Years | 0 (0.0%) | 0 (0.0%) |
| 16 and 17 Years | 0 (0.0%) | 23 (100.0%) |
| 18 to 24 Years | 21 (100.0%) | 60 (100.0%) |
| 25 to 34 Years | 126 (100.0%) | 45 (47.9%) |
| 35 to 44 Years | 13 (50.0%) | 42 (100.0%) |
| 45 to 54 Years | 95 (100.0%) | 107 (100.0%) |
| 55 to 64 Years | 88 (100.0%) | 74 (77.1%) |
| 65 to 74 Years | 114 (100.0%) | 80 (100.0%) |
| 75 Years and over | 114 (83.8%) | 0 (0.0%) |
| Total | 679 (92.3%) | 574 (86.2%) |
Income Below Poverty Among Married-Couple Families in Lake Ketchum
The poverty statistics for married-couple families in Lake Ketchum show that 6.5% or 21 of the total 323 families live below the poverty line. Families with no children have the highest poverty rate of 10.1%, comprising of 21 families. On the other hand, families with 1 or 2 children have the lowest poverty rate of 0.0%, which includes 0 families.
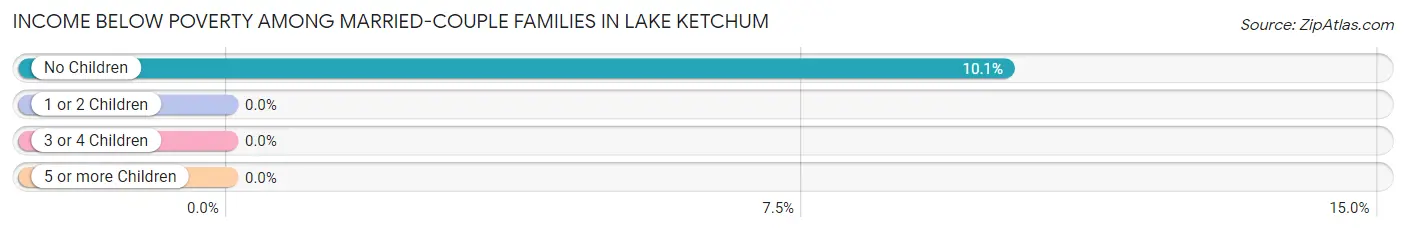
| Children | Above Poverty | Below Poverty |
| No Children | 186 (89.9%) | 21 (10.1%) |
| 1 or 2 Children | 116 (100.0%) | 0 (0.0%) |
| 3 or 4 Children | 0 (0.0%) | 0 (0.0%) |
| 5 or more Children | 0 (0.0%) | 0 (0.0%) |
| Total | 302 (93.5%) | 21 (6.5%) |
Income Below Poverty Among Single-Parent Households in Lake Ketchum
| Children | Single Father | Single Mother |
| No Children | 0 (0.0%) | 0 (0.0%) |
| 1 or 2 Children | 0 (0.0%) | 0 (0.0%) |
| 3 or 4 Children | 0 (0.0%) | 0 (0.0%) |
| 5 or more Children | 0 (0.0%) | 0 (0.0%) |
| Total | 0 (0.0%) | 0 (0.0%) |
Income Below Poverty Among Married-Couple vs Single-Parent Households in Lake Ketchum
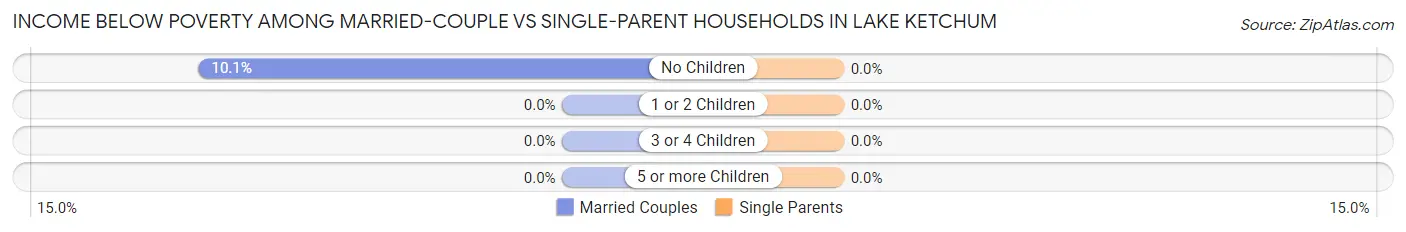
| Children | Married-Couple Families | Single-Parent Households |
| No Children | 21 (10.1%) | 0 (0.0%) |
| 1 or 2 Children | 0 (0.0%) | 0 (0.0%) |
| 3 or 4 Children | 0 (0.0%) | 0 (0.0%) |
| 5 or more Children | 0 (0.0%) | 0 (0.0%) |
| Total | 21 (6.5%) | 0 (0.0%) |
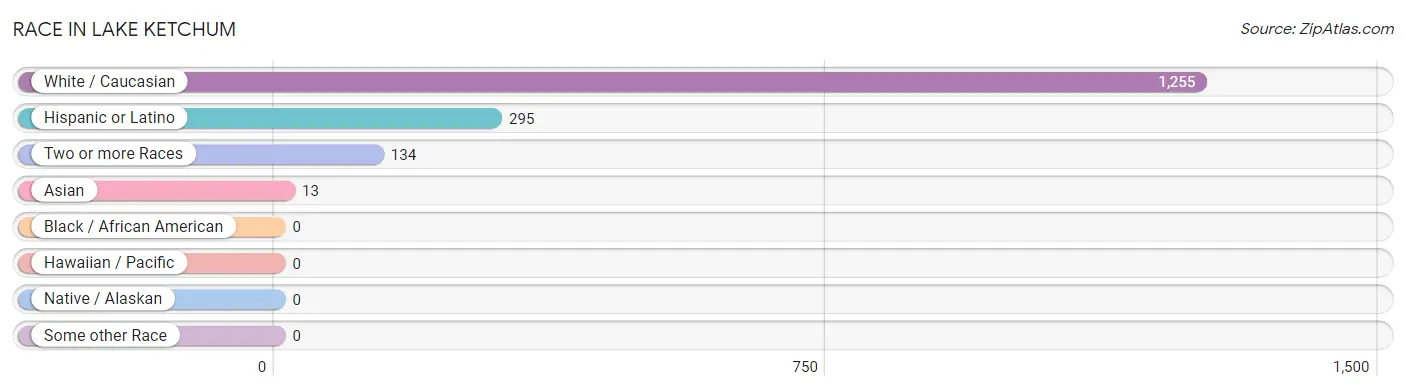
Race in Lake Ketchum
The most populous races in Lake Ketchum are White / Caucasian (1,255 | 89.5%), Hispanic or Latino (295 | 21.0%), and Two or more Races (134 | 9.6%).
| Race | # Population | % Population |
| Asian | 13 | 0.9% |
| Black / African American | 0 | 0.0% |
| Hawaiian / Pacific | 0 | 0.0% |
| Hispanic or Latino | 295 | 21.0% |
| Native / Alaskan | 0 | 0.0% |
| White / Caucasian | 1,255 | 89.5% |
| Two or more Races | 134 | 9.6% |
| Some other Race | 0 | 0.0% |
| Total | 1,402 | 100.0% |
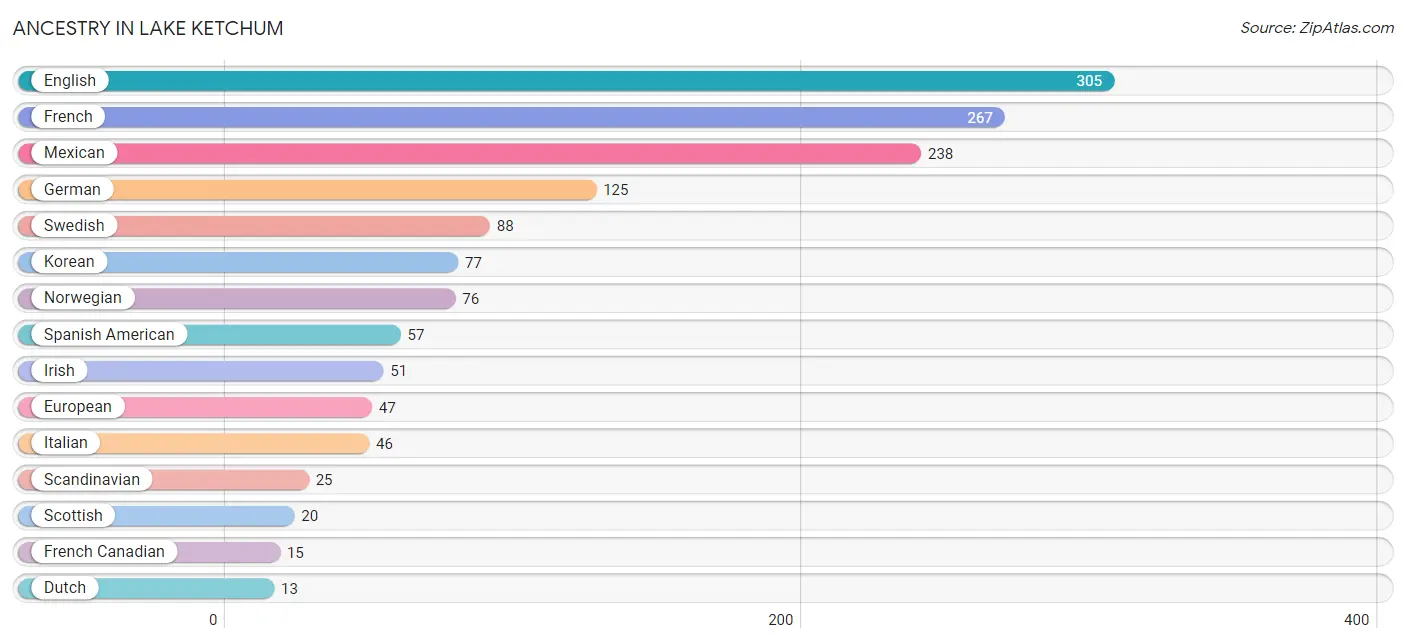
Ancestry in Lake Ketchum
The most populous ancestries reported in Lake Ketchum are English (305 | 21.7%), French (267 | 19.0%), Mexican (238 | 17.0%), German (125 | 8.9%), and Swedish (88 | 6.3%), together accounting for 73.0% of all Lake Ketchum residents.
| Ancestry | # Population | % Population |
| Dutch | 13 | 0.9% |
| English | 305 | 21.7% |
| European | 47 | 3.4% |
| French | 267 | 19.0% |
| French Canadian | 15 | 1.1% |
| German | 125 | 8.9% |
| Irish | 51 | 3.6% |
| Italian | 46 | 3.3% |
| Korean | 77 | 5.5% |
| Mexican | 238 | 17.0% |
| Norwegian | 76 | 5.4% |
| Scandinavian | 25 | 1.8% |
| Scotch-Irish | 12 | 0.9% |
| Scottish | 20 | 1.4% |
| Spanish American | 57 | 4.1% |
| Swedish | 88 | 6.3% |
| Thai | 13 | 0.9% | View All 17 Rows |
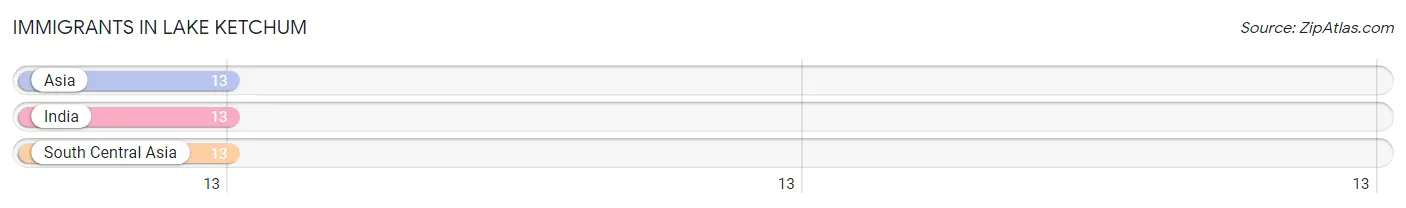
Immigrants in Lake Ketchum
The most numerous immigrant groups reported in Lake Ketchum came from Asia (13 | 0.9%), India (13 | 0.9%), and South Central Asia (13 | 0.9%), together accounting for 2.8% of all Lake Ketchum residents.
| Immigration Origin | # Population | % Population |
| Asia | 13 | 0.9% |
| India | 13 | 0.9% |
| South Central Asia | 13 | 0.9% | View All 3 Rows |
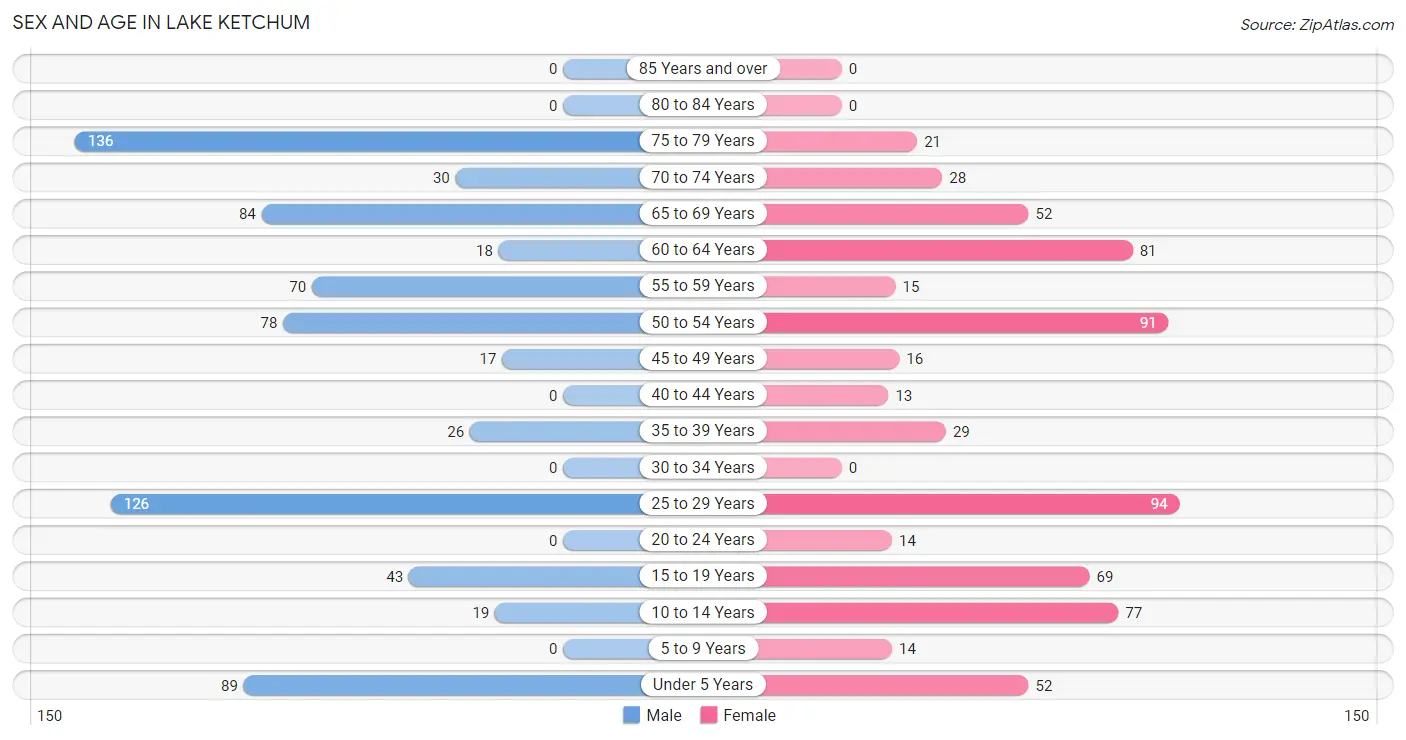
Sex and Age in Lake Ketchum
Sex and Age in Lake Ketchum
The most populous age groups in Lake Ketchum are 75 to 79 Years (136 | 18.5%) for men and 25 to 29 Years (94 | 14.1%) for women.
| Age Bracket | Male | Female |
| Under 5 Years | 89 (12.1%) | 52 (7.8%) |
| 5 to 9 Years | 0 (0.0%) | 14 (2.1%) |
| 10 to 14 Years | 19 (2.6%) | 77 (11.6%) |
| 15 to 19 Years | 43 (5.8%) | 69 (10.4%) |
| 20 to 24 Years | 0 (0.0%) | 14 (2.1%) |
| 25 to 29 Years | 126 (17.1%) | 94 (14.1%) |
| 30 to 34 Years | 0 (0.0%) | 0 (0.0%) |
| 35 to 39 Years | 26 (3.5%) | 29 (4.3%) |
| 40 to 44 Years | 0 (0.0%) | 13 (1.9%) |
| 45 to 49 Years | 17 (2.3%) | 16 (2.4%) |
| 50 to 54 Years | 78 (10.6%) | 91 (13.7%) |
| 55 to 59 Years | 70 (9.5%) | 15 (2.2%) |
| 60 to 64 Years | 18 (2.5%) | 81 (12.2%) |
| 65 to 69 Years | 84 (11.4%) | 52 (7.8%) |
| 70 to 74 Years | 30 (4.1%) | 28 (4.2%) |
| 75 to 79 Years | 136 (18.5%) | 21 (3.2%) |
| 80 to 84 Years | 0 (0.0%) | 0 (0.0%) |
| 85 Years and over | 0 (0.0%) | 0 (0.0%) |
| Total | 736 (100.0%) | 666 (100.0%) |
Families and Households in Lake Ketchum
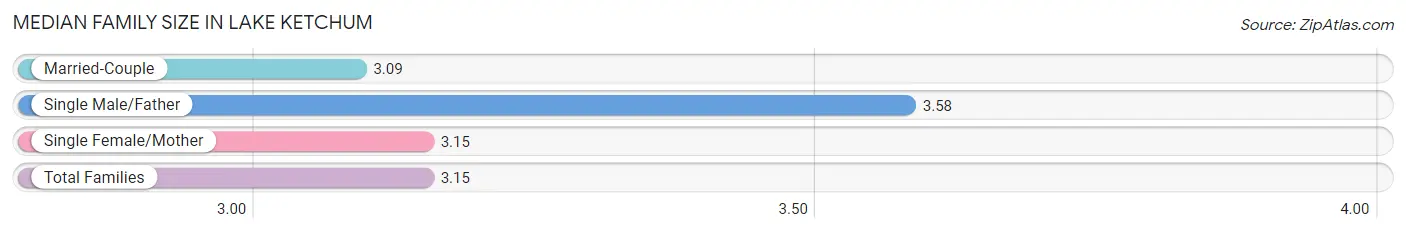
Median Family Size in Lake Ketchum
The median family size in Lake Ketchum is 3.15 persons per family, with single male/father families (45 | 11.2%) accounting for the largest median family size of 3.58 persons per family. On the other hand, married-couple families (323 | 80.5%) represent the smallest median family size with 3.09 persons per family.
| Family Type | # Families | Family Size |
| Married-Couple | 323 (80.5%) | 3.09 |
| Single Male/Father | 45 (11.2%) | 3.58 |
| Single Female/Mother | 33 (8.2%) | 3.15 |
| Total Families | 401 (100.0%) | 3.15 |
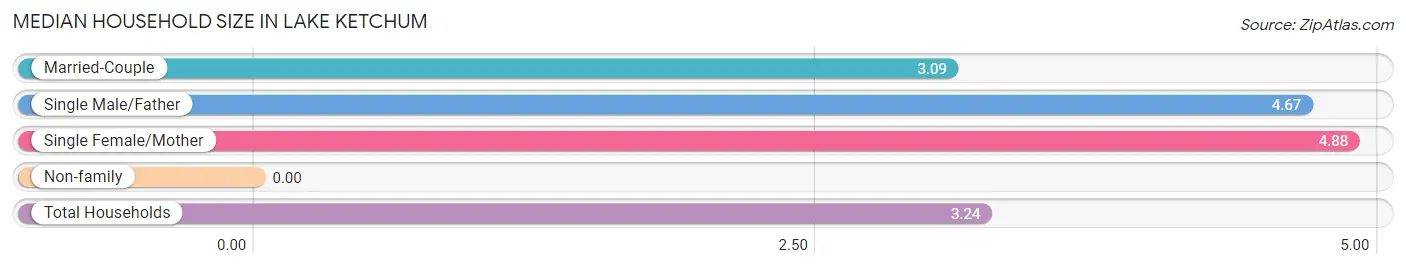
Median Household Size in Lake Ketchum
| Household Type | # Households | Household Size |
| Married-Couple | 323 (74.6%) | 3.09 |
| Single Male/Father | 45 (10.4%) | 4.67 |
| Single Female/Mother | 33 (7.6%) | 4.88 |
| Non-family | 32 (7.4%) | - |
| Total Households | 433 (100.0%) | 3.24 |
Household Size by Marriage Status in Lake Ketchum
Out of a total of 433 households in Lake Ketchum, 401 (92.6%) are family households, while 32 (7.4%) are nonfamily households. The most numerous type of family households are 4-person households, comprising 165, and the most common type of nonfamily households are 1-person households, comprising 32.
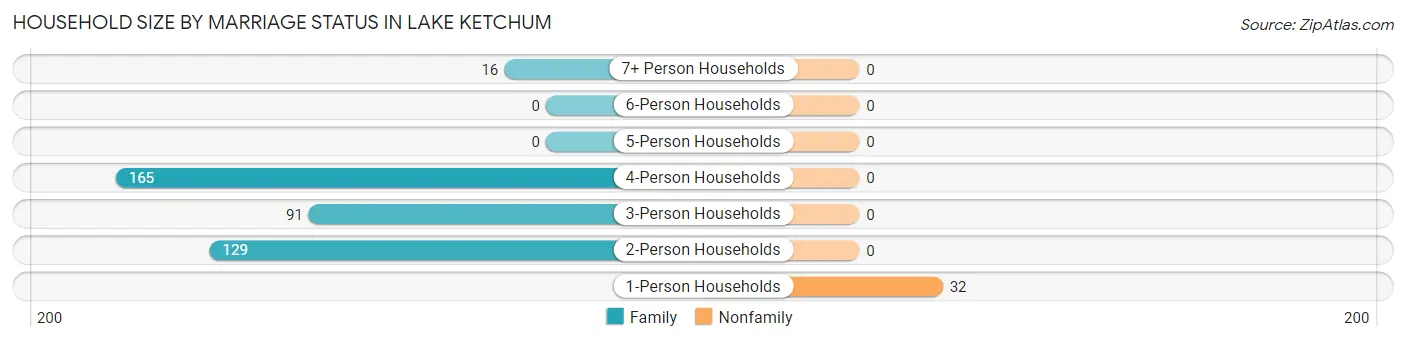
| Household Size | Family Households | Nonfamily Households |
| 1-Person Households | - | 32 (7.4%) |
| 2-Person Households | 129 (29.8%) | 0 (0.0%) |
| 3-Person Households | 91 (21.0%) | 0 (0.0%) |
| 4-Person Households | 165 (38.1%) | 0 (0.0%) |
| 5-Person Households | 0 (0.0%) | 0 (0.0%) |
| 6-Person Households | 0 (0.0%) | 0 (0.0%) |
| 7+ Person Households | 16 (3.7%) | 0 (0.0%) |
| Total | 401 (92.6%) | 32 (7.4%) |
Female Fertility in Lake Ketchum
Fertility by Age in Lake Ketchum
Average fertility rate in Lake Ketchum is 268.0 births per 1,000 women. Women in the age bracket of 20 to 34 years have the highest fertility rate with 583.0 births per 1,000 women. Women in the age bracket of 20 to 34 years acount for 100.0% of all women with births.
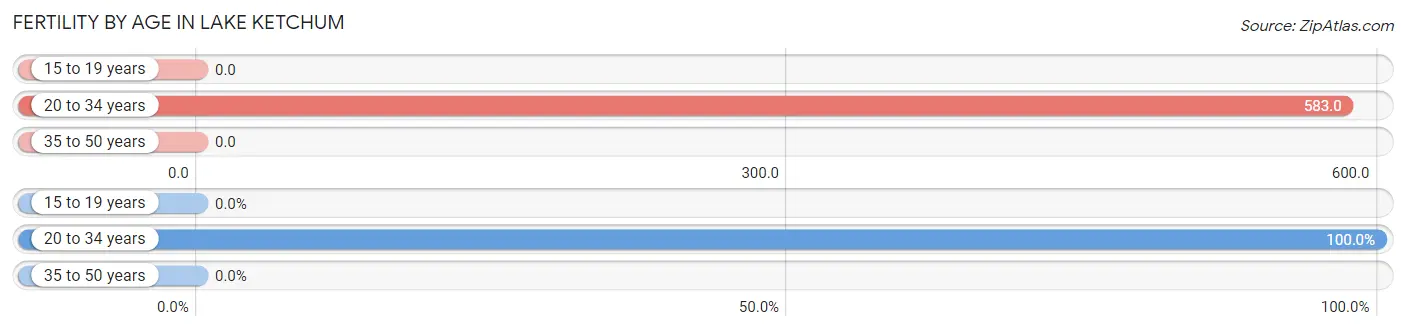
| Age Bracket | Women with Births | Births / 1,000 Women |
| 15 to 19 years | 0 (0.0%) | 0.0 |
| 20 to 34 years | 63 (100.0%) | 583.0 |
| 35 to 50 years | 0 (0.0%) | 0.0 |
| Total | 63 (100.0%) | 268.0 |
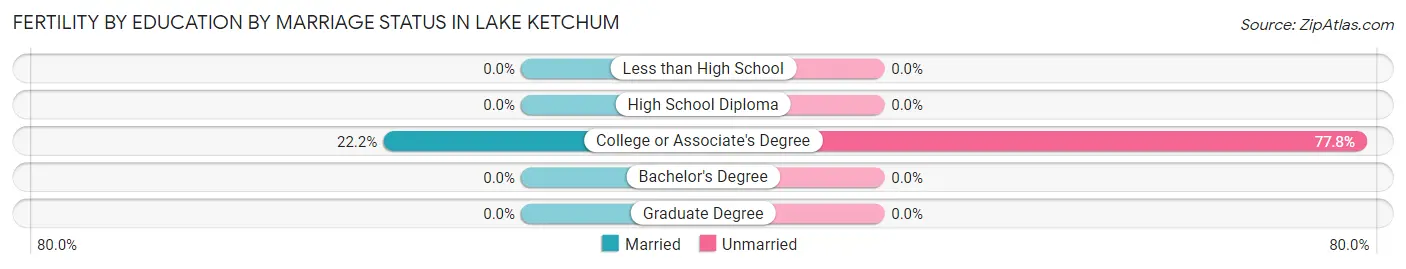
Fertility by Age by Marriage Status in Lake Ketchum
22.2% of women with births (63) in Lake Ketchum are married. The highest percentage of unmarried women with births falls into 20 to 34 years age bracket with 77.8% of them unmarried at the time of birth, while the lowest percentage of unmarried women with births belong to 20 to 34 years age bracket with 77.8% of them unmarried.
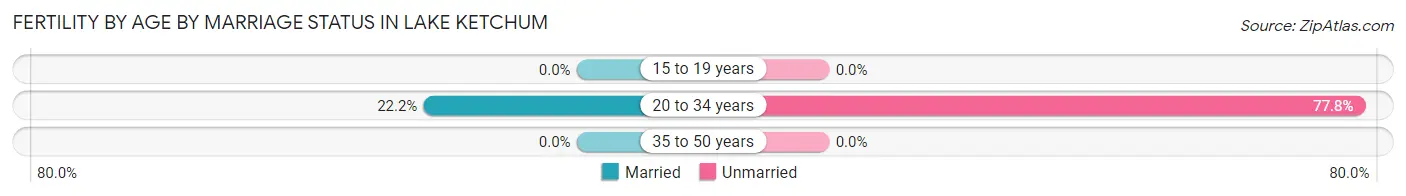
| Age Bracket | Married | Unmarried |
| 15 to 19 years | 0 (0.0%) | 0 (0.0%) |
| 20 to 34 years | 14 (22.2%) | 49 (77.8%) |
| 35 to 50 years | 0 (0.0%) | 0 (0.0%) |
| Total | 14 (22.2%) | 49 (77.8%) |
Fertility by Education in Lake Ketchum
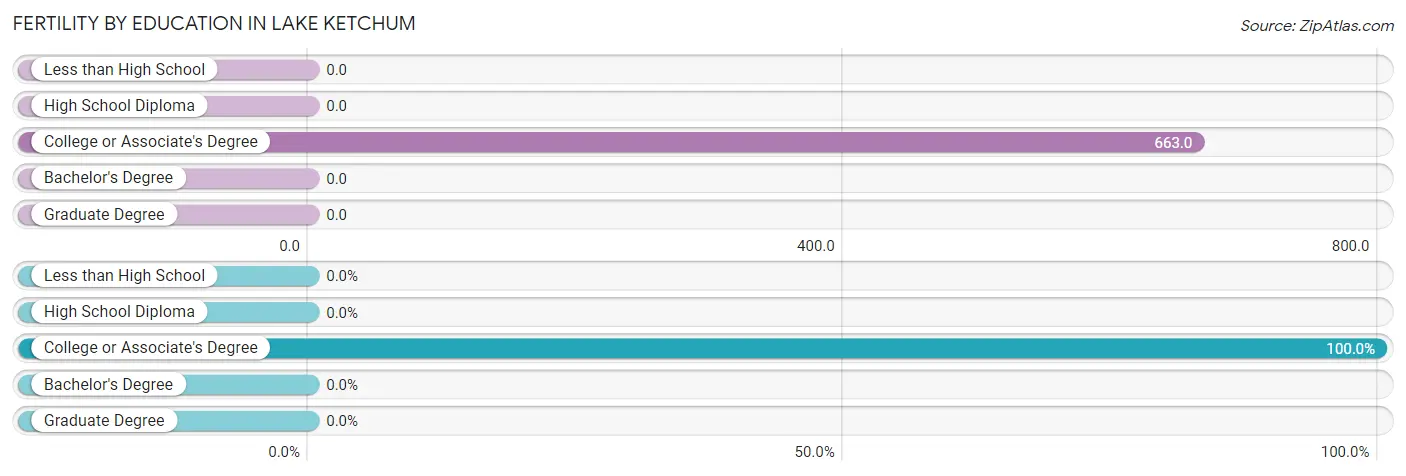
| Educational Attainment | Women with Births | Births / 1,000 Women |
| Less than High School | 0 (0.0%) | 0.0 |
| High School Diploma | 0 (0.0%) | 0.0 |
| College or Associate's Degree | 63 (100.0%) | 663.0 |
| Bachelor's Degree | 0 (0.0%) | 0.0 |
| Graduate Degree | 0 (0.0%) | 0.0 |
| Total | 63 (100.0%) | 268.0 |
Fertility by Education by Marriage Status in Lake Ketchum
77.8% of women with births in Lake Ketchum are unmarried. Women with the educational attainment of college or associate's degree are most likely to be married with 22.2% of them married at childbirth, while women with the educational attainment of college or associate's degree are least likely to be married with 77.8% of them unmarried at childbirth.
| Educational Attainment | Married | Unmarried |
| Less than High School | 0 (0.0%) | 0 (0.0%) |
| High School Diploma | 0 (0.0%) | 0 (0.0%) |
| College or Associate's Degree | 14 (22.2%) | 49 (77.8%) |
| Bachelor's Degree | 0 (0.0%) | 0 (0.0%) |
| Graduate Degree | 0 (0.0%) | 0 (0.0%) |
| Total | 14 (22.2%) | 49 (77.8%) |
Employment Characteristics in Lake Ketchum
Employment by Class of Employer in Lake Ketchum
Among the 584 employed individuals in Lake Ketchum, private company employees (407 | 69.7%), self-employed (incorporated) (51 | 8.7%), and not-for-profit organizations (47 | 8.1%) make up the most common classes of employment.
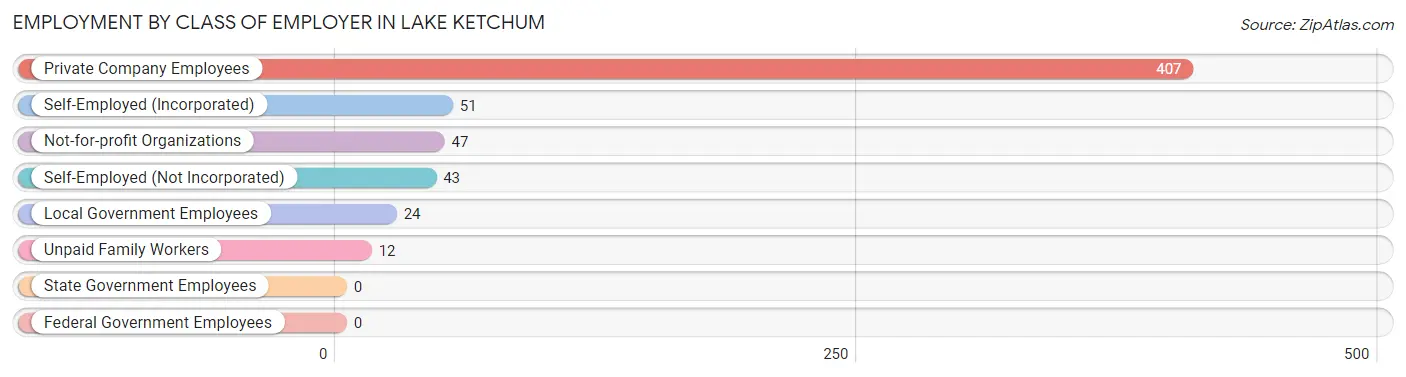
| Employer Class | # Employees | % Employees |
| Private Company Employees | 407 | 69.7% |
| Self-Employed (Incorporated) | 51 | 8.7% |
| Self-Employed (Not Incorporated) | 43 | 7.4% |
| Not-for-profit Organizations | 47 | 8.1% |
| Local Government Employees | 24 | 4.1% |
| State Government Employees | 0 | 0.0% |
| Federal Government Employees | 0 | 0.0% |
| Unpaid Family Workers | 12 | 2.1% |
| Total | 584 | 100.0% |
Employment Status by Age in Lake Ketchum
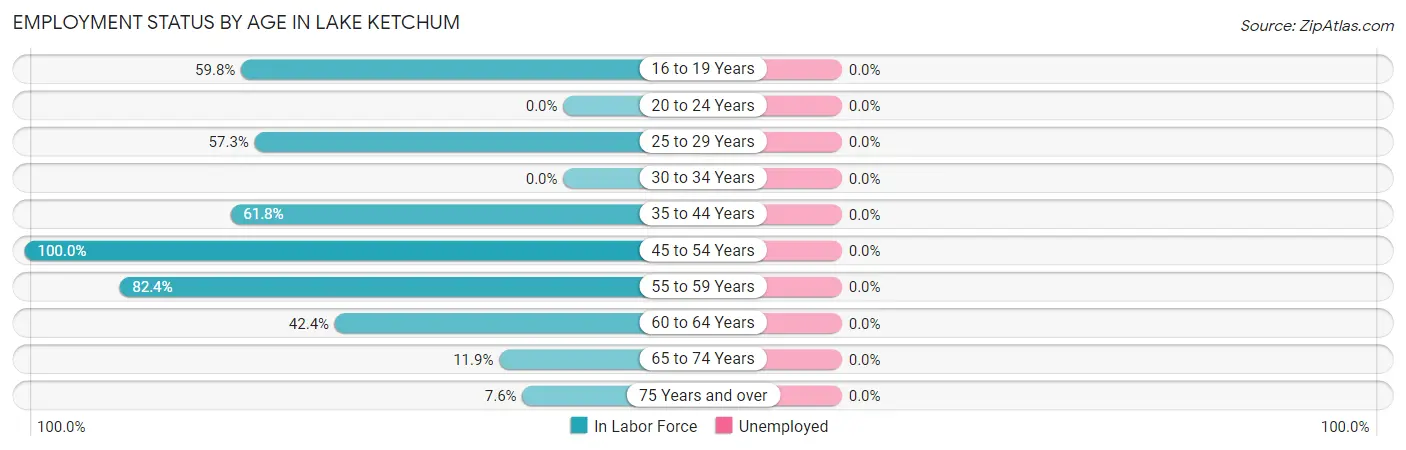
| Age Bracket | In Labor Force | Unemployed |
| 16 to 19 Years | 67 (59.8%) | 0 (0.0%) |
| 20 to 24 Years | 0 (0.0%) | 0 (0.0%) |
| 25 to 29 Years | 126 (57.3%) | 0 (0.0%) |
| 30 to 34 Years | 0 (0.0%) | 0 (0.0%) |
| 35 to 44 Years | 42 (61.8%) | 0 (0.0%) |
| 45 to 54 Years | 202 (100.0%) | 0 (0.0%) |
| 55 to 59 Years | 70 (82.4%) | 0 (0.0%) |
| 60 to 64 Years | 42 (42.4%) | 0 (0.0%) |
| 65 to 74 Years | 23 (11.9%) | 0 (0.0%) |
| 75 Years and over | 12 (7.6%) | 0 (0.0%) |
| Total | 584 (50.7%) | 0 (0.0%) |
Employment Status by Educational Attainment in Lake Ketchum
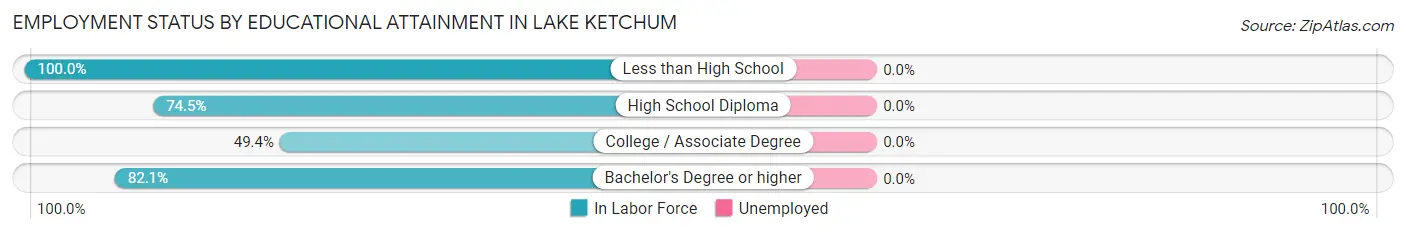
| Educational Attainment | In Labor Force | Unemployed |
| Less than High School | 38 (100.0%) | 0 (0.0%) |
| High School Diploma | 266 (74.5%) | 0 (0.0%) |
| College / Associate Degree | 77 (49.4%) | 0 (0.0%) |
| Bachelor's Degree or higher | 101 (82.1%) | 0 (0.0%) |
| Total | 482 (71.5%) | 0 (0.0%) |
Employment Occupations by Sex in Lake Ketchum
Management, Business, Science and Arts Occupations
The most common Management, Business, Science and Arts occupations in Lake Ketchum are Management (65 | 11.1%), Computers, Engineering & Science (13 | 2.2%), and Architecture & Engineering (13 | 2.2%).
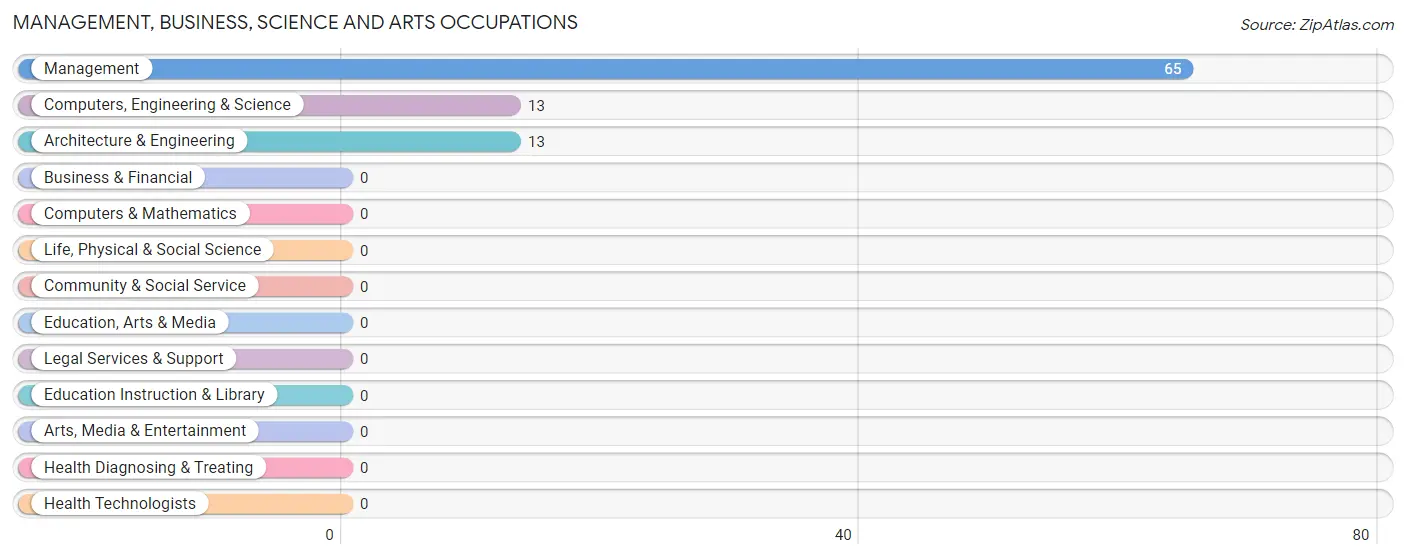
Management, Business, Science and Arts Occupations by Sex
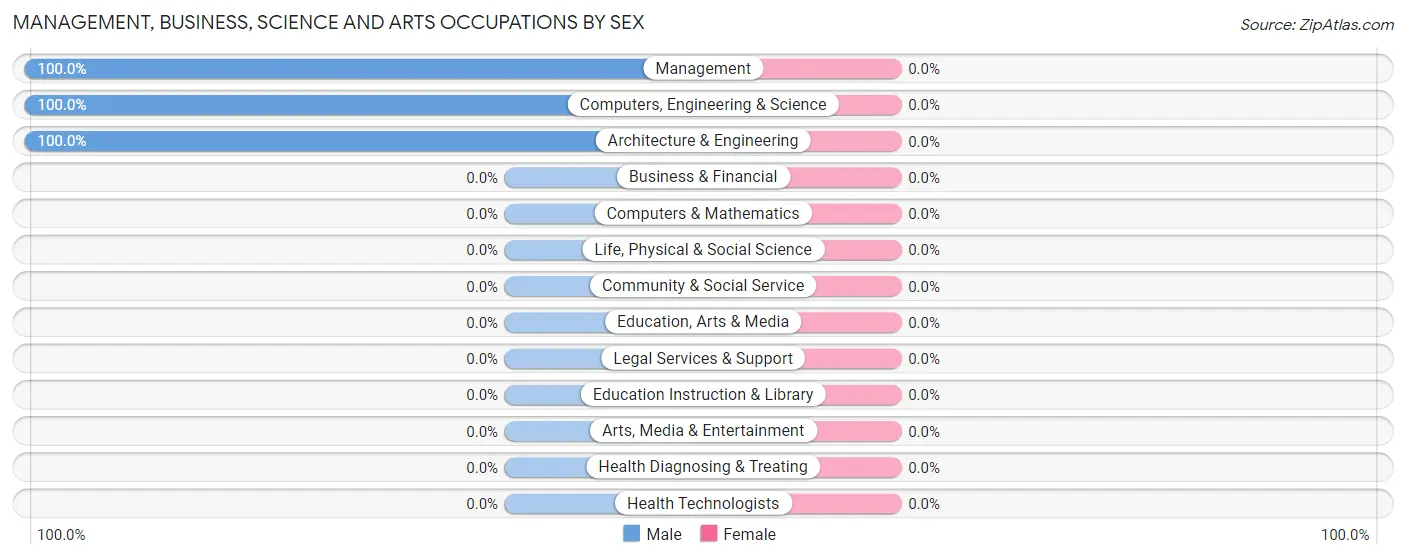
| Occupation | Male | Female |
| Management | 65 (100.0%) | 0 (0.0%) |
| Business & Financial | 0 (0.0%) | 0 (0.0%) |
| Computers, Engineering & Science | 13 (100.0%) | 0 (0.0%) |
| Computers & Mathematics | 0 (0.0%) | 0 (0.0%) |
| Architecture & Engineering | 13 (100.0%) | 0 (0.0%) |
| Life, Physical & Social Science | 0 (0.0%) | 0 (0.0%) |
| Community & Social Service | 0 (0.0%) | 0 (0.0%) |
| Education, Arts & Media | 0 (0.0%) | 0 (0.0%) |
| Legal Services & Support | 0 (0.0%) | 0 (0.0%) |
| Education Instruction & Library | 0 (0.0%) | 0 (0.0%) |
| Arts, Media & Entertainment | 0 (0.0%) | 0 (0.0%) |
| Health Diagnosing & Treating | 0 (0.0%) | 0 (0.0%) |
| Health Technologists | 0 (0.0%) | 0 (0.0%) |
| Total (Category) | 78 (100.0%) | 0 (0.0%) |
| Total (Overall) | 366 (62.7%) | 218 (37.3%) |
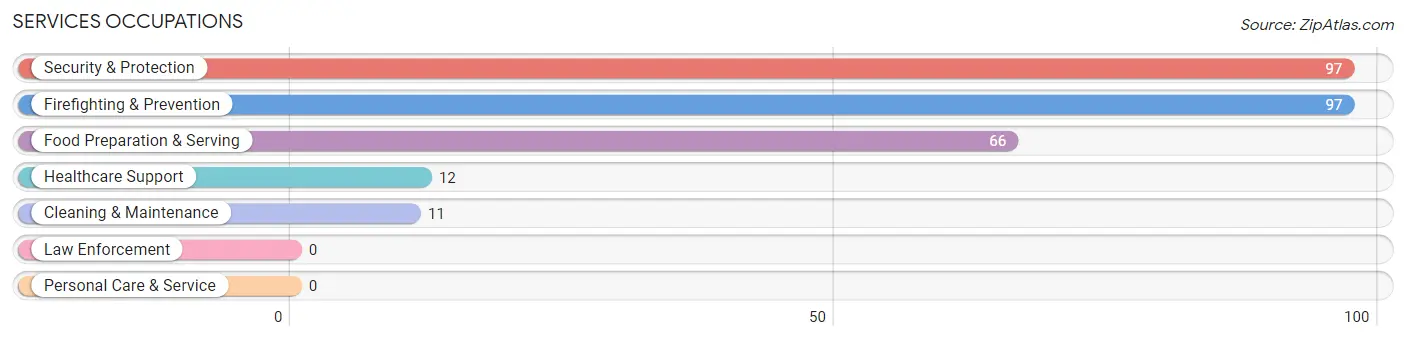
Services Occupations
The most common Services occupations in Lake Ketchum are Security & Protection (97 | 16.6%), Firefighting & Prevention (97 | 16.6%), Food Preparation & Serving (66 | 11.3%), Healthcare Support (12 | 2.1%), and Cleaning & Maintenance (11 | 1.9%).
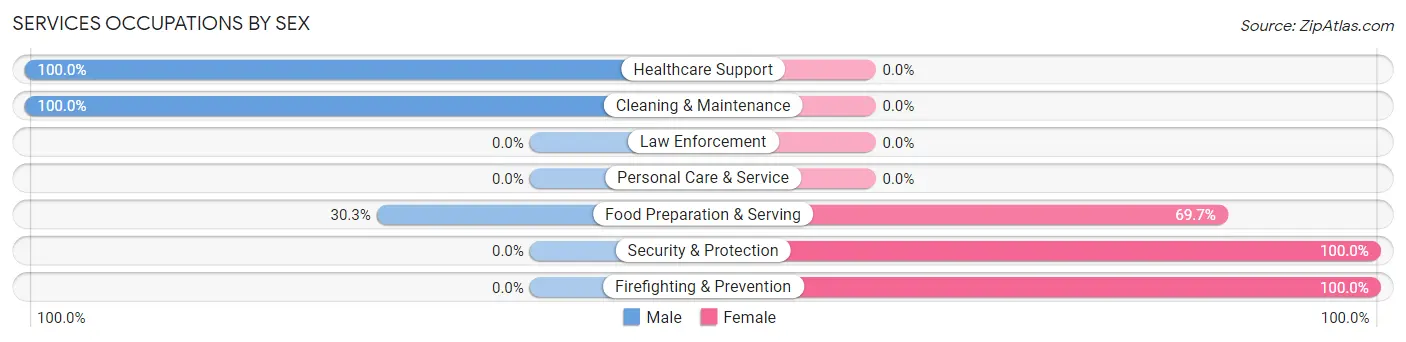
Services Occupations by Sex
Within the Services occupations in Lake Ketchum, the most male-oriented occupations are Healthcare Support (100.0%), Cleaning & Maintenance (100.0%), and Food Preparation & Serving (30.3%), while the most female-oriented occupations are Security & Protection (100.0%), Firefighting & Prevention (100.0%), and Food Preparation & Serving (69.7%).
| Occupation | Male | Female |
| Healthcare Support | 12 (100.0%) | 0 (0.0%) |
| Security & Protection | 0 (0.0%) | 97 (100.0%) |
| Firefighting & Prevention | 0 (0.0%) | 97 (100.0%) |
| Law Enforcement | 0 (0.0%) | 0 (0.0%) |
| Food Preparation & Serving | 20 (30.3%) | 46 (69.7%) |
| Cleaning & Maintenance | 11 (100.0%) | 0 (0.0%) |
| Personal Care & Service | 0 (0.0%) | 0 (0.0%) |
| Total (Category) | 43 (23.1%) | 143 (76.9%) |
| Total (Overall) | 366 (62.7%) | 218 (37.3%) |
Sales and Office Occupations
The most common Sales and Office occupations in Lake Ketchum are Sales & Related (81 | 13.9%), and Office & Administration (46 | 7.9%).
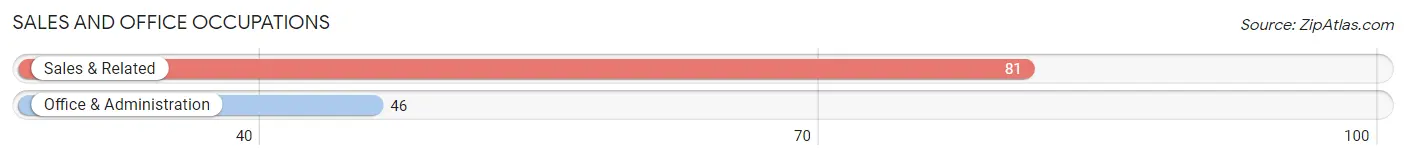
Sales and Office Occupations by Sex
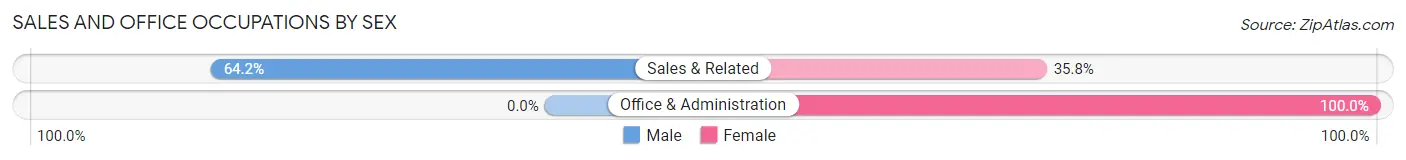
| Occupation | Male | Female |
| Sales & Related | 52 (64.2%) | 29 (35.8%) |
| Office & Administration | 0 (0.0%) | 46 (100.0%) |
| Total (Category) | 52 (40.9%) | 75 (59.1%) |
| Total (Overall) | 366 (62.7%) | 218 (37.3%) |
Natural Resources, Construction and Maintenance Occupations
The most common Natural Resources, Construction and Maintenance occupations in Lake Ketchum are , and Construction & Extraction (142 | 24.3%).
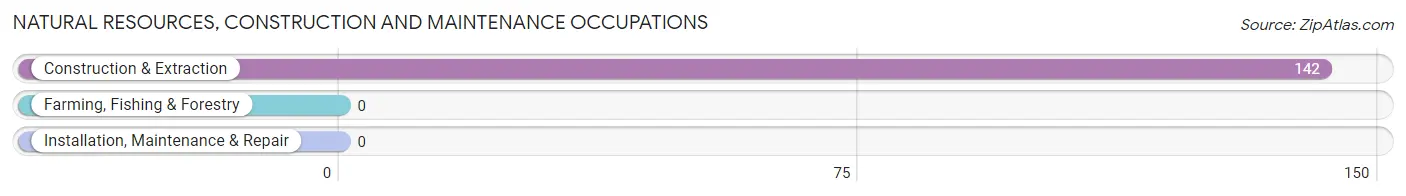
Natural Resources, Construction and Maintenance Occupations by Sex
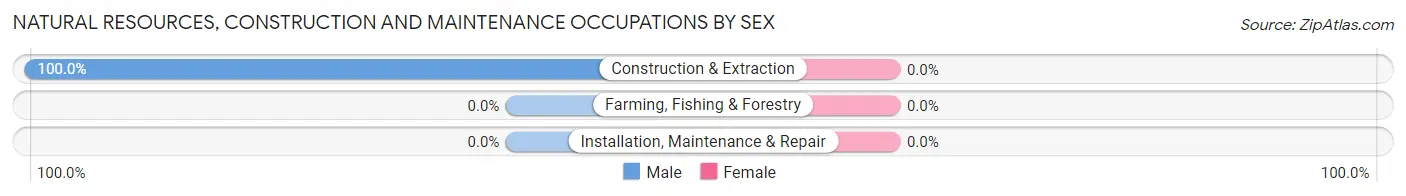
| Occupation | Male | Female |
| Farming, Fishing & Forestry | 0 (0.0%) | 0 (0.0%) |
| Construction & Extraction | 142 (100.0%) | 0 (0.0%) |
| Installation, Maintenance & Repair | 0 (0.0%) | 0 (0.0%) |
| Total (Category) | 142 (100.0%) | 0 (0.0%) |
| Total (Overall) | 366 (62.7%) | 218 (37.3%) |
Production, Transportation and Moving Occupations
The most common Production, Transportation and Moving occupations in Lake Ketchum are , and Production (51 | 8.7%).
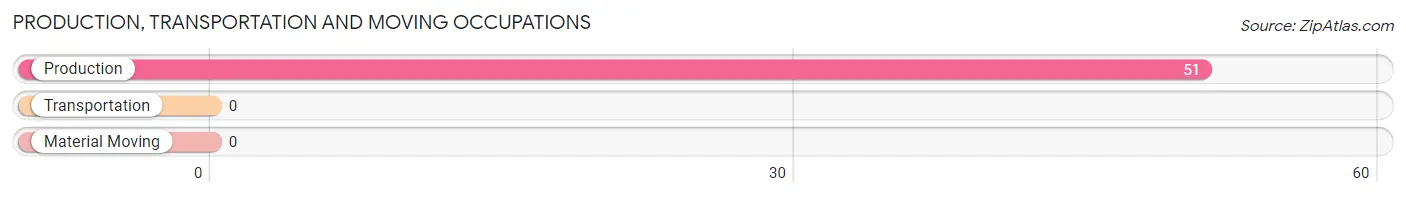
Production, Transportation and Moving Occupations by Sex
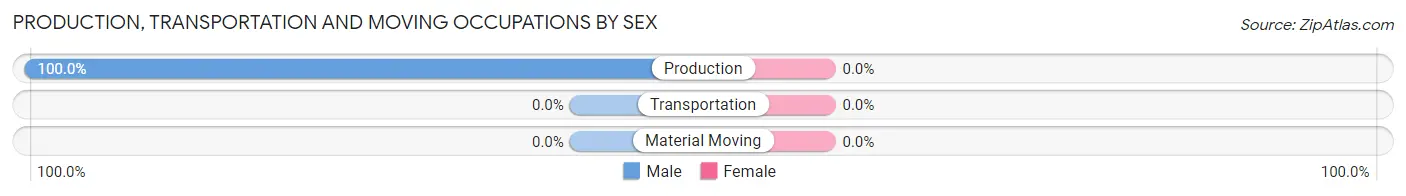
| Occupation | Male | Female |
| Production | 51 (100.0%) | 0 (0.0%) |
| Transportation | 0 (0.0%) | 0 (0.0%) |
| Material Moving | 0 (0.0%) | 0 (0.0%) |
| Total (Category) | 51 (100.0%) | 0 (0.0%) |
| Total (Overall) | 366 (62.7%) | 218 (37.3%) |
Employment Industries by Sex in Lake Ketchum
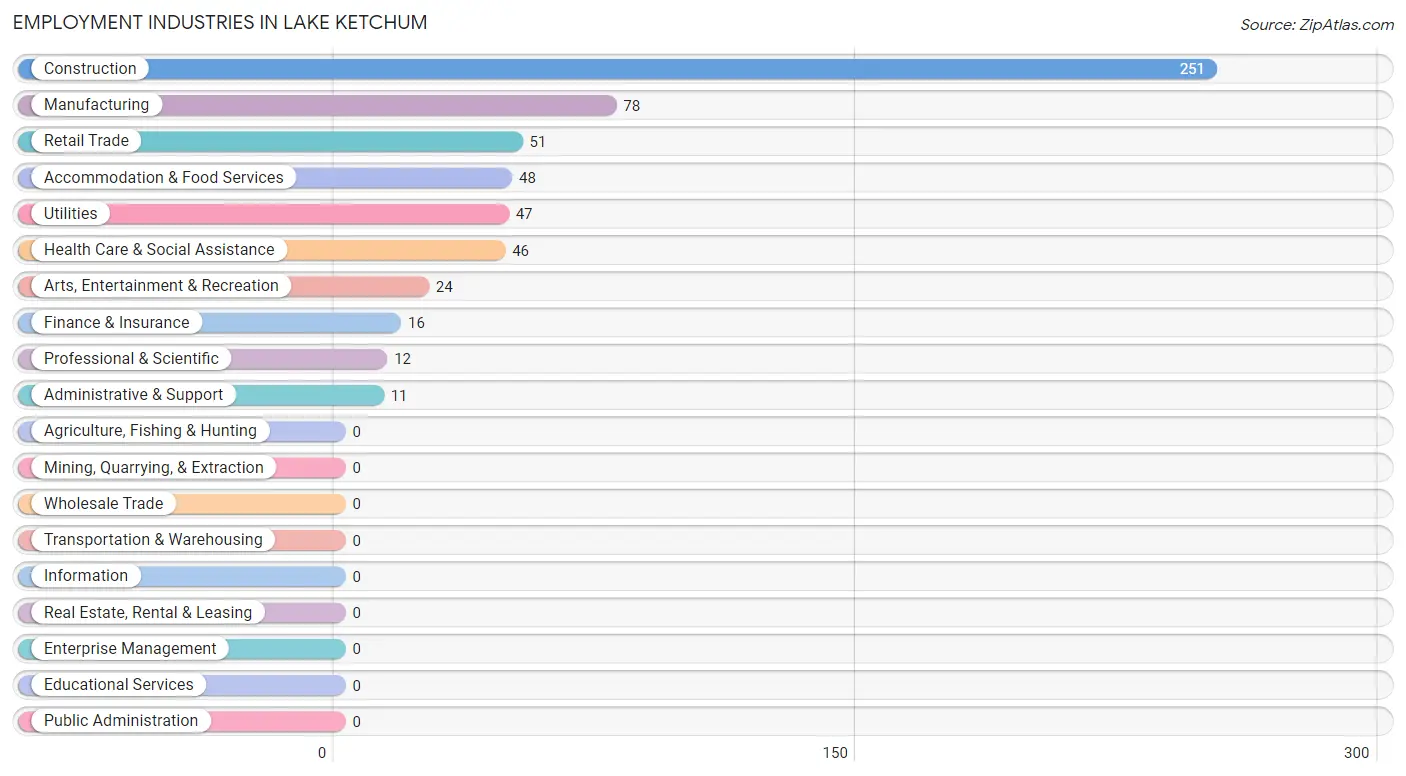
Employment Industries in Lake Ketchum
The major employment industries in Lake Ketchum include Construction (251 | 43.0%), Manufacturing (78 | 13.4%), Retail Trade (51 | 8.7%), Accommodation & Food Services (48 | 8.2%), and Utilities (47 | 8.1%).
Employment Industries by Sex in Lake Ketchum
The Lake Ketchum industries that see more men than women are Manufacturing (100.0%), Utilities (100.0%), and Administrative & Support (100.0%), whereas the industries that tend to have a higher number of women are Finance & Insurance (100.0%), Professional & Scientific (100.0%), and Arts, Entertainment & Recreation (100.0%).
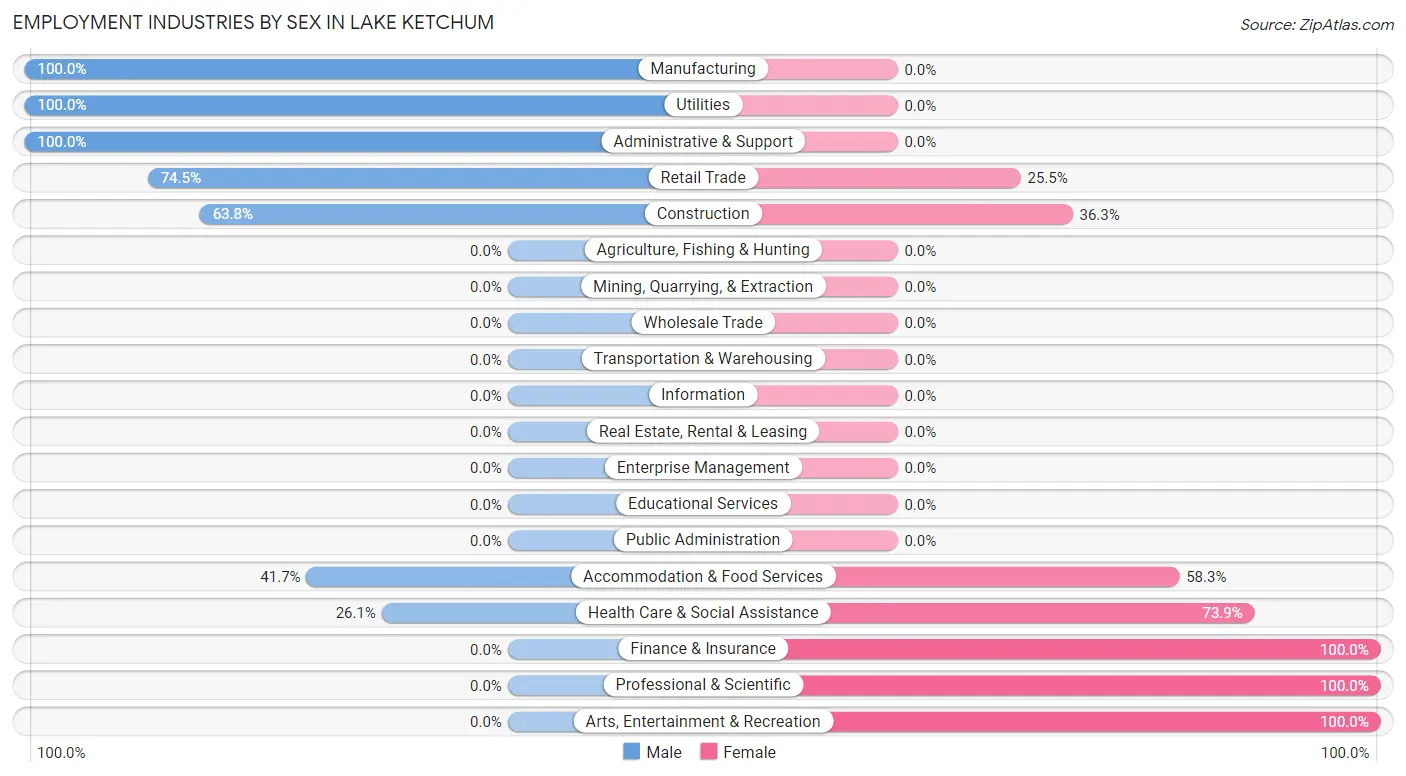
| Industry | Male | Female |
| Agriculture, Fishing & Hunting | 0 (0.0%) | 0 (0.0%) |
| Mining, Quarrying, & Extraction | 0 (0.0%) | 0 (0.0%) |
| Construction | 160 (63.7%) | 91 (36.2%) |
| Manufacturing | 78 (100.0%) | 0 (0.0%) |
| Wholesale Trade | 0 (0.0%) | 0 (0.0%) |
| Retail Trade | 38 (74.5%) | 13 (25.5%) |
| Transportation & Warehousing | 0 (0.0%) | 0 (0.0%) |
| Utilities | 47 (100.0%) | 0 (0.0%) |
| Information | 0 (0.0%) | 0 (0.0%) |
| Finance & Insurance | 0 (0.0%) | 16 (100.0%) |
| Real Estate, Rental & Leasing | 0 (0.0%) | 0 (0.0%) |
| Professional & Scientific | 0 (0.0%) | 12 (100.0%) |
| Enterprise Management | 0 (0.0%) | 0 (0.0%) |
| Administrative & Support | 11 (100.0%) | 0 (0.0%) |
| Educational Services | 0 (0.0%) | 0 (0.0%) |
| Health Care & Social Assistance | 12 (26.1%) | 34 (73.9%) |
| Arts, Entertainment & Recreation | 0 (0.0%) | 24 (100.0%) |
| Accommodation & Food Services | 20 (41.7%) | 28 (58.3%) |
| Public Administration | 0 (0.0%) | 0 (0.0%) |
| Total | 366 (62.7%) | 218 (37.3%) |
Education in Lake Ketchum
School Enrollment in Lake Ketchum
The most common levels of schooling among the 226 students in Lake Ketchum are middle school (77 | 34.1%), high school (64 | 28.3%), and college / undergraduate (58 | 25.7%).
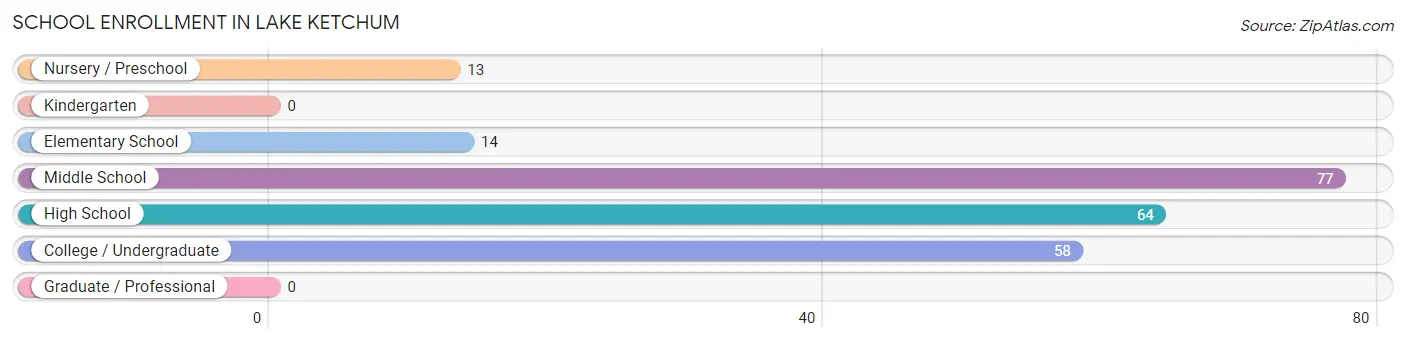
| School Level | # Students | % Students |
| Nursery / Preschool | 13 | 5.8% |
| Kindergarten | 0 | 0.0% |
| Elementary School | 14 | 6.2% |
| Middle School | 77 | 34.1% |
| High School | 64 | 28.3% |
| College / Undergraduate | 58 | 25.7% |
| Graduate / Professional | 0 | 0.0% |
| Total | 226 | 100.0% |
School Enrollment by Age by Funding Source in Lake Ketchum
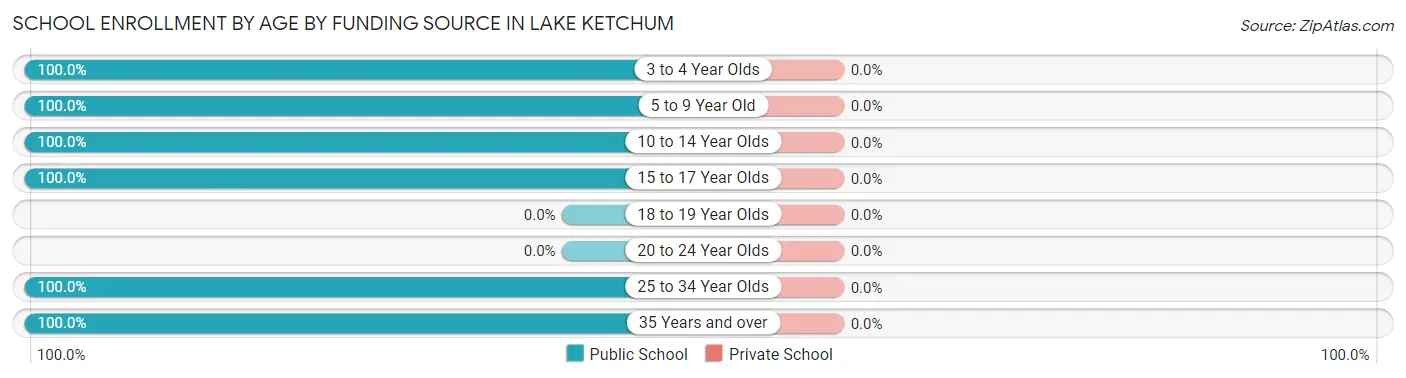
| Age Bracket | Public School | Private School |
| 3 to 4 Year Olds | 13 (100.0%) | 0 (0.0%) |
| 5 to 9 Year Old | 14 (100.0%) | 0 (0.0%) |
| 10 to 14 Year Olds | 96 (100.0%) | 0 (0.0%) |
| 15 to 17 Year Olds | 45 (100.0%) | 0 (0.0%) |
| 18 to 19 Year Olds | 0 (0.0%) | 0 (0.0%) |
| 20 to 24 Year Olds | 0 (0.0%) | 0 (0.0%) |
| 25 to 34 Year Olds | 45 (100.0%) | 0 (0.0%) |
| 35 Years and over | 13 (100.0%) | 0 (0.0%) |
| Total | 226 (100.0%) | 0 (0.0%) |
Educational Attainment by Field of Study in Lake Ketchum
Visual & performing arts (97 | 48.5%), arts & humanities (24 | 12.0%), literature & languages (22 | 11.0%), liberal arts & history (22 | 11.0%), and engineering (13 | 6.5%) are the most common fields of study among 200 individuals in Lake Ketchum who have obtained a bachelor's degree or higher.
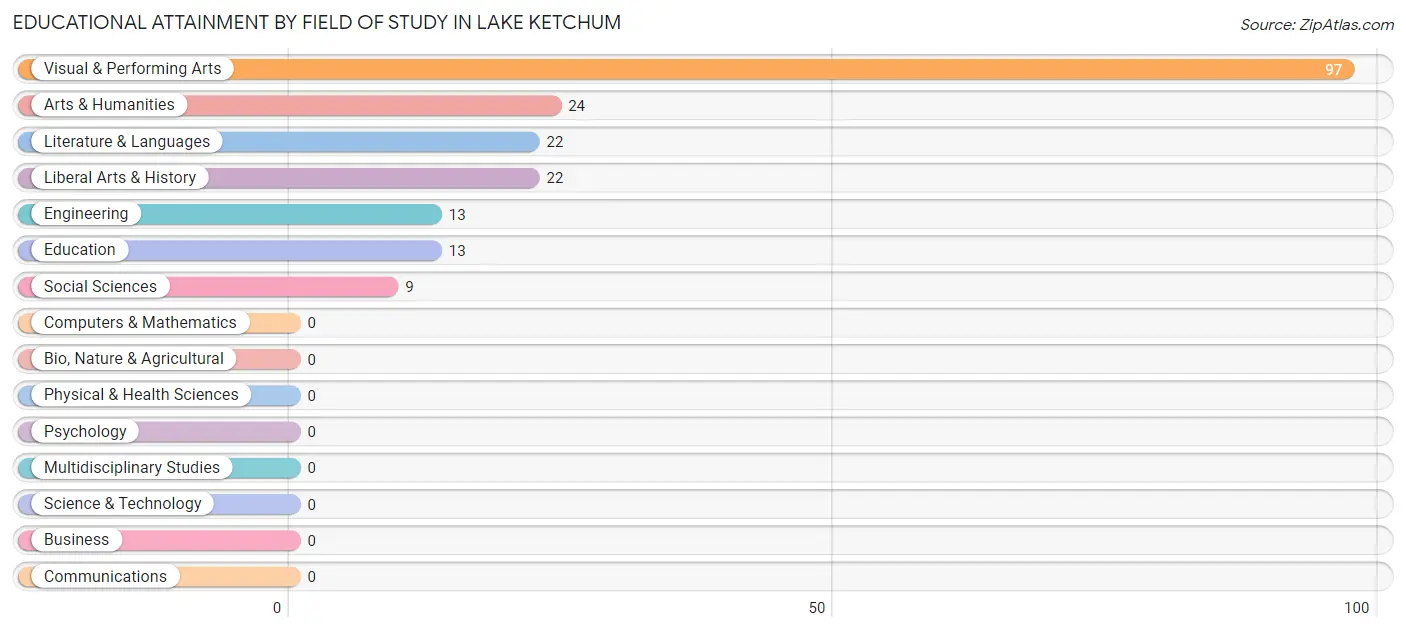
| Field of Study | # Graduates | % Graduates |
| Computers & Mathematics | 0 | 0.0% |
| Bio, Nature & Agricultural | 0 | 0.0% |
| Physical & Health Sciences | 0 | 0.0% |
| Psychology | 0 | 0.0% |
| Social Sciences | 9 | 4.5% |
| Engineering | 13 | 6.5% |
| Multidisciplinary Studies | 0 | 0.0% |
| Science & Technology | 0 | 0.0% |
| Business | 0 | 0.0% |
| Education | 13 | 6.5% |
| Literature & Languages | 22 | 11.0% |
| Liberal Arts & History | 22 | 11.0% |
| Visual & Performing Arts | 97 | 48.5% |
| Communications | 0 | 0.0% |
| Arts & Humanities | 24 | 12.0% |
| Total | 200 | 100.0% |
Transportation & Commute in Lake Ketchum
Vehicle Availability by Sex in Lake Ketchum
The most prevalent vehicle ownership categories in Lake Ketchum are males with 4 vehicles (170, accounting for 46.5%) and females with 4 vehicles (16, making up 78.0%).
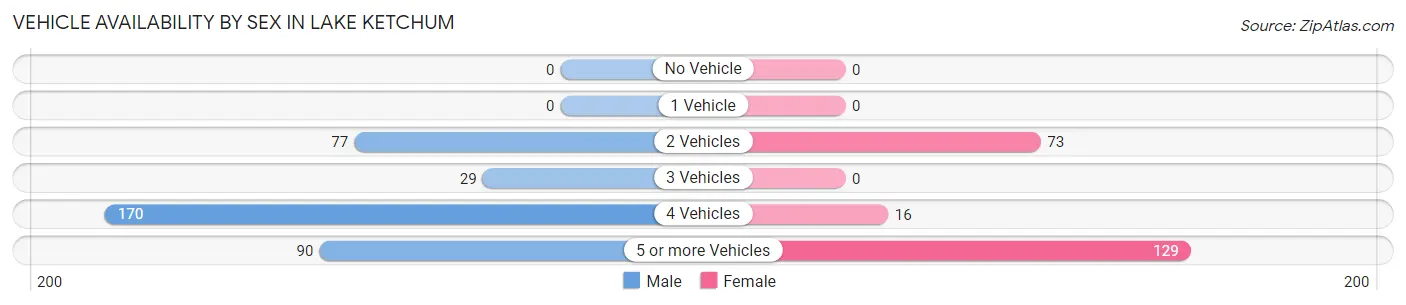
| Vehicles Available | Male | Female |
| No Vehicle | 0 (0.0%) | 0 (0.0%) |
| 1 Vehicle | 0 (0.0%) | 0 (0.0%) |
| 2 Vehicles | 77 (21.0%) | 73 (33.5%) |
| 3 Vehicles | 29 (7.9%) | 0 (0.0%) |
| 4 Vehicles | 170 (46.5%) | 16 (7.3%) |
| 5 or more Vehicles | 90 (24.6%) | 129 (59.2%) |
| Total | 366 (100.0%) | 218 (100.0%) |
Commute Time in Lake Ketchum
The most frequently occuring commute durations in Lake Ketchum are 30 to 34 minutes (122 commuters, 23.0%), 15 to 19 minutes (89 commuters, 16.8%), and 90 or more minutes (78 commuters, 14.7%).
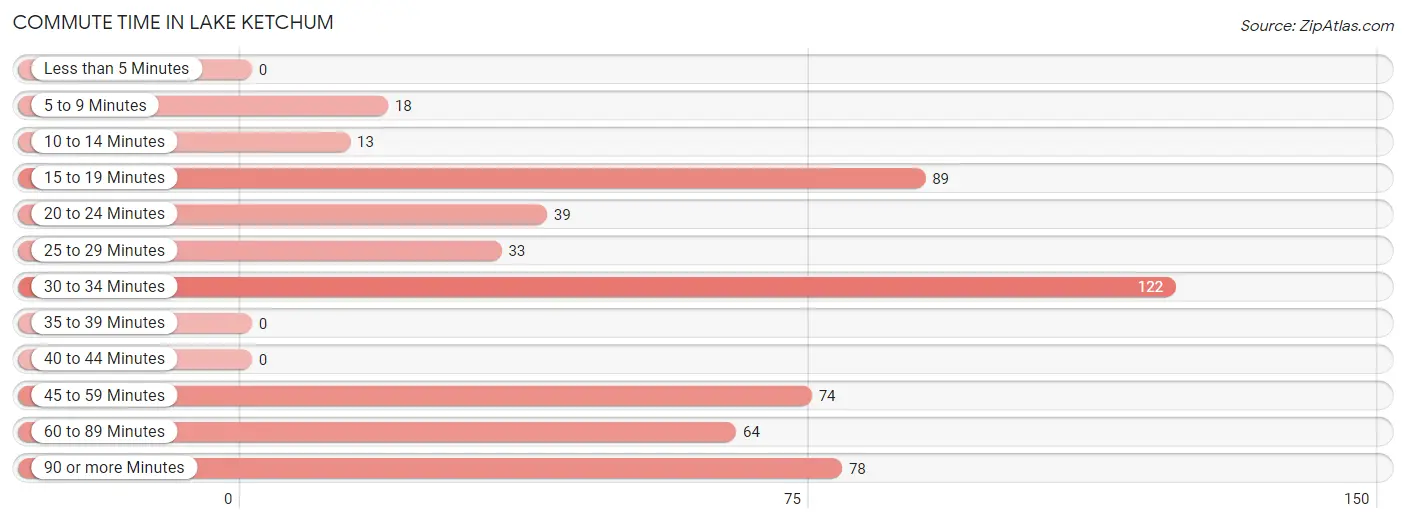
| Commute Time | # Commuters | % Commuters |
| Less than 5 Minutes | 0 | 0.0% |
| 5 to 9 Minutes | 18 | 3.4% |
| 10 to 14 Minutes | 13 | 2.5% |
| 15 to 19 Minutes | 89 | 16.8% |
| 20 to 24 Minutes | 39 | 7.4% |
| 25 to 29 Minutes | 33 | 6.2% |
| 30 to 34 Minutes | 122 | 23.0% |
| 35 to 39 Minutes | 0 | 0.0% |
| 40 to 44 Minutes | 0 | 0.0% |
| 45 to 59 Minutes | 74 | 14.0% |
| 60 to 89 Minutes | 64 | 12.1% |
| 90 or more Minutes | 78 | 14.7% |
Commute Time by Sex in Lake Ketchum
The most common commute times in Lake Ketchum are 30 to 34 minutes (110 commuters, 31.1%) for males and 15 to 19 minutes (89 commuters, 50.6%) for females.
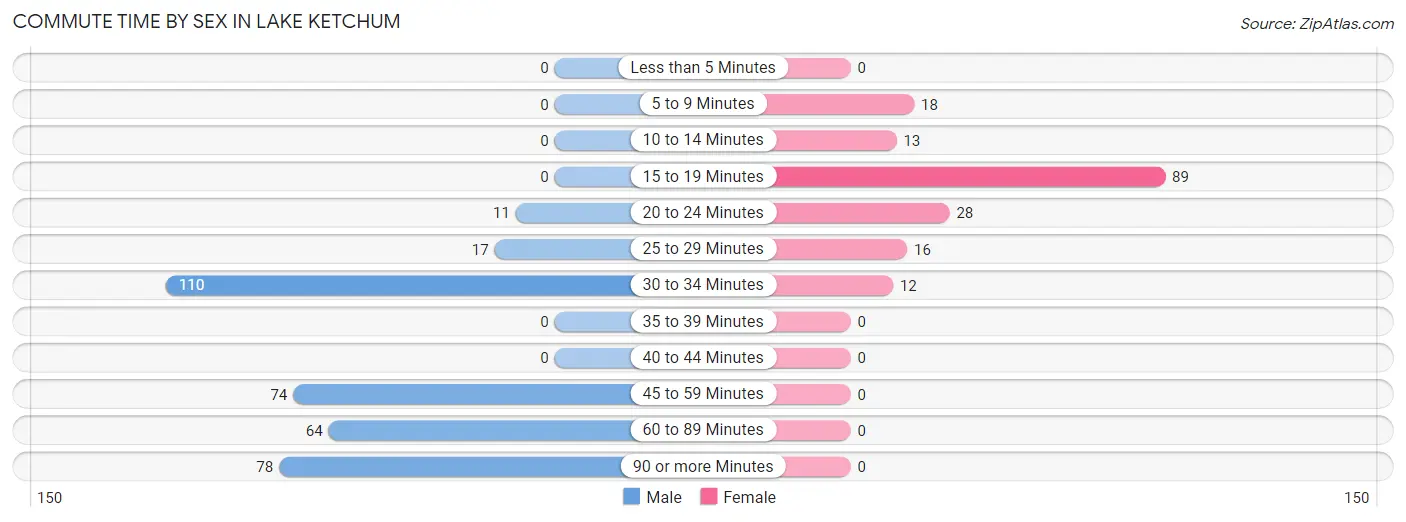
| Commute Time | Male | Female |
| Less than 5 Minutes | 0 (0.0%) | 0 (0.0%) |
| 5 to 9 Minutes | 0 (0.0%) | 18 (10.2%) |
| 10 to 14 Minutes | 0 (0.0%) | 13 (7.4%) |
| 15 to 19 Minutes | 0 (0.0%) | 89 (50.6%) |
| 20 to 24 Minutes | 11 (3.1%) | 28 (15.9%) |
| 25 to 29 Minutes | 17 (4.8%) | 16 (9.1%) |
| 30 to 34 Minutes | 110 (31.1%) | 12 (6.8%) |
| 35 to 39 Minutes | 0 (0.0%) | 0 (0.0%) |
| 40 to 44 Minutes | 0 (0.0%) | 0 (0.0%) |
| 45 to 59 Minutes | 74 (20.9%) | 0 (0.0%) |
| 60 to 89 Minutes | 64 (18.1%) | 0 (0.0%) |
| 90 or more Minutes | 78 (22.0%) | 0 (0.0%) |
Time of Departure to Work by Sex in Lake Ketchum
The most frequent times of departure to work in Lake Ketchum are 5:00 AM to 5:29 AM (123, 34.7%) for males and 5:00 AM to 5:29 AM (73, 41.5%) for females.
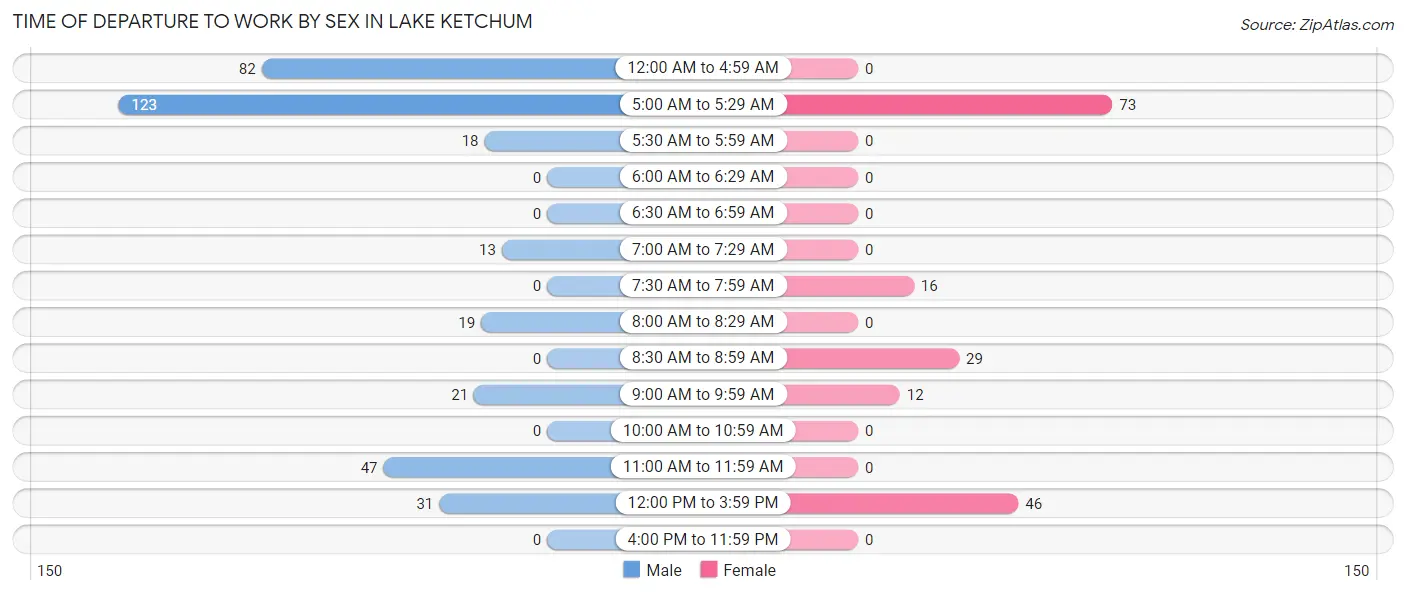
| Time of Departure | Male | Female |
| 12:00 AM to 4:59 AM | 82 (23.2%) | 0 (0.0%) |
| 5:00 AM to 5:29 AM | 123 (34.7%) | 73 (41.5%) |
| 5:30 AM to 5:59 AM | 18 (5.1%) | 0 (0.0%) |
| 6:00 AM to 6:29 AM | 0 (0.0%) | 0 (0.0%) |
| 6:30 AM to 6:59 AM | 0 (0.0%) | 0 (0.0%) |
| 7:00 AM to 7:29 AM | 13 (3.7%) | 0 (0.0%) |
| 7:30 AM to 7:59 AM | 0 (0.0%) | 16 (9.1%) |
| 8:00 AM to 8:29 AM | 19 (5.4%) | 0 (0.0%) |
| 8:30 AM to 8:59 AM | 0 (0.0%) | 29 (16.5%) |
| 9:00 AM to 9:59 AM | 21 (5.9%) | 12 (6.8%) |
| 10:00 AM to 10:59 AM | 0 (0.0%) | 0 (0.0%) |
| 11:00 AM to 11:59 AM | 47 (13.3%) | 0 (0.0%) |
| 12:00 PM to 3:59 PM | 31 (8.8%) | 46 (26.1%) |
| 4:00 PM to 11:59 PM | 0 (0.0%) | 0 (0.0%) |
| Total | 354 (100.0%) | 176 (100.0%) |
Housing Occupancy in Lake Ketchum
Occupancy by Ownership in Lake Ketchum
Of the total 433 dwellings in Lake Ketchum, owner-occupied units account for 380 (87.8%), while renter-occupied units make up 53 (12.2%).
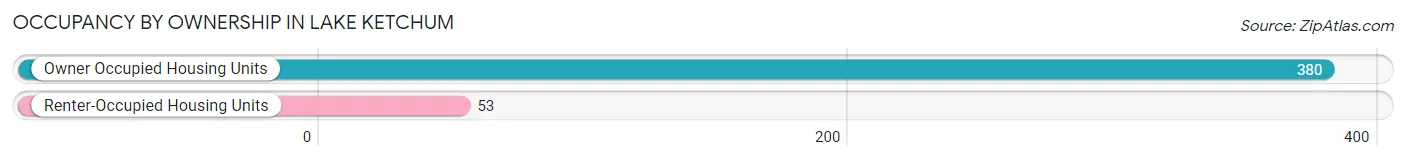
| Occupancy | # Housing Units | % Housing Units |
| Owner Occupied Housing Units | 380 | 87.8% |
| Renter-Occupied Housing Units | 53 | 12.2% |
| Total Occupied Housing Units | 433 | 100.0% |
Occupancy by Household Size in Lake Ketchum
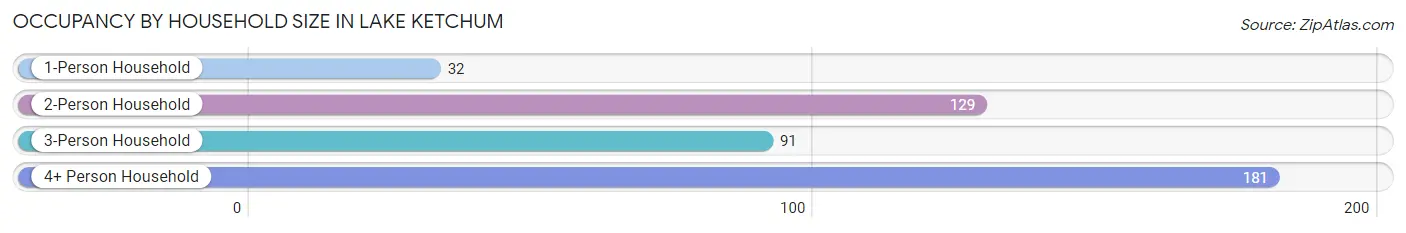
| Household Size | # Housing Units | % Housing Units |
| 1-Person Household | 32 | 7.4% |
| 2-Person Household | 129 | 29.8% |
| 3-Person Household | 91 | 21.0% |
| 4+ Person Household | 181 | 41.8% |
| Total Housing Units | 433 | 100.0% |
Occupancy by Ownership by Household Size in Lake Ketchum
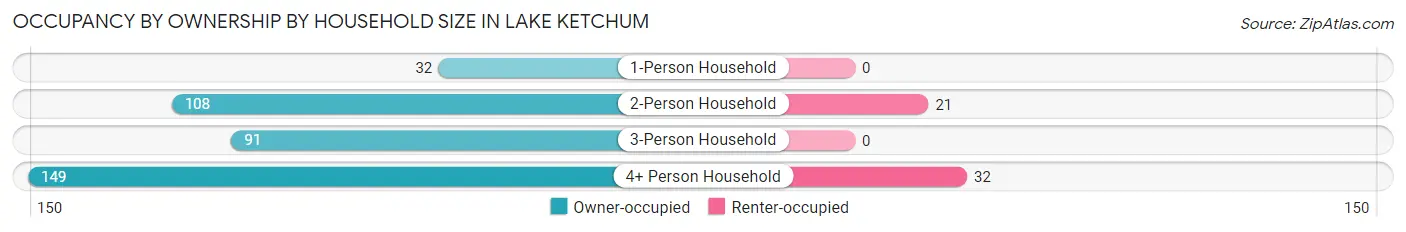
| Household Size | Owner-occupied | Renter-occupied |
| 1-Person Household | 32 (100.0%) | 0 (0.0%) |
| 2-Person Household | 108 (83.7%) | 21 (16.3%) |
| 3-Person Household | 91 (100.0%) | 0 (0.0%) |
| 4+ Person Household | 149 (82.3%) | 32 (17.7%) |
| Total Housing Units | 380 (87.8%) | 53 (12.2%) |
Occupancy by Educational Attainment in Lake Ketchum
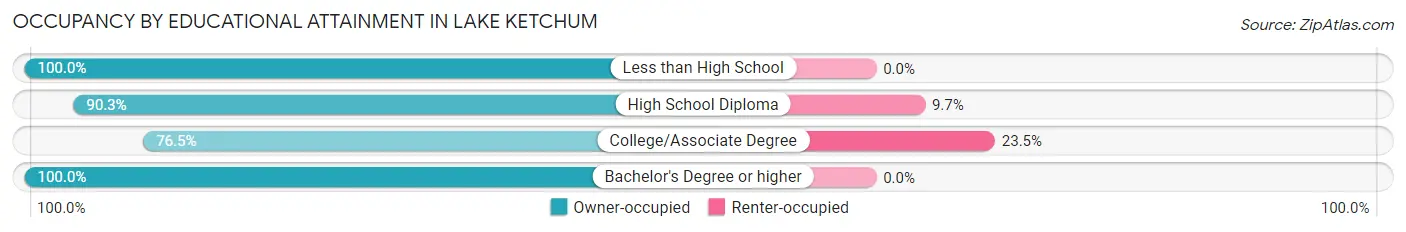
| Household Size | Owner-occupied | Renter-occupied |
| Less than High School | 34 (100.0%) | 0 (0.0%) |
| High School Diploma | 196 (90.3%) | 21 (9.7%) |
| College/Associate Degree | 104 (76.5%) | 32 (23.5%) |
| Bachelor's Degree or higher | 46 (100.0%) | 0 (0.0%) |
Occupancy by Age of Householder in Lake Ketchum
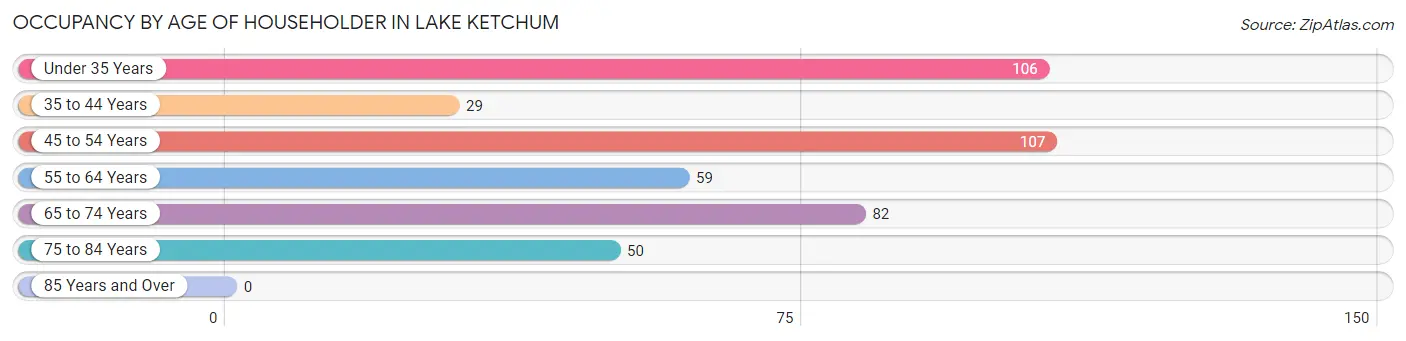
| Age Bracket | # Households | % Households |
| Under 35 Years | 106 | 24.5% |
| 35 to 44 Years | 29 | 6.7% |
| 45 to 54 Years | 107 | 24.7% |
| 55 to 64 Years | 59 | 13.6% |
| 65 to 74 Years | 82 | 18.9% |
| 75 to 84 Years | 50 | 11.6% |
| 85 Years and Over | 0 | 0.0% |
| Total | 433 | 100.0% |
Housing Finances in Lake Ketchum
Median Income by Occupancy in Lake Ketchum
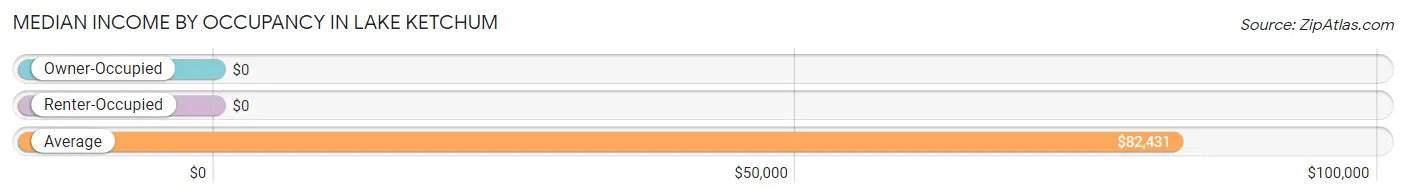
| Occupancy Type | # Households | Median Income |
| Owner-Occupied | 380 (87.8%) | $0 |
| Renter-Occupied | 53 (12.2%) | $0 |
| Average | 433 (100.0%) | $82,431 |
Occupancy by Householder Income Bracket in Lake Ketchum
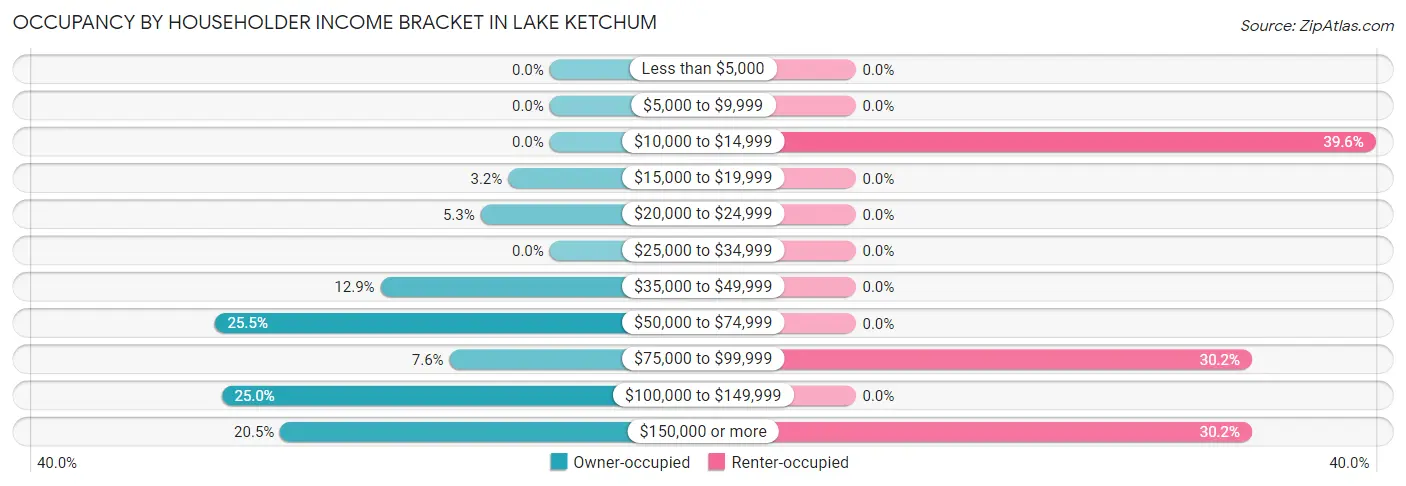
| Income Bracket | Owner-occupied | Renter-occupied |
| Less than $5,000 | 0 (0.0%) | 0 (0.0%) |
| $5,000 to $9,999 | 0 (0.0%) | 0 (0.0%) |
| $10,000 to $14,999 | 0 (0.0%) | 21 (39.6%) |
| $15,000 to $19,999 | 12 (3.2%) | 0 (0.0%) |
| $20,000 to $24,999 | 20 (5.3%) | 0 (0.0%) |
| $25,000 to $34,999 | 0 (0.0%) | 0 (0.0%) |
| $35,000 to $49,999 | 49 (12.9%) | 0 (0.0%) |
| $50,000 to $74,999 | 97 (25.5%) | 0 (0.0%) |
| $75,000 to $99,999 | 29 (7.6%) | 16 (30.2%) |
| $100,000 to $149,999 | 95 (25.0%) | 0 (0.0%) |
| $150,000 or more | 78 (20.5%) | 16 (30.2%) |
| Total | 380 (100.0%) | 53 (100.0%) |
Monthly Housing Cost Tiers in Lake Ketchum
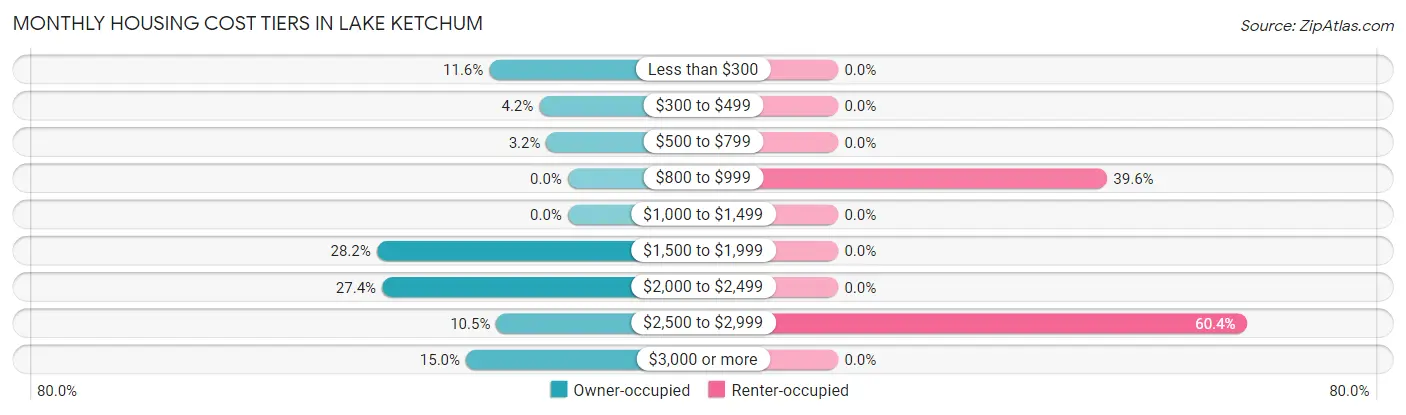
| Monthly Cost | Owner-occupied | Renter-occupied |
| Less than $300 | 44 (11.6%) | 0 (0.0%) |
| $300 to $499 | 16 (4.2%) | 0 (0.0%) |
| $500 to $799 | 12 (3.2%) | 0 (0.0%) |
| $800 to $999 | 0 (0.0%) | 21 (39.6%) |
| $1,000 to $1,499 | 0 (0.0%) | 0 (0.0%) |
| $1,500 to $1,999 | 107 (28.2%) | 0 (0.0%) |
| $2,000 to $2,499 | 104 (27.4%) | 0 (0.0%) |
| $2,500 to $2,999 | 40 (10.5%) | 32 (60.4%) |
| $3,000 or more | 57 (15.0%) | 0 (0.0%) |
| Total | 380 (100.0%) | 53 (100.0%) |
Physical Housing Characteristics in Lake Ketchum
Housing Structures in Lake Ketchum
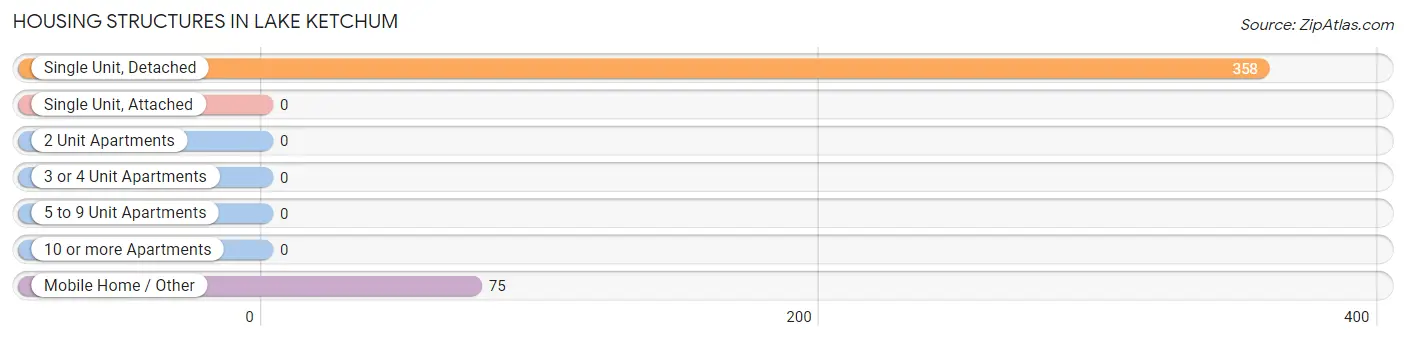
| Structure Type | # Housing Units | % Housing Units |
| Single Unit, Detached | 358 | 82.7% |
| Single Unit, Attached | 0 | 0.0% |
| 2 Unit Apartments | 0 | 0.0% |
| 3 or 4 Unit Apartments | 0 | 0.0% |
| 5 to 9 Unit Apartments | 0 | 0.0% |
| 10 or more Apartments | 0 | 0.0% |
| Mobile Home / Other | 75 | 17.3% |
| Total | 433 | 100.0% |
Housing Structures by Occupancy in Lake Ketchum
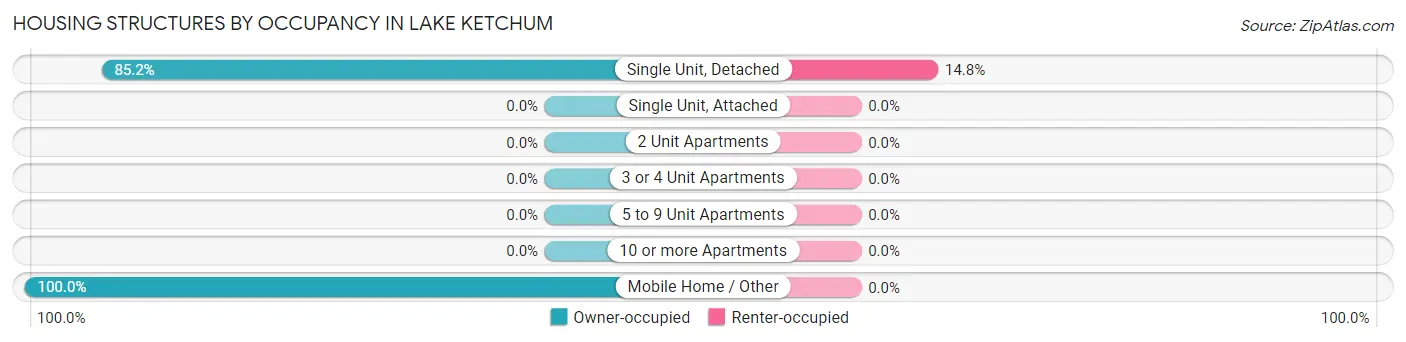
| Structure Type | Owner-occupied | Renter-occupied |
| Single Unit, Detached | 305 (85.2%) | 53 (14.8%) |
| Single Unit, Attached | 0 (0.0%) | 0 (0.0%) |
| 2 Unit Apartments | 0 (0.0%) | 0 (0.0%) |
| 3 or 4 Unit Apartments | 0 (0.0%) | 0 (0.0%) |
| 5 to 9 Unit Apartments | 0 (0.0%) | 0 (0.0%) |
| 10 or more Apartments | 0 (0.0%) | 0 (0.0%) |
| Mobile Home / Other | 75 (100.0%) | 0 (0.0%) |
| Total | 380 (87.8%) | 53 (12.2%) |
Housing Structures by Number of Rooms in Lake Ketchum
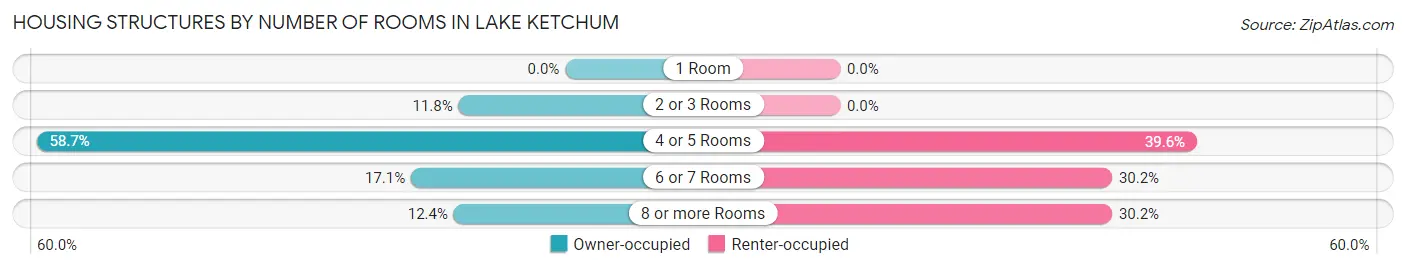
| Number of Rooms | Owner-occupied | Renter-occupied |
| 1 Room | 0 (0.0%) | 0 (0.0%) |
| 2 or 3 Rooms | 45 (11.8%) | 0 (0.0%) |
| 4 or 5 Rooms | 223 (58.7%) | 21 (39.6%) |
| 6 or 7 Rooms | 65 (17.1%) | 16 (30.2%) |
| 8 or more Rooms | 47 (12.4%) | 16 (30.2%) |
| Total | 380 (100.0%) | 53 (100.0%) |
Housing Structure by Heating Type in Lake Ketchum
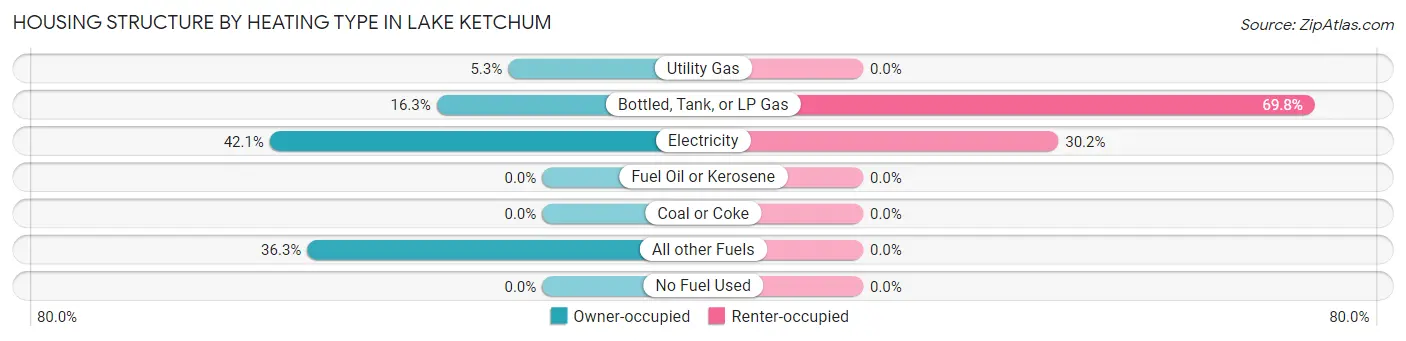
| Heating Type | Owner-occupied | Renter-occupied |
| Utility Gas | 20 (5.3%) | 0 (0.0%) |
| Bottled, Tank, or LP Gas | 62 (16.3%) | 37 (69.8%) |
| Electricity | 160 (42.1%) | 16 (30.2%) |
| Fuel Oil or Kerosene | 0 (0.0%) | 0 (0.0%) |
| Coal or Coke | 0 (0.0%) | 0 (0.0%) |
| All other Fuels | 138 (36.3%) | 0 (0.0%) |
| No Fuel Used | 0 (0.0%) | 0 (0.0%) |
| Total | 380 (100.0%) | 53 (100.0%) |
Household Vehicle Usage in Lake Ketchum
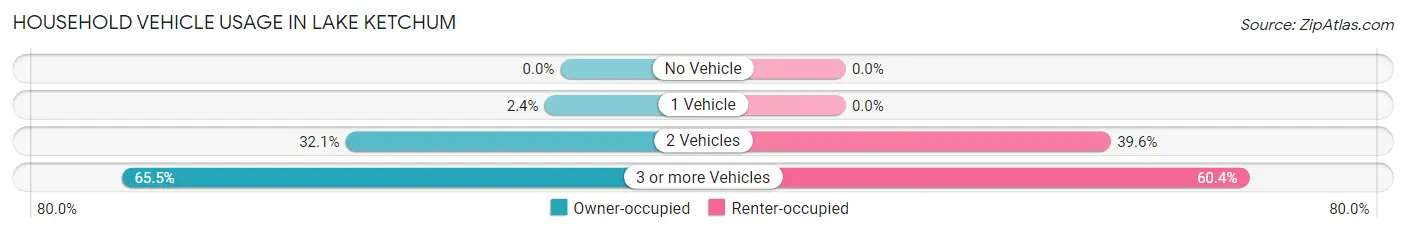
| Vehicles per Household | Owner-occupied | Renter-occupied |
| No Vehicle | 0 (0.0%) | 0 (0.0%) |
| 1 Vehicle | 9 (2.4%) | 0 (0.0%) |
| 2 Vehicles | 122 (32.1%) | 21 (39.6%) |
| 3 or more Vehicles | 249 (65.5%) | 32 (60.4%) |
| Total | 380 (100.0%) | 53 (100.0%) |
Real Estate & Mortgages in Lake Ketchum
Real Estate and Mortgage Overview in Lake Ketchum
| Characteristic | Without Mortgage | With Mortgage |
| Housing Units | 72 | 308 |
| Median Property Value | $230,000 | $546,100 |
| Median Household Income | $42,917 | $78 |
| Monthly Housing Costs | $233 | $57 |
| Real Estate Taxes | $564 | $0 |
Property Value by Mortgage Status in Lake Ketchum
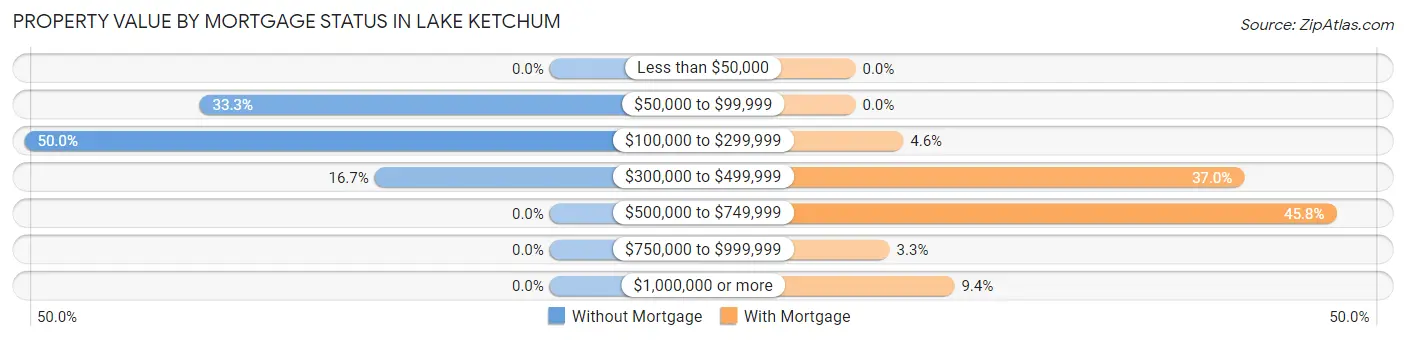
| Property Value | Without Mortgage | With Mortgage |
| Less than $50,000 | 0 (0.0%) | 0 (0.0%) |
| $50,000 to $99,999 | 24 (33.3%) | 0 (0.0%) |
| $100,000 to $299,999 | 36 (50.0%) | 14 (4.5%) |
| $300,000 to $499,999 | 12 (16.7%) | 114 (37.0%) |
| $500,000 to $749,999 | 0 (0.0%) | 141 (45.8%) |
| $750,000 to $999,999 | 0 (0.0%) | 10 (3.3%) |
| $1,000,000 or more | 0 (0.0%) | 29 (9.4%) |
| Total | 72 (100.0%) | 308 (100.0%) |
Household Income by Mortgage Status in Lake Ketchum
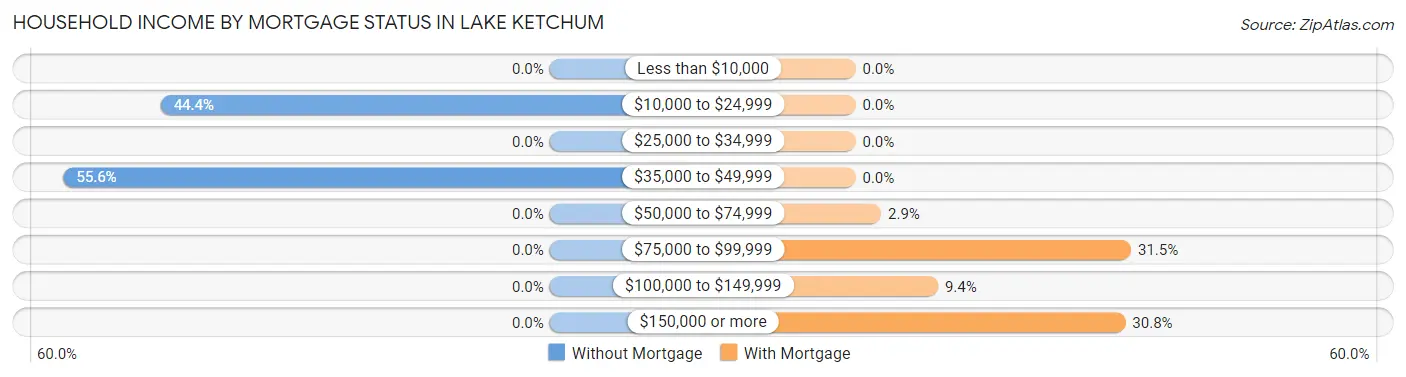
| Household Income | Without Mortgage | With Mortgage |
| Less than $10,000 | 0 (0.0%) | 0 (0.0%) |
| $10,000 to $24,999 | 32 (44.4%) | 0 (0.0%) |
| $25,000 to $34,999 | 0 (0.0%) | 0 (0.0%) |
| $35,000 to $49,999 | 40 (55.6%) | 0 (0.0%) |
| $50,000 to $74,999 | 0 (0.0%) | 9 (2.9%) |
| $75,000 to $99,999 | 0 (0.0%) | 97 (31.5%) |
| $100,000 to $149,999 | 0 (0.0%) | 29 (9.4%) |
| $150,000 or more | 0 (0.0%) | 95 (30.8%) |
| Total | 72 (100.0%) | 308 (100.0%) |
Property Value to Household Income Ratio in Lake Ketchum
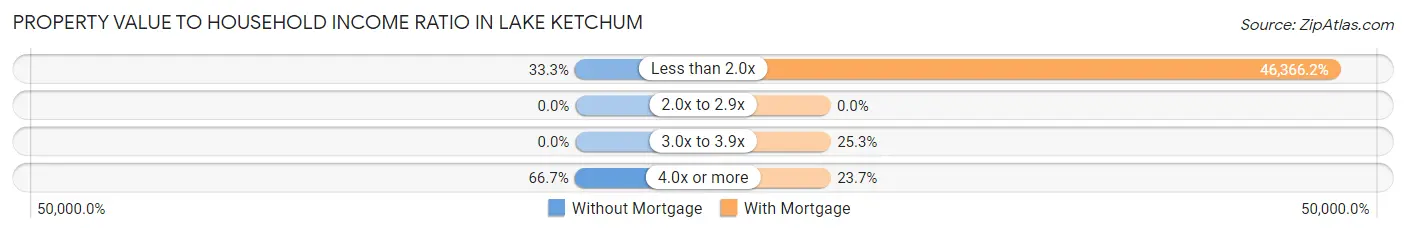
| Value-to-Income Ratio | Without Mortgage | With Mortgage |
| Less than 2.0x | 24 (33.3%) | 142,808 (46,366.2%) |
| 2.0x to 2.9x | 0 (0.0%) | 0 (0.0%) |
| 3.0x to 3.9x | 0 (0.0%) | 78 (25.3%) |
| 4.0x or more | 48 (66.7%) | 73 (23.7%) |
| Total | 72 (100.0%) | 308 (100.0%) |
Real Estate Taxes by Mortgage Status in Lake Ketchum
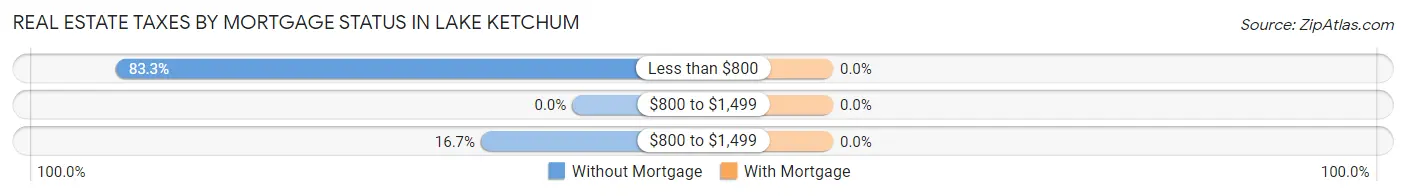
| Property Taxes | Without Mortgage | With Mortgage |
| Less than $800 | 60 (83.3%) | 0 (0.0%) |
| $800 to $1,499 | 0 (0.0%) | 0 (0.0%) |
| $800 to $1,499 | 12 (16.7%) | 0 (0.0%) |
| Total | 72 (100.0%) | 308 (100.0%) |
Health & Disability in Lake Ketchum
Health Insurance Coverage by Age in Lake Ketchum
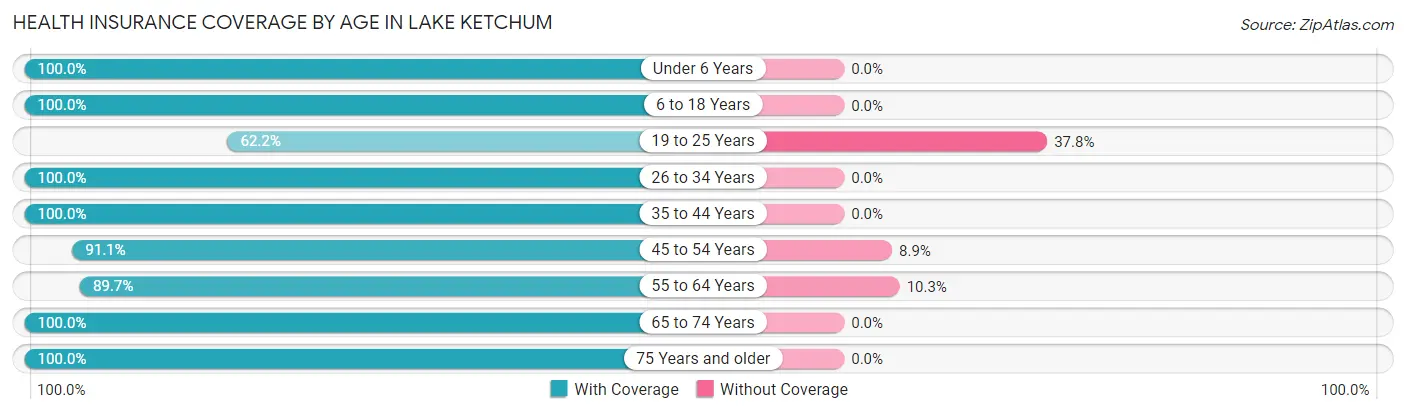
| Age Bracket | With Coverage | Without Coverage |
| Under 6 Years | 141 (100.0%) | 0 (0.0%) |
| 6 to 18 Years | 176 (100.0%) | 0 (0.0%) |
| 19 to 25 Years | 46 (62.2%) | 28 (37.8%) |
| 26 to 34 Years | 206 (100.0%) | 0 (0.0%) |
| 35 to 44 Years | 68 (100.0%) | 0 (0.0%) |
| 45 to 54 Years | 184 (91.1%) | 18 (8.9%) |
| 55 to 64 Years | 165 (89.7%) | 19 (10.3%) |
| 65 to 74 Years | 194 (100.0%) | 0 (0.0%) |
| 75 Years and older | 157 (100.0%) | 0 (0.0%) |
| Total | 1,337 (95.4%) | 65 (4.6%) |
Health Insurance Coverage by Citizenship Status in Lake Ketchum
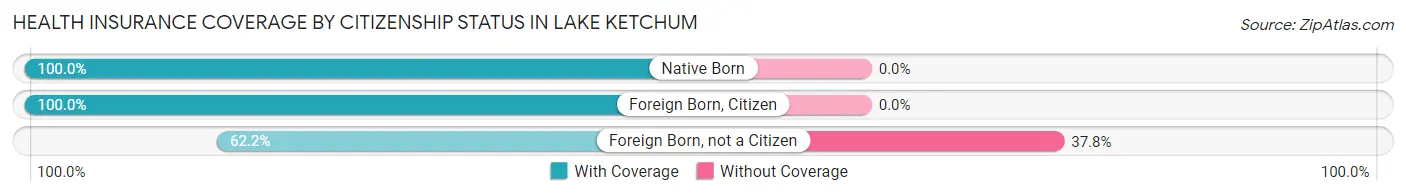
| Citizenship Status | With Coverage | Without Coverage |
| Native Born | 141 (100.0%) | 0 (0.0%) |
| Foreign Born, Citizen | 176 (100.0%) | 0 (0.0%) |
| Foreign Born, not a Citizen | 46 (62.2%) | 28 (37.8%) |
Health Insurance Coverage by Household Income in Lake Ketchum
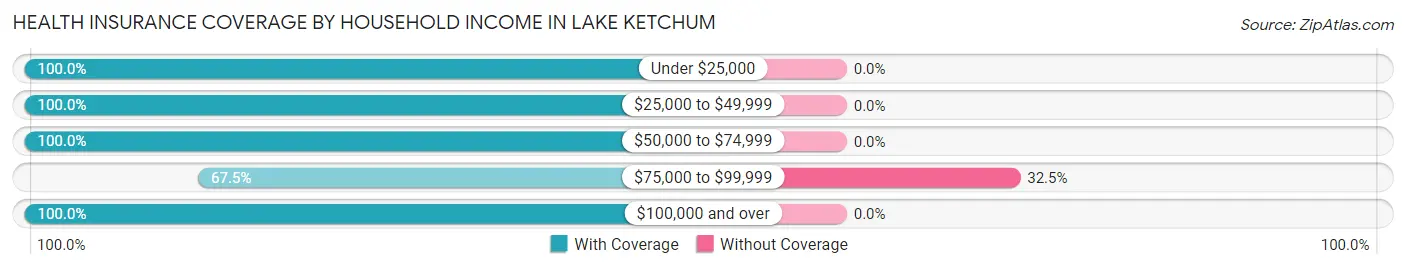
| Household Income | With Coverage | Without Coverage |
| Under $25,000 | 75 (100.0%) | 0 (0.0%) |
| $25,000 to $49,999 | 97 (100.0%) | 0 (0.0%) |
| $50,000 to $74,999 | 329 (100.0%) | 0 (0.0%) |
| $75,000 to $99,999 | 135 (67.5%) | 65 (32.5%) |
| $100,000 and over | 701 (100.0%) | 0 (0.0%) |
Public vs Private Health Insurance Coverage by Age in Lake Ketchum
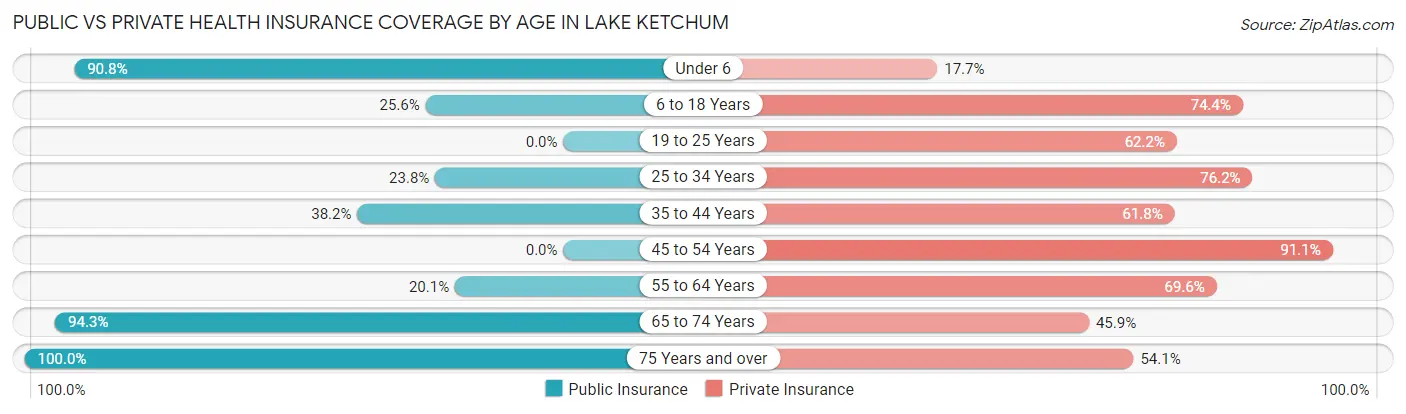
| Age Bracket | Public Insurance | Private Insurance |
| Under 6 | 128 (90.8%) | 25 (17.7%) |
| 6 to 18 Years | 45 (25.6%) | 131 (74.4%) |
| 19 to 25 Years | 0 (0.0%) | 46 (62.2%) |
| 25 to 34 Years | 49 (23.8%) | 157 (76.2%) |
| 35 to 44 Years | 26 (38.2%) | 42 (61.8%) |
| 45 to 54 Years | 0 (0.0%) | 184 (91.1%) |
| 55 to 64 Years | 37 (20.1%) | 128 (69.6%) |
| 65 to 74 Years | 183 (94.3%) | 89 (45.9%) |
| 75 Years and over | 157 (100.0%) | 85 (54.1%) |
| Total | 625 (44.6%) | 887 (63.3%) |
Disability Status by Sex by Age in Lake Ketchum
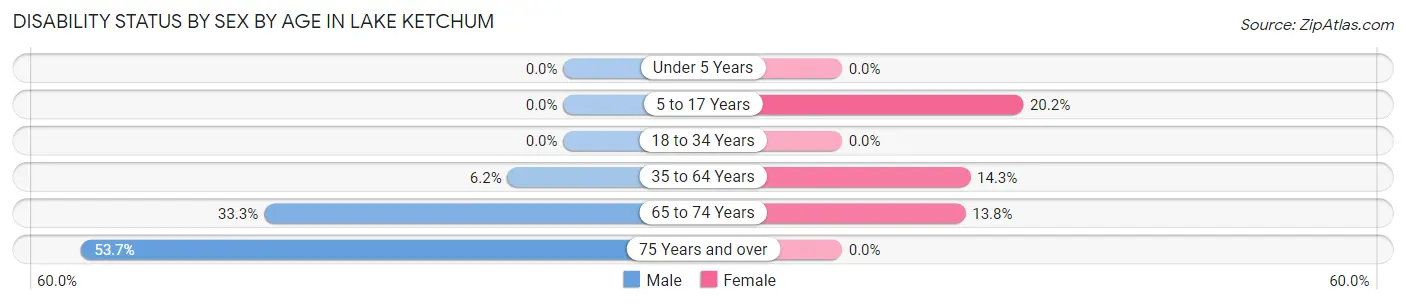
| Age Bracket | Male | Female |
| Under 5 Years | 0 (0.0%) | 0 (0.0%) |
| 5 to 17 Years | 0 (0.0%) | 23 (20.2%) |
| 18 to 34 Years | 0 (0.0%) | 0 (0.0%) |
| 35 to 64 Years | 13 (6.2%) | 35 (14.3%) |
| 65 to 74 Years | 38 (33.3%) | 11 (13.8%) |
| 75 Years and over | 73 (53.7%) | 0 (0.0%) |
Disability Class by Sex by Age in Lake Ketchum
Disability Class: Hearing Difficulty
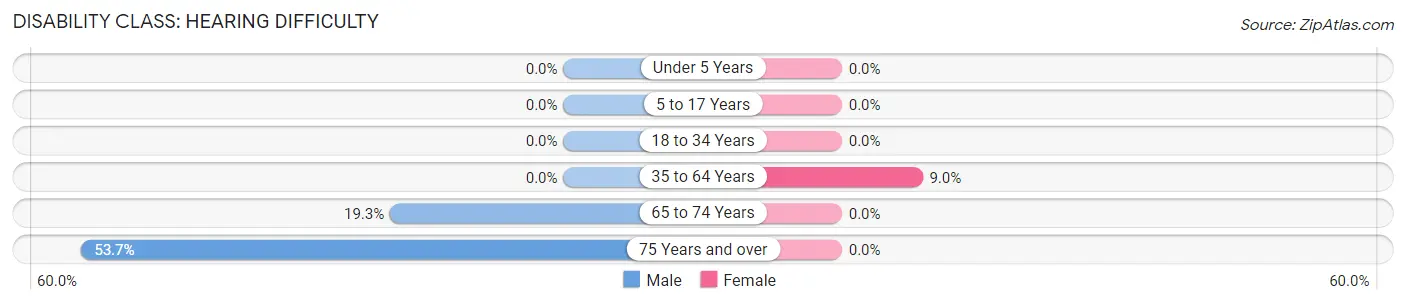
| Age Bracket | Male | Female |
| Under 5 Years | 0 (0.0%) | 0 (0.0%) |
| 5 to 17 Years | 0 (0.0%) | 0 (0.0%) |
| 18 to 34 Years | 0 (0.0%) | 0 (0.0%) |
| 35 to 64 Years | 0 (0.0%) | 22 (9.0%) |
| 65 to 74 Years | 22 (19.3%) | 0 (0.0%) |
| 75 Years and over | 73 (53.7%) | 0 (0.0%) |
Disability Class: Vision Difficulty
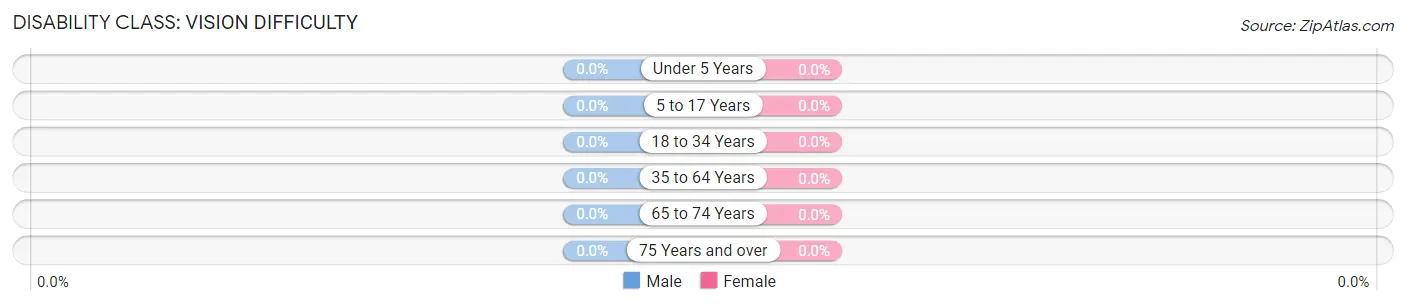
| Age Bracket | Male | Female |
| Under 5 Years | 0 (0.0%) | 0 (0.0%) |
| 5 to 17 Years | 0 (0.0%) | 0 (0.0%) |
| 18 to 34 Years | 0 (0.0%) | 0 (0.0%) |
| 35 to 64 Years | 0 (0.0%) | 0 (0.0%) |
| 65 to 74 Years | 0 (0.0%) | 0 (0.0%) |
| 75 Years and over | 0 (0.0%) | 0 (0.0%) |
Disability Class: Cognitive Difficulty
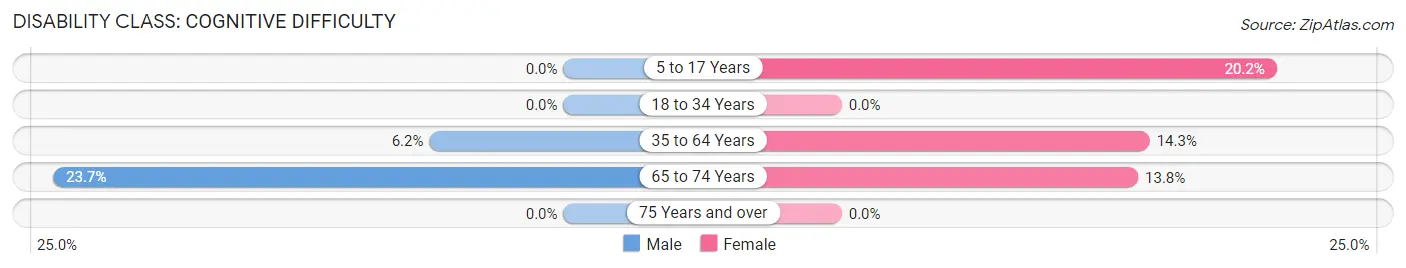
| Age Bracket | Male | Female |
| 5 to 17 Years | 0 (0.0%) | 23 (20.2%) |
| 18 to 34 Years | 0 (0.0%) | 0 (0.0%) |
| 35 to 64 Years | 13 (6.2%) | 35 (14.3%) |
| 65 to 74 Years | 27 (23.7%) | 11 (13.8%) |
| 75 Years and over | 0 (0.0%) | 0 (0.0%) |
Disability Class: Ambulatory Difficulty
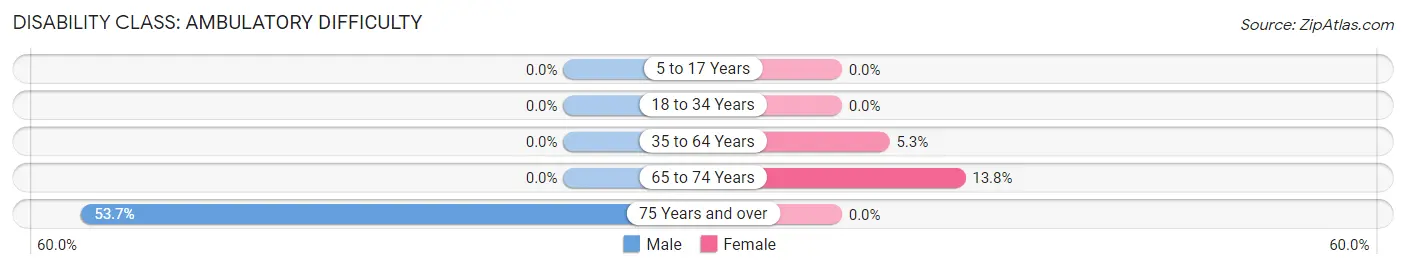
| Age Bracket | Male | Female |
| 5 to 17 Years | 0 (0.0%) | 0 (0.0%) |
| 18 to 34 Years | 0 (0.0%) | 0 (0.0%) |
| 35 to 64 Years | 0 (0.0%) | 13 (5.3%) |
| 65 to 74 Years | 0 (0.0%) | 11 (13.8%) |
| 75 Years and over | 73 (53.7%) | 0 (0.0%) |
Disability Class: Self-Care Difficulty
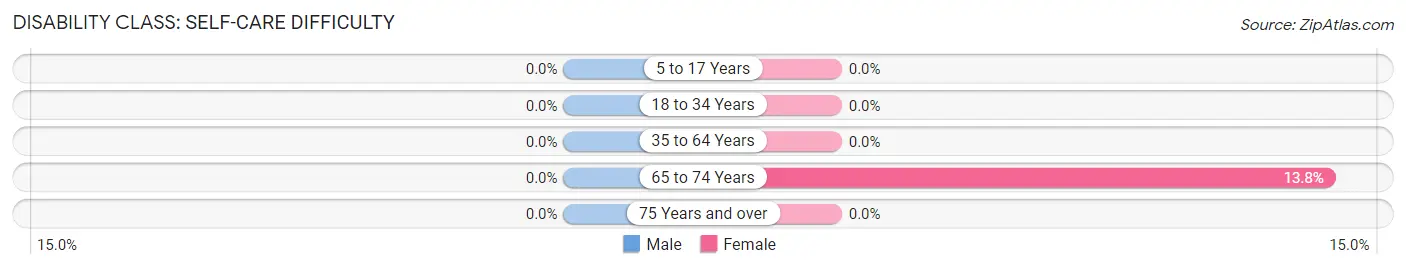
| Age Bracket | Male | Female |
| 5 to 17 Years | 0 (0.0%) | 0 (0.0%) |
| 18 to 34 Years | 0 (0.0%) | 0 (0.0%) |
| 35 to 64 Years | 0 (0.0%) | 0 (0.0%) |
| 65 to 74 Years | 0 (0.0%) | 11 (13.8%) |
| 75 Years and over | 0 (0.0%) | 0 (0.0%) |
Technology Access in Lake Ketchum
Computing Device Access in Lake Ketchum
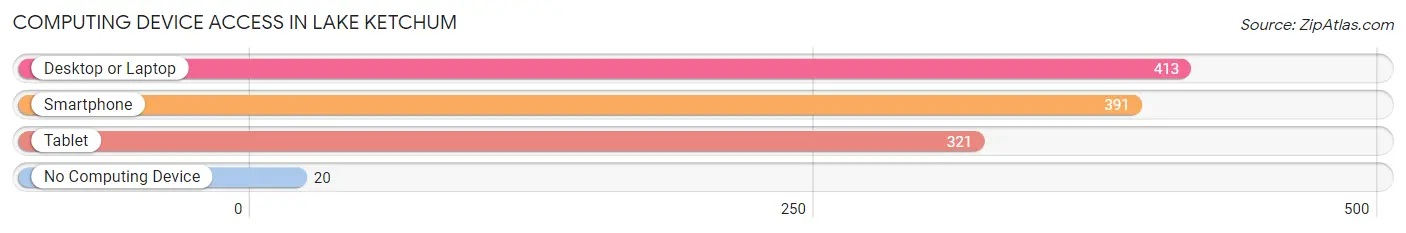
| Device Type | # Households | % Households |
| Desktop or Laptop | 413 | 95.4% |
| Smartphone | 391 | 90.3% |
| Tablet | 321 | 74.1% |
| No Computing Device | 20 | 4.6% |
| Total | 433 | 100.0% |
Internet Access in Lake Ketchum
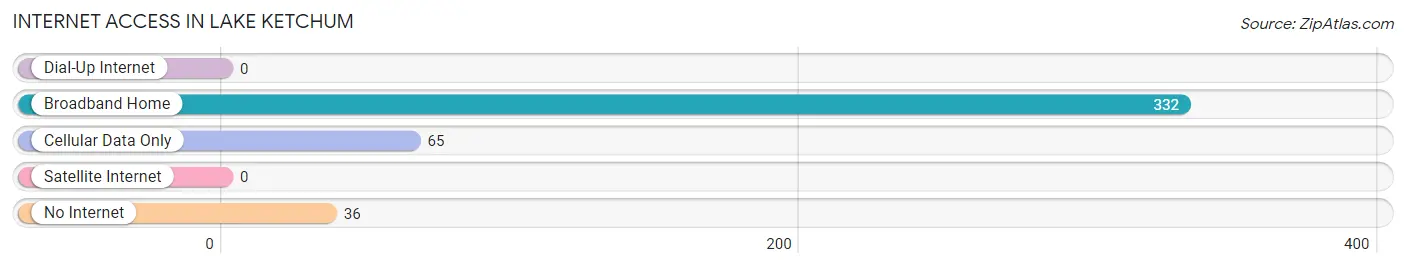
| Internet Type | # Households | % Households |
| Dial-Up Internet | 0 | 0.0% |
| Broadband Home | 332 | 76.7% |
| Cellular Data Only | 65 | 15.0% |
| Satellite Internet | 0 | 0.0% |
| No Internet | 36 | 8.3% |
| Total | 433 | 100.0% |
Lake Ketchum Summary
Lake Ketchum is a small unincorporated community located in the Cascade Mountains of Washington State. It is situated in the foothills of the Cascade Range, approximately 25 miles east of Seattle. The community is located in King County, and is part of the Snoqualmie Valley.
History
The area around Lake Ketchum was first settled in the late 1800s by homesteaders. The first settlers were mostly of Scandinavian descent, and they established farms and logging operations in the area. The community was named after the lake, which was named after a local Native American chief.
The area around Lake Ketchum was primarily used for logging and farming until the 1950s, when the area began to be developed for recreational use. The lake was stocked with trout, and the surrounding area was developed for camping, fishing, and other outdoor activities.
In the 1970s, the area around Lake Ketchum began to be developed for residential use. The community was incorporated in 1975, and the population has grown steadily since then.
Geography
Lake Ketchum is located in the foothills of the Cascade Range, approximately 25 miles east of Seattle. The community is situated in the Snoqualmie Valley, and is surrounded by forests and mountains. The lake itself is a small, shallow lake, approximately one mile in length.
The climate in Lake Ketchum is mild and temperate, with warm summers and cool winters. The average annual temperature is around 50 degrees Fahrenheit. The area receives an average of 40 inches of precipitation per year, mostly in the form of rain.
Economy
The economy of Lake Ketchum is primarily based on tourism and recreation. The area is popular for camping, fishing, and other outdoor activities. There are several resorts and lodges in the area, as well as a number of restaurants and shops.
The area is also home to several small businesses, including a lumber mill, a sawmill, and a few small farms. The lumber mill is the largest employer in the area, and provides jobs for many of the local residents.
Demographics
As of the 2010 census, the population of Lake Ketchum was 1,845. The population is primarily white (94.3%), with a small percentage of African American (1.2%), Asian (1.1%), and Native American (0.7%) residents. The median household income is $60,000, and the median home value is $250,000.
The majority of the population is employed in the service industry (37.2%), followed by construction (14.2%), retail (13.2%), and manufacturing (10.2%). The unemployment rate is 4.2%, which is lower than the national average.
Conclusion
Lake Ketchum is a small unincorporated community located in the Cascade Mountains of Washington State. It is situated in the foothills of the Cascade Range, approximately 25 miles east of Seattle. The community is primarily known for its recreational activities, such as camping, fishing, and other outdoor activities. The economy of Lake Ketchum is primarily based on tourism and recreation, and the population is primarily white. The median household income is $60,000, and the median home value is $250,000.
Common Questions
What is Per Capita Income in Lake Ketchum?
Per Capita income in Lake Ketchum is $33,854.
What is the Median Family Income in Lake Ketchum?
Median Family Income in Lake Ketchum is $93,203.
What is the Median Household income in Lake Ketchum?
Median Household Income in Lake Ketchum is $82,431.
What is Income or Wage Gap in Lake Ketchum?
Income or Wage Gap in Lake Ketchum is 46.9%.
Women in Lake Ketchum earn 53.1 cents for every dollar earned by a man.
What is Inequality or Gini Index in Lake Ketchum?
Inequality or Gini Index in Lake Ketchum is 0.34.
What is the Total Population of Lake Ketchum?
Total Population of Lake Ketchum is 1,402.
What is the Total Male Population of Lake Ketchum?
Total Male Population of Lake Ketchum is 736.
What is the Total Female Population of Lake Ketchum?
Total Female Population of Lake Ketchum is 666.
What is the Ratio of Males per 100 Females in Lake Ketchum?
There are 110.51 Males per 100 Females in Lake Ketchum.
What is the Ratio of Females per 100 Males in Lake Ketchum?
There are 90.49 Females per 100 Males in Lake Ketchum.
What is the Median Population Age in Lake Ketchum?
Median Population Age in Lake Ketchum is 52.0 Years.
What is the Average Family Size in Lake Ketchum
Average Family Size in Lake Ketchum is 3.1 People.
What is the Average Household Size in Lake Ketchum
Average Household Size in Lake Ketchum is 3.2 People.
How Large is the Labor Force in Lake Ketchum?
There are 584 People in the Labor Forcein in Lake Ketchum.
What is the Percentage of People in the Labor Force in Lake Ketchum?
50.7% of People are in the Labor Force in Lake Ketchum.