Zip Codes with the Highest Percentage of Population Employed in Food Preparation & Serving in Seattle, WA

RELATED REPORTS & OPTIONS

Food Preparation & Serving
Population
Families and Households
Female Fertility
Female Fertility (Unmarried)
Race (Community Size)
Race (Percentage)
Ancestry (Community Size)
AfghanAfricanAlaska NativeAlaskan AthabascanAlbanianAleutAmericanApacheArabArgentineanArmenianAssyrian / Chaldean / SyriacAustralianAustrianBahamianBangladeshiBarbadianBasqueBelgianBelizeanBhutaneseBlackfeetBolivianBrazilianBritishBritish West IndianBulgarianBurmeseCajunCambodianCanadianCape VerdeanCarpatho RusynCelticCentral AmericanCentral American IndianCherokeeCheyenneChickasawChileanChineseChippewaChoctawColombianColvilleComancheCosta RicanCreeCreekCroatianCrowCubanCypriotCzechCzechoslovakianDanishDelawareDominicanDutchEastern EuropeanEcuadorianEgyptianEnglishEstonianEthiopianEuropeanFijianFilipinoFinnishFrenchFrench American IndianFrench CanadianGermanGerman RussianGhanaianGreekGuamanian / ChamorroGuatemalanGuyaneseHaitianHonduranHopiHungarianIcelanderIndian (Asian)IndonesianInupiatIranianIraqiIrishIroquoisIsraeliItalianJamaicanJapaneseJordanianKenyanKoreanLaotianLatvianLebaneseLithuanianLuxembourgerMacedonianMalaysianMalteseMarshalleseMexicanMexican American IndianMongolianMoroccanNative HawaiianNavajoNepaleseNew ZealanderNicaraguanNigerianNorthern EuropeanNorwegianOkinawanOsagePakistaniPalestinianPanamanianParaguayanPennsylvania GermanPeruvianPolishPortuguesePotawatomiPuebloPuerto RicanPuget Sound SalishRomanianRussianSalvadoranSamoanScandinavianScotch-IrishScottishSeminoleSenegaleseSerbianShoshoneSiouxSlavicSlovakSloveneSomaliSouth AfricanSouth AmericanSouth American IndianSpaniardSpanishSpanish AmericanSri LankanSubsaharan AfricanSudaneseSwedishSwissSyrianThaiTlingit-HaidaTonganTrinidadian and TobagonianTsimshianTurkishUgandanUkrainianUruguayanUteVenezuelanVietnameseWelshWest IndianYakamaYaquiYugoslavianYup'ik
Ancestry (Percentage)
AfghanAfricanAlaska NativeAlaskan AthabascanAlbanianAleutAmericanApacheArabArgentineanArmenianAssyrian / Chaldean / SyriacAustralianAustrianBahamianBangladeshiBarbadianBasqueBelgianBelizeanBhutaneseBlackfeetBolivianBrazilianBritishBritish West IndianBulgarianBurmeseCajunCambodianCanadianCape VerdeanCarpatho RusynCelticCentral AmericanCentral American IndianCherokeeCheyenneChickasawChileanChineseChippewaChoctawColombianColvilleComancheCosta RicanCreeCreekCroatianCrowCubanCypriotCzechCzechoslovakianDanishDelawareDominicanDutchEastern EuropeanEcuadorianEgyptianEnglishEstonianEthiopianEuropeanFijianFilipinoFinnishFrenchFrench American IndianFrench CanadianGermanGerman RussianGhanaianGreekGuamanian / ChamorroGuatemalanGuyaneseHaitianHonduranHopiHungarianIcelanderIndian (Asian)IndonesianInupiatIranianIraqiIrishIroquoisIsraeliItalianJamaicanJapaneseJordanianKenyanKoreanLaotianLatvianLebaneseLithuanianLuxembourgerMacedonianMalaysianMalteseMarshalleseMexicanMexican American IndianMongolianMoroccanNative HawaiianNavajoNepaleseNew ZealanderNicaraguanNigerianNorthern EuropeanNorwegianOkinawanOsagePakistaniPalestinianPanamanianParaguayanPennsylvania GermanPeruvianPolishPortuguesePotawatomiPuebloPuerto RicanPuget Sound SalishRomanianRussianSalvadoranSamoanScandinavianScotch-IrishScottishSeminoleSenegaleseSerbianShoshoneSiouxSlavicSlovakSloveneSomaliSouth AfricanSouth AmericanSouth American IndianSpaniardSpanishSpanish AmericanSri LankanSubsaharan AfricanSudaneseSwedishSwissSyrianThaiTlingit-HaidaTonganTrinidadian and TobagonianTsimshianTurkishUgandanUkrainianUruguayanUteVenezuelanVietnameseWelshWest IndianYakamaYaquiYugoslavianYup'ik
Immigrant Origin (Total)
AfghanistanAfricaAlbaniaArgentinaArmeniaAsiaAustraliaAustriaBangladeshBelarusBelgiumBelizeBoliviaBosnia and HerzegovinaBrazilBulgariaBurma / MyanmarCambodiaCameroonCanadaCaribbeanCentral AmericaChileChinaColombiaCongoCosta RicaCroatiaCubaCzechoslovakiaDenmarkDominican RepublicEastern AfricaEastern AsiaEastern EuropeEcuadorEgyptEl SalvadorEnglandEritreaEthiopiaEuropeFijiFranceGermanyGhanaGreeceGuatemalaHaitiHondurasHong KongHungaryIndiaIndonesiaIranIraqIrelandIsraelItalyJamaicaJapanJordanKazakhstanKenyaKoreaKuwaitLaosLatin AmericaLatviaLebanonLiberiaLithuaniaMalaysiaMexicoMicronesiaMiddle AfricaMoldovaMoroccoNepalNetherlandsNicaraguaNigeriaNorth MacedoniaNorthern AfricaNorthern EuropeNorwayOceaniaPakistanPanamaPeruPhilippinesPolandPortugalRomaniaRussiaSaudi ArabiaScotlandSenegalSerbiaSierra LeoneSingaporeSomaliaSouth AfricaSouth AmericaSouth Central AsiaSouth Eastern AsiaSouthern EuropeSpainSri LankaSudanSwedenSwitzerlandSyriaTaiwanThailandTrinidad and TobagoTurkeyUgandaUkraineUzbekistanVenezuelaVietnamWestern AfricaWestern AsiaWestern EuropeYemenZaireZimbabwe
Immigrant Origin (Percentage)
AfghanistanAfricaAlbaniaArgentinaArmeniaAsiaAustraliaAustriaBangladeshBelarusBelgiumBelizeBoliviaBosnia and HerzegovinaBrazilBulgariaBurma / MyanmarCambodiaCameroonCanadaCaribbeanCentral AmericaChileChinaColombiaCongoCosta RicaCroatiaCubaCzechoslovakiaDenmarkDominican RepublicEastern AfricaEastern AsiaEastern EuropeEcuadorEgyptEl SalvadorEnglandEritreaEthiopiaEuropeFijiFranceGermanyGhanaGreeceGuatemalaHaitiHondurasHong KongHungaryIndiaIndonesiaIranIraqIrelandIsraelItalyJamaicaJapanJordanKazakhstanKenyaKoreaKuwaitLaosLatin AmericaLatviaLebanonLiberiaLithuaniaMalaysiaMexicoMicronesiaMiddle AfricaMoldovaMoroccoNepalNetherlandsNicaraguaNigeriaNorth MacedoniaNorthern AfricaNorthern EuropeNorwayOceaniaPakistanPanamaPeruPhilippinesPolandPortugalRomaniaRussiaSaudi ArabiaScotlandSenegalSerbiaSierra LeoneSingaporeSomaliaSouth AfricaSouth AmericaSouth Central AsiaSouth Eastern AsiaSouthern EuropeSpainSri LankaSudanSwedenSwitzerlandSyriaTaiwanThailandTrinidad and TobagoTurkeyUgandaUkraineUzbekistanVenezuelaVietnamWestern AfricaWestern AsiaWestern EuropeYemenZaireZimbabwe
Income
Income (Families)
Income (Households)
Poverty
Poverty (Families)
Unemployment
Employment Occupations
Employment Industries
Employer Class
Commute Time
Commute Means
School Enrollment
Education by Degree Field
Occupancy
Finances
Physical Characteristics
Seattle
Compare Zip Codes
Comparison Subject

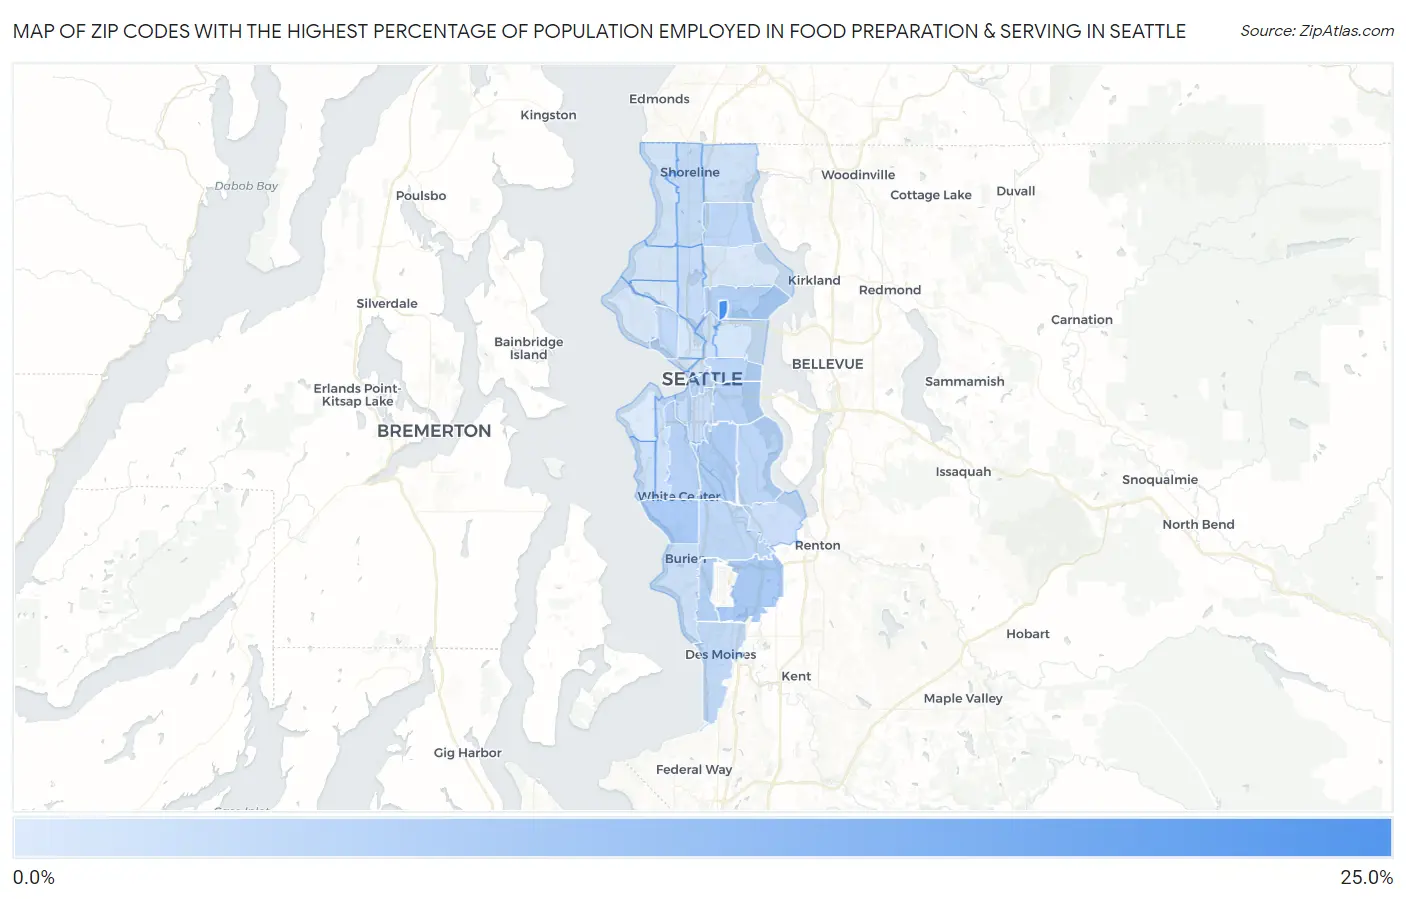
Map of Zip Codes with the Highest Percentage of Population Employed in Food Preparation & Serving in Seattle

0.0%
25.0%
Zip Codes with the Highest Percentage of Population Employed in Food Preparation & Serving in Seattle Map

Zip Codes with the Highest Percentage of Population Employed in Food Preparation & Serving in Seattle, WA

Zip Code % Employed vs State vs National
1.9819524.9%5.1%(+19.7)#65.3%(+19.6)#319
2.9816411.2%5.1%(+6.02)#365.3%(+5.88)#1,973
3.981469.5%5.1%(+4.35)#545.3%(+4.20)#3,064
4.981889.4%5.1%(+4.27)#565.3%(+4.13)#3,122
5.981088.6%5.1%(+3.47)#685.3%(+3.33)#3,953
6.981058.1%5.1%(+2.95)#805.3%(+2.81)#4,582
7.981487.9%5.1%(+2.74)#865.3%(+2.60)#4,911
8.981447.5%5.1%(+2.33)#975.3%(+2.19)#5,605
9.981067.4%5.1%(+2.23)#1005.3%(+2.09)#5,794
10.981047.1%5.1%(+1.97)#1085.3%(+1.83)#6,311
11.981226.8%5.1%(+1.62)#1195.3%(+1.48)#7,150
12.981186.7%5.1%(+1.55)#1215.3%(+1.41)#7,345
13.981256.6%5.1%(+1.44)#1245.3%(+1.30)#7,650
14.981686.5%5.1%(+1.31)#1335.3%(+1.17)#7,987
15.981196.3%5.1%(+1.12)#1485.3%(+0.973)#8,550
16.981985.9%5.1%(+0.734)#1695.3%(+0.591)#9,764
17.981335.6%5.1%(+0.484)#1835.3%(+0.341)#10,612
18.981345.3%5.1%(+0.155)#2155.3%(+0.012)#11,769
19.981035.0%5.1%(-0.101)#2405.3%(-0.244)#12,778
20.981784.8%5.1%(-0.350)#2575.3%(-0.493)#13,795
21.981364.5%5.1%(-0.604)#2785.3%(-0.747)#14,860
22.981664.4%5.1%(-0.763)#2865.3%(-0.906)#15,506
23.981024.4%5.1%(-0.767)#2875.3%(-0.910)#15,524
24.981264.3%5.1%(-0.823)#2955.3%(-0.966)#15,789
25.981554.2%5.1%(-0.965)#3055.3%(-1.11)#16,413
26.981773.6%5.1%(-1.50)#3465.3%(-1.65)#18,611
27.981013.6%5.1%(-1.59)#3555.3%(-1.73)#18,977
28.981173.3%5.1%(-1.81)#3715.3%(-1.96)#19,940
29.981123.3%5.1%(-1.85)#3775.3%(-2.00)#20,114
30.981093.1%5.1%(-2.05)#3895.3%(-2.19)#20,896
31.981073.1%5.1%(-2.06)#3915.3%(-2.20)#20,942
32.981993.0%5.1%(-2.14)#3945.3%(-2.28)#21,240
33.981153.0%5.1%(-2.15)#3965.3%(-2.29)#21,274
34.981212.5%5.1%(-2.60)#4275.3%(-2.74)#23,010
35.981162.3%5.1%(-2.84)#4385.3%(-2.98)#23,759

Common Questions

What are the Top 10 Zip Codes with the Highest Percentage of Population Employed in Food Preparation & Serving in Seattle, WA?
Top 10 Zip Codes with the Highest Percentage of Population Employed in Food Preparation & Serving in Seattle, WA are:
#1
24.9%
#2
11.2%
#3
9.5%
#4
9.4%
#5
8.6%
#6
8.1%
#7
7.9%
#8
7.5%
#9
7.4%
#10
7.1%
What zip code has the Highest Percentage of Population Employed in Food Preparation & Serving in Seattle, WA?
98195 has the Highest Percentage of Population Employed in Food Preparation & Serving in Seattle, WA with 24.9%.
What is the Percentage of Population Employed in Food Preparation & Serving in Seattle, WA?
Percentage of Population Employed in Food Preparation & Serving in Seattle is 5.1%.
What is the Percentage of Population Employed in Food Preparation & Serving in Washington?
Percentage of Population Employed in Food Preparation & Serving in Washington is 5.1%.
What is the Percentage of Population Employed in Food Preparation & Serving in the United States?
Percentage of Population Employed in Food Preparation & Serving in the United States is 5.3%.