Cities with the Lowest Unemployment Rate in Washington
RELATED REPORTS & OPTIONS
Lowest Unemployment
Washington
Compare Cities
Map of Cities with the Lowest Unemployment Rate in Washington
3.0%
0.0%
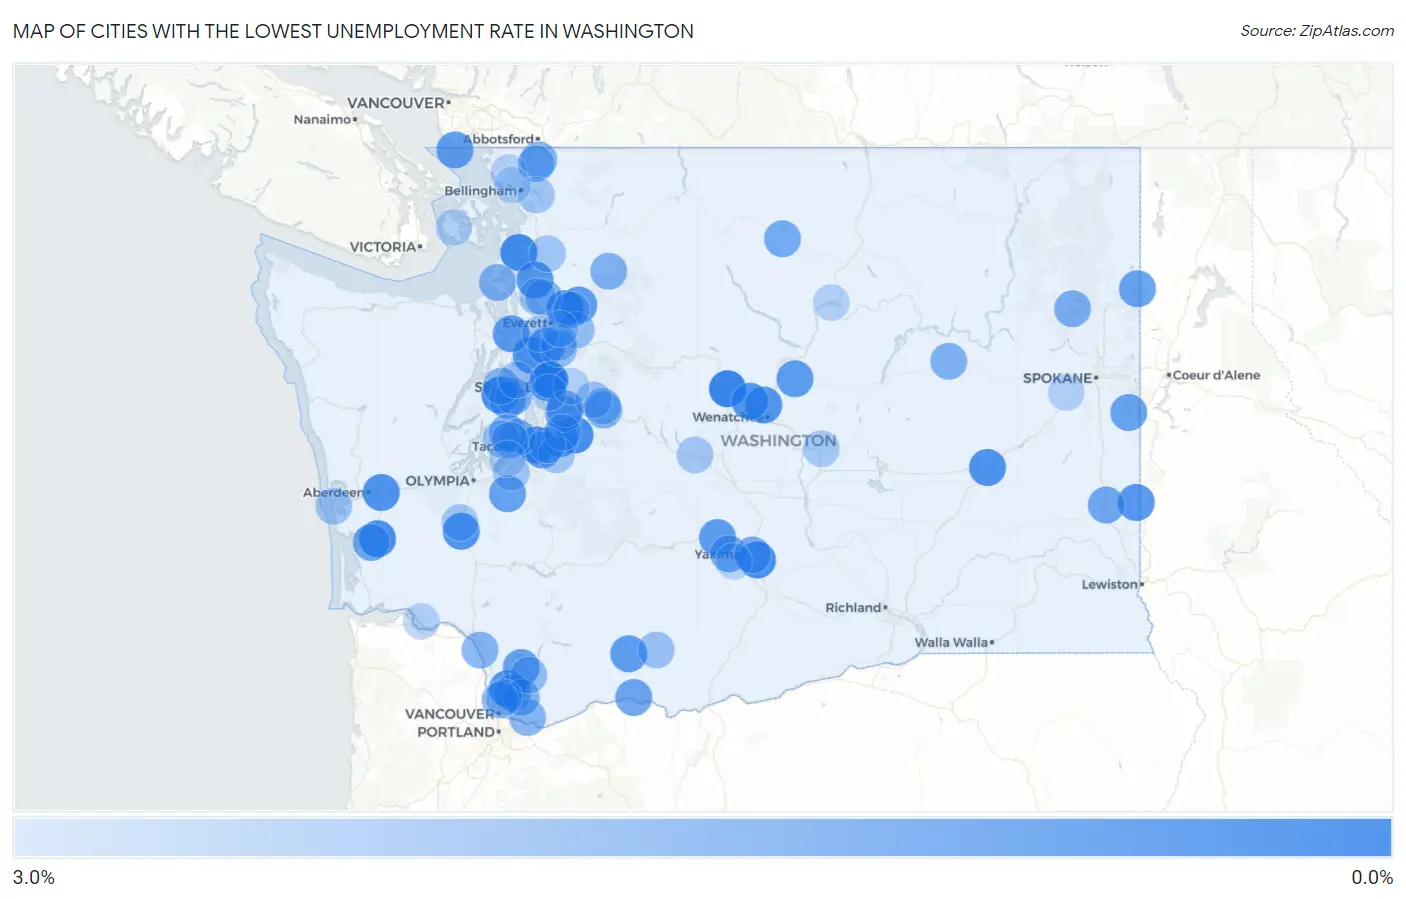
Cities with the Lowest Unemployment Rate in Washington
| City | Unemployment Rate | vs State | vs National | |
| 1. | Leavenworth | 0.30% | 4.6% (-4.30)#1 | 5.0% (-4.70)#61 |
| 2. | Fife Heights | 0.50% | 4.6% (-4.10)#2 | 5.0% (-4.50)#275 |
| 3. | La Conner | 0.50% | 4.6% (-4.10)#3 | 5.0% (-4.50)#299 |
| 4. | Black Diamond | 0.60% | 4.6% (-4.00)#4 | 5.0% (-4.40)#361 |
| 5. | Moxee | 0.60% | 4.6% (-4.00)#5 | 5.0% (-4.40)#369 |
| 6. | Raymond | 0.60% | 4.6% (-4.00)#6 | 5.0% (-4.40)#388 |
| 7. | Lake Cassidy | 0.60% | 4.6% (-4.00)#7 | 5.0% (-4.40)#394 |
| 8. | Navy Yard City | 0.60% | 4.6% (-4.00)#8 | 5.0% (-4.40)#396 |
| 9. | Central Park | 0.70% | 4.6% (-3.90)#9 | 5.0% (-4.30)#543 |
| 10. | Ritzville | 0.70% | 4.6% (-3.90)#10 | 5.0% (-4.30)#582 |
| 11. | Woodway | 0.70% | 4.6% (-3.90)#11 | 5.0% (-4.30)#608 |
| 12. | Sunnyslope | 0.80% | 4.6% (-3.80)#12 | 5.0% (-4.20)#729 |
| 13. | Cashmere | 0.80% | 4.6% (-3.80)#13 | 5.0% (-4.20)#732 |
| 14. | Fords Prairie | 0.80% | 4.6% (-3.80)#14 | 5.0% (-4.20)#742 |
| 15. | Kitsap Lake | 0.80% | 4.6% (-3.80)#15 | 5.0% (-4.20)#761 |
| 16. | Dollars Corner | 0.80% | 4.6% (-3.80)#16 | 5.0% (-4.20)#809 |
| 17. | Roche Harbor | 0.80% | 4.6% (-3.80)#17 | 5.0% (-4.20)#817 |
| 18. | Stanwood | 0.90% | 4.6% (-3.70)#18 | 5.0% (-4.10)#904 |
| 19. | Medina | 0.90% | 4.6% (-3.70)#19 | 5.0% (-4.10)#954 |
| 20. | Palouse | 0.90% | 4.6% (-3.70)#20 | 5.0% (-4.10)#1,013 |
| 21. | Edgewood | 1.0% | 4.6% (-3.60)#21 | 5.0% (-4.00)#1,104 |
| 22. | Granite Falls | 1.0% | 4.6% (-3.60)#22 | 5.0% (-4.00)#1,138 |
| 23. | Lake Holm | 1.0% | 4.6% (-3.60)#23 | 5.0% (-4.00)#1,148 |
| 24. | Hansville | 1.0% | 4.6% (-3.60)#24 | 5.0% (-4.00)#1,153 |
| 25. | Tieton | 1.0% | 4.6% (-3.60)#25 | 5.0% (-4.00)#1,192 |
| 26. | Waterville | 1.0% | 4.6% (-3.60)#26 | 5.0% (-4.00)#1,194 |
| 27. | Trout Lake | 1.0% | 4.6% (-3.60)#27 | 5.0% (-4.00)#1,230 |
| 28. | Larch Way | 1.1% | 4.6% (-3.50)#28 | 5.0% (-3.90)#1,343 |
| 29. | Point Roberts | 1.1% | 4.6% (-3.50)#29 | 5.0% (-3.90)#1,398 |
| 30. | Clear Lake Cdp Pierce County | 1.1% | 4.6% (-3.50)#30 | 5.0% (-3.90)#1,401 |
| 31. | Hunts Point | 1.1% | 4.6% (-3.50)#31 | 5.0% (-3.90)#1,480 |
| 32. | Maple Heights Lake Desire | 1.2% | 4.6% (-3.40)#32 | 5.0% (-3.80)#1,561 |
| 33. | North Yelm | 1.2% | 4.6% (-3.40)#33 | 5.0% (-3.80)#1,574 |
| 34. | Newport | 1.2% | 4.6% (-3.40)#34 | 5.0% (-3.80)#1,589 |
| 35. | Amboy | 1.2% | 4.6% (-3.40)#35 | 5.0% (-3.80)#1,603 |
| 36. | Rockford | 1.2% | 4.6% (-3.40)#36 | 5.0% (-3.80)#1,687 |
| 37. | Crescent Bar | 1.2% | 4.6% (-3.40)#37 | 5.0% (-3.80)#1,712 |
| 38. | White Salmon | 1.3% | 4.6% (-3.30)#38 | 5.0% (-3.70)#1,813 |
| 39. | Yarrow Point | 1.3% | 4.6% (-3.30)#39 | 5.0% (-3.70)#1,865 |
| 40. | Parkwood | 1.4% | 4.6% (-3.20)#40 | 5.0% (-3.60)#2,016 |
| 41. | Colfax | 1.4% | 4.6% (-3.20)#41 | 5.0% (-3.60)#2,075 |
| 42. | Meadow Glade | 1.4% | 4.6% (-3.20)#42 | 5.0% (-3.60)#2,084 |
| 43. | Summitview | 1.4% | 4.6% (-3.20)#43 | 5.0% (-3.60)#2,091 |
| 44. | South Bend | 1.4% | 4.6% (-3.20)#44 | 5.0% (-3.60)#2,098 |
| 45. | Winthrop | 1.5% | 4.6% (-3.10)#45 | 5.0% (-3.50)#2,456 |
| 46. | East Renton Highlands | 1.6% | 4.6% (-3.00)#46 | 5.0% (-3.40)#2,504 |
| 47. | Terrace Heights | 1.6% | 4.6% (-3.00)#47 | 5.0% (-3.40)#2,512 |
| 48. | Ruston | 1.6% | 4.6% (-3.00)#48 | 5.0% (-3.40)#2,637 |
| 49. | Clear Lake Cdp Skagit County | 1.6% | 4.6% (-3.00)#49 | 5.0% (-3.40)#2,644 |
| 50. | Loon Lake | 1.6% | 4.6% (-3.00)#50 | 5.0% (-3.40)#2,686 |
| 51. | Gig Harbor | 1.7% | 4.6% (-2.90)#51 | 5.0% (-3.30)#2,780 |
| 52. | Riverbend | 1.7% | 4.6% (-2.90)#52 | 5.0% (-3.30)#2,878 |
| 53. | Coupeville | 1.7% | 4.6% (-2.90)#53 | 5.0% (-3.30)#2,879 |
| 54. | Nooksack | 1.7% | 4.6% (-2.90)#54 | 5.0% (-3.30)#2,906 |
| 55. | Swede Heaven | 1.7% | 4.6% (-2.90)#55 | 5.0% (-3.30)#2,922 |
| 56. | Wilbur | 1.7% | 4.6% (-2.90)#56 | 5.0% (-3.30)#2,942 |
| 57. | Camas | 1.8% | 4.6% (-2.80)#57 | 5.0% (-3.20)#3,024 |
| 58. | Fairwood Cdp Spokane County | 1.8% | 4.6% (-2.80)#58 | 5.0% (-3.20)#3,046 |
| 59. | Hockinson | 1.8% | 4.6% (-2.80)#59 | 5.0% (-3.20)#3,075 |
| 60. | Kalama | 1.8% | 4.6% (-2.80)#60 | 5.0% (-3.20)#3,111 |
| 61. | Manchester | 1.9% | 4.6% (-2.70)#61 | 5.0% (-3.10)#3,333 |
| 62. | Tracyton | 1.9% | 4.6% (-2.70)#62 | 5.0% (-3.10)#3,335 |
| 63. | Lake Goodwin | 1.9% | 4.6% (-2.70)#63 | 5.0% (-3.10)#3,336 |
| 64. | Salmon Creek | 2.0% | 4.6% (-2.60)#64 | 5.0% (-3.00)#3,583 |
| 65. | North Bend | 2.0% | 4.6% (-2.60)#65 | 5.0% (-3.00)#3,611 |
| 66. | Clearview | 2.0% | 4.6% (-2.60)#66 | 5.0% (-3.00)#3,642 |
| 67. | Three Lakes | 2.1% | 4.6% (-2.50)#67 | 5.0% (-2.90)#3,929 |
| 68. | Everson | 2.1% | 4.6% (-2.50)#68 | 5.0% (-2.90)#3,939 |
| 69. | Yacolt | 2.1% | 4.6% (-2.50)#69 | 5.0% (-2.90)#3,986 |
| 70. | Artondale | 2.2% | 4.6% (-2.40)#70 | 5.0% (-2.80)#4,160 |
| 71. | Wollochet | 2.2% | 4.6% (-2.40)#71 | 5.0% (-2.80)#4,194 |
| 72. | Lochsloy | 2.2% | 4.6% (-2.40)#72 | 5.0% (-2.80)#4,255 |
| 73. | Glenwood | 2.2% | 4.6% (-2.40)#73 | 5.0% (-2.80)#4,433 |
| 74. | Snoqualmie | 2.3% | 4.6% (-2.30)#74 | 5.0% (-2.70)#4,495 |
| 75. | Westport | 2.3% | 4.6% (-2.30)#75 | 5.0% (-2.70)#4,588 |
| 76. | Bainbridge Island | 2.4% | 4.6% (-2.20)#76 | 5.0% (-2.60)#4,768 |
| 77. | Bonney Lake | 2.4% | 4.6% (-2.20)#77 | 5.0% (-2.60)#4,775 |
| 78. | Silver Firs | 2.4% | 4.6% (-2.20)#78 | 5.0% (-2.60)#4,776 |
| 79. | Fort Lewis | 2.4% | 4.6% (-2.20)#79 | 5.0% (-2.60)#4,792 |
| 80. | Sudden Valley | 2.4% | 4.6% (-2.20)#80 | 5.0% (-2.60)#4,820 |
| 81. | Grand Mound | 2.4% | 4.6% (-2.20)#81 | 5.0% (-2.60)#4,854 |
| 82. | Big Lake | 2.4% | 4.6% (-2.20)#82 | 5.0% (-2.60)#4,878 |
| 83. | Cle Elum | 2.4% | 4.6% (-2.20)#83 | 5.0% (-2.60)#4,886 |
| 84. | Lake Morton Berrydale | 2.5% | 4.6% (-2.10)#84 | 5.0% (-2.50)#5,068 |
| 85. | Quincy | 2.5% | 4.6% (-2.10)#85 | 5.0% (-2.50)#5,091 |
| 86. | Kayak Point | 2.5% | 4.6% (-2.10)#86 | 5.0% (-2.50)#5,185 |
| 87. | Mukilteo | 2.6% | 4.6% (-2.00)#87 | 5.0% (-2.40)#5,346 |
| 88. | Fobes Hill | 2.6% | 4.6% (-2.00)#88 | 5.0% (-2.40)#5,468 |
| 89. | Sammamish | 2.7% | 4.6% (-1.90)#89 | 5.0% (-2.30)#5,638 |
| 90. | Mercer Island | 2.7% | 4.6% (-1.90)#90 | 5.0% (-2.30)#5,657 |
| 91. | Ferndale | 2.7% | 4.6% (-1.90)#91 | 5.0% (-2.30)#5,678 |
| 92. | Mount Vista | 2.7% | 4.6% (-1.90)#92 | 5.0% (-2.30)#5,695 |
| 93. | Pacific | 2.7% | 4.6% (-1.90)#93 | 5.0% (-2.30)#5,719 |
| 94. | Medical Lake | 2.7% | 4.6% (-1.90)#94 | 5.0% (-2.30)#5,735 |
| 95. | Friday Harbor | 2.7% | 4.6% (-1.90)#95 | 5.0% (-2.30)#5,775 |
| 96. | Brewster | 2.7% | 4.6% (-1.90)#96 | 5.0% (-2.30)#5,787 |
| 97. | East Cathlamet | 2.7% | 4.6% (-1.90)#97 | 5.0% (-2.30)#5,854 |
| 98. | Steilacoom | 2.8% | 4.6% (-1.80)#98 | 5.0% (-2.20)#5,985 |
| 99. | Ahtanum | 2.8% | 4.6% (-1.80)#99 | 5.0% (-2.20)#6,026 |
| 100. | Marietta Alderwood | 2.8% | 4.6% (-1.80)#100 | 5.0% (-2.20)#6,027 |
Common Questions
What are the Top 10 Cities with the Lowest Unemployment Rate in Washington?
Top 10 Cities with the Lowest Unemployment Rate in Washington are:
#1
0.30%
#2
0.50%
#3
0.50%
#4
0.60%
#5
0.60%
#6
0.60%
#7
0.60%
#8
0.60%
#9
0.70%
#10
0.70%
What city has the Lowest Unemployment Rate in Washington?
Leavenworth has the Lowest Unemployment Rate in Washington with 0.30%.
What is the Unemployment Rate in the State of Washington?
Unemployment Rate in Washington is 4.6%.
What is the Unemployment Rate in the United States?
Unemployment Rate in the United States is 5.0%.